Keywords: gallium phosphide ; heterojunction ; silicon ; solar cell ; MOCVD. 1. Introduction ... indium tin oxide (ITO) transparent electrode. .... The pieces of silicon were then passivated with a-Si:H on both side and the minority carrier lifetime.
Available online at www.sciencedirect.com
ScienceDirect Energy Procedia 77 (2015) 493 – 499
5th International Conference on Silicon Photovoltaics, SiliconPV 2015
Evolution of bulk c-Si properties during the processing of GaP/c-Si heterojunction cell Renaud Varachea, Maxime Darnonb, Médéric Descazeauxa, Mickael Martinb, Thierry Baronb, Delfina Muñoza a
b
CEA-INES, LITEN, 50 Avenue du Lac Léman, F-73375 Le Bourget-du-Lac, France Univ. Grenoble Alpes , CNRS, CEA-Leti Minatec, LTM, F-38054 Grenoble Cedex, France
Abstract One of the limitations of current amorphous silicon/crystalline silicon heterojunction solar cells are optical losses in the amorphous silicon (a-Si:H) layers that limit the short circuit current. In this work, we propose to replace amorphous silicon layers by a thin crystalline gallium phosphide (GaP) layer in heterojunctions solar cells. We show that the better transparency of GaP compared to a-Si:H promises gain in the UV region. However, the annealing in the MOCVD chamber before GaP growth that is necessary for high quality GaP epitaxial growth degrades the bulk silicon minority carrier lifetime. This degradation is attributed to fast diffusing species and can be overcome by a gettering process. © 2015 Published by Elsevier Ltd. This is an open access article under the CC BY-NC-ND license © 2015 The Authors. Published by Elsevier Ltd. (http://creativecommons.org/licenses/by-nc-nd/4.0/). Peer review by the scientific conference committee of SiliconPV 2015 under responsibility of PSE AG. Peer review by the scientific conference committee of SiliconPV 2015 under responsibility of PSE AG Keywords: gallium phosphide ; heterojunction ; silicon ; solar cell ; MOCVD
1. Introduction Heterojunctions silicon-based solar cells have been studied for years [1-6,7]. There has been a regain of interest in these structures with the development and commercialization of so-called HIT solar cells by the Japanese company Panasonic [8]. Such solar cells have shown record efficiencies of 24.7% with front contacts and 25.6% with back contacts thanks to the extremely good passivation of the silicon surface by intrinsic hydrogenated amorphous silicon (a-Si:H) layers and to the large band-gap of a-Si:H [9]. However, absorption in the a-Si:H layer limits the efficiency in the UV region. To leverage the progresses made in heterojunction solar cells while improving the efficiency in the UV, it would be interesting to integrate new materials as front emitter with a higher transparency than a-Si:H.
1876-6102 © 2015 Published by Elsevier Ltd. This is an open access article under the CC BY-NC-ND license (http://creativecommons.org/licenses/by-nc-nd/4.0/). Peer review by the scientific conference committee of SiliconPV 2015 under responsibility of PSE AG doi:10.1016/j.egypro.2015.07.070
494
Renaud Varache et al. / Energy Procedia 77 (2015) 493 – 499
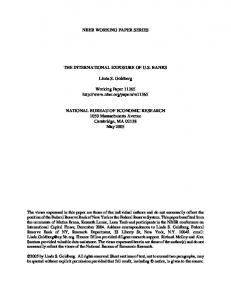
Gallium Phosphide (GaP) has a lattice constant of 5.4906 Å that is close to the one of c-Si (5.4307 Å ), making it candidate for epitaxial growth on silicon [10]. In addition, GaP has a bandgap energy of 2.26 eV at 300 K and is therefore transparent to photons with a wavelength above 545 nm [2,11-13]. Some groups have investigated GaP as a material for heterojunctions or as a window layer on silicon solar cells [1,2,11,12,14]. Shahai and Milnes have computed several heterojunctions solar cells including a 5 μm- and a 250 μm-thick GaP layer on silicon. They estimate the efficiency around 10%, close to the efficiency of the Silicon homojunction they computed. They anticipate though a loss in photogeneration because the optical absorption edge in the UV is sharper for GaP than for c-Si [2]. Katoda and Kishi reported the first GaP/c-Si heterojunction solar cell with an open circuit voltage (VOC) of 660 mV and an efficiency of 1.7% [11]. Landis et al. used GaP grown by MOCVD (Molecular Organic Chemical Vapor Deposition) as a window layer on an homojunction silicon solar cell but also reported the GaP/c-Si heterojunction solar cell results in their paper. They obtain a VOC of 603 mV, which is lower than the one of their homojunction silicon solar cell. They showed that the GaP heterojunction provided excellent passivation but was significantly absorbing in the short wavelengths end of the spectrum [12]. Huang et al. used LPE (Liquid Phase Epitaxy) to form multijunctions GaP/c-Si solar cells and also report a GaP/c-Si heterojunction solar cell with a VOC of 508 mV and an efficiency of 8%. Recent progresses have been published on GaP growth on silicon. On nominal c-Si wafers, it has been demonstrated that antiphase boundary defects (APD) could be confined to the first 40 nm [15]. By choosing a slight miscut angle and proper growth initiation, the volume of the APDs could be also minimized [16]. In this paper, we propose to use GaP as a replacement of amorphous silicon on the front side of heterojunction silicon solar cells. A 10 nm-thick layer of GaP is grown by epitaxy on nominal silicon by Metal Organic Chemical Vapor Deposition (MOCVD), and the integration flow of a-Si:H/c-Si heterojunction solar cells is used to build a solar cell with a GaP/c-Si heterojunction. We will first discuss the best structures and the limitation of cGaP/c-Si heterojunction solar cells, and we will discuss then the origin of the limitations. 2. Experimental setup The proposed structure of GaP/c-Si heterojunction solar cell consists of a p- or n-type crystalline silicon base with a n-type GaP front layer and an a-Si:H (intrinsic and p-type) back layer. For p-type base, the structure has a front emitter while for n-type base the structure has a back emitter. Each surface is covered then with a 70 nm-thick indium tin oxide (ITO) transparent electrode. The back side electrode is a blank silver sheet while the front side electrode is made of screen-printed silver paste grid with one central bus bar and 25 fingers covering an active area of 25 cm2. Reference solar cells with an intrinsic and n-type a-Si:H front emitter are also used for comparison. The c-GaP growth is performed in a Metal Organic Chemical Vapor Deposition (MOCVD) tool from Applied Material operating on 300 mm silicon wafers. Before the growth, the substrate is deoxidized using a Siconi dry process (NH3/NF3 remote plasma) in a separate chamber. Then, the wafer is transferred under vacuum to the MOCVD chamber were it is annealed before the actual GaP growth. Silicon diffusion in the GaP results in an n-type doping of the GaP. The complete process flow for the reference a-Si:H/c-Si and for the c-Si/c-GaP heterojunction solar cells is depicted in Figure 1. The spectral response is determined using a Spequest system. A broadband light source is first monochromatized between 300 nm and 1300 nm with a step size of 10 nm and chopped at 30 Hz. It shines on the solar cell while the short circuit current is measured with a lock-in amplifier. The source intensity as well as the reflected light are monitored with CCD detectors to extract the external and internal quantum efficiency. The minority carrier lifetime is measured with a Sinton WCT120 in Quasi Steady State Photoconductance (QSSPC) or in transient mode with a flash duration of 1 s or 1/64 s, respectively.
Renaud Varache et al. / Energy Procedia 77 (2015) 493 – 499
Fig. 1. Process flow used for solar cells fabrication.
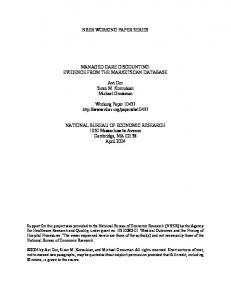
3. Experimental results 3.1. Observation of silicon substrate degradation The Internal Quantum Efficiencies measured on finished cells are shown on figure 2. Different solar cells structures with a front (p-type silicon substrate) and a rear (n-type Si substrate) emitter are reported. First it is worth noticing that the cell with a (n)GaP/(p)c-Si heterojunction has a better response for wavelengths between 400 nm and 600 nm compared to the cell with a (i+n)a-Si:H/(p)c-Si heterojunction (reference cell). This is attributed to the better transparency of GaP compared to amorphous silicon in the UV-region. However, this cell also shows a strong degradation for longer wavelengths compared to the reference cell. This degradation is attributed to a degradation of the bulk silicon properties during the cell fabrication process. Interestingly, the rear emitter cell with front GaP shows an extremely low IQE over the whole wavelength range, indicating clearly for the first time that GaP does not chemically passivate the c-Si surface. For the largest wavelengths, the IQE reaches the values of the front emitter structure with GaP, confirming the degradation of the bulk properties for both structures with GaP front layer. These data indicate that the appropriate structures for c-GaP/c-Si based solar cells would be a front emitter structure with GaP on the front surface to beneficiate from the better transparency and from the field effect to minimize losses in the heterojunction. However, for such a structure to compete with standard a-Si:H/c-Si heterojunctions, the degradation of the bulk silicon properties must be understood and overcome. 100 90 80
IQE (%)
70 60
Substrate: (n)c-Si substrate: rear emitter (p)c-Si substrate: front emitter
50 40
Front layer: (i+n)a-Si:H (n)Gap
30 20 10 0 300
400
500
600
700
800
900
1000
1100
1200
Wavelength (nm)
Fig. 2. Internal Quantum Efficiency (IQE) measurement for cells with different structures and thermal treatments.
495
496
Renaud Varache et al. / Energy Procedia 77 (2015) 493 – 499
3.2. Origin of the substrate degradation
a)
Minority carriers effective lifetime (s)
Minority carriers effective lifetime (s)
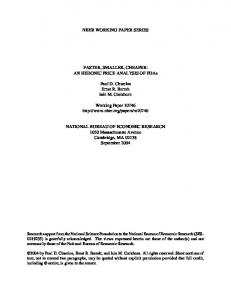
To determine the origin of the IQE degradation at the longest wavelengths, we performed minority carrier lifetime measurements on silicon substrates passivated with a-Si:H layers on both sides. Before the a-Si:H deposition, the silicon substrates were treated with specific steps of the process flow for GaP/c-Si fabrication: the wafers were treated or not with the Siconi process and the wafers were annealed or not in the MOCVD chamber. When the wafers were not annealed, they were placed on the MOCVD chuck for few minutes without process. The minority lifetime is reported figure 3.a. This figure clearly shows two populations for the various treatments. In the upper part of the graph, substrates without annealing in the MOCVD chamber present a minority carrier lifetime larger than 1 ms. Therefore the bulk properties of the silicon substrate were not degraded during the treatments. In the lower part of the graph, substrates with annealing in the MOCVD chamber present a minority carrier lifetime below 1 ms. This clearly indicates that the thermal treatment performed in the MOCVD chamber is responsible for the minority carrier lifetime degradation in the bulk silicon. One wafer that sat in the MOCVD chamber were then treated in an oven operated at an identical temperature as the nominal thermal treatment. In this case (not shown here), the minority lifetime was comparable to the one of a silicon substrate that did not see the MOCVD chamber environment before the thermal treatment. To clarify the role of the thermal treatment on the minority carrier lifetime degradation, we performed additional experiments with various maximum temperature for the thermal treatment (see figure 3.b). In this case too, the silicon wafers were passivated with a-Si:H before minority carrier lifetime measurements. These data clearly show the dramatic effect of the temperature in the MOCVD chamber on the minority carrier lifetime. All these experiments indicate that the minority carrier lifetime degradation is induced by the simultaneous exposition of the silicon to the MOCVD chamber environment and the thermal treatment at a temperature above nominal temperature – 100°C. This tends to indicate that the minority carrier lifetime degradation is due to the contamination of the bulk silicon by species present in the MOCVD chamber that are simultaneously activated by the thermal treatment.
Reference MOCVD chamber without process Annealing in MOCVD chamber Siconi process and MOCVD chamber without process Siconi process and annealing in MOCVD chamber
-3
10
b) No annealing Nominal temperature Nominal temperature - 100°C Nominal temperature - 200°C Nominal temperature - 300°C
-3
10
-4
10
-4
10
10
13
14
10
15
10
-3
Excess minority carrier concentration (cm )
10
16
13
10
14
10
15
10
-3
Excess minority carrier concentration (cm )
10
16
Fig. 3. (a) Minority carrier lifetime measured in p-type 300 mm, 750 μm thick CZ silicon wafers for various treatments in the MOCVD chamber. (b) Minority carrier lifetime measured in p-type 300 mm CZ silicon wafers for various treatments temperature in the MOCVD chamber.
3.3. Analysis of silicon contamination Additional experiments have been performed to confirm the origin of the minority carrier lifetime degradation. First we exposed a silicon wafer covered by 500 nm of PECVD silicon nitride barrier (each face) to the thermal treatment in the MOCVD chamber. Excellent minority carrier lifetimes are measured (see figure 4.a.), which indicates that the 500 nm-thick Si3N4 layer prevents the contaminating species diffusion in the bulk silicon. Second we etched with a diluted KOH solution pieces of silicon extracted from a reference wafer and from a wafer that was annealed in the MOCVD chamber. The amount of silicon removed by the chemical bath was determined with a microbalance. The pieces of silicon were then passivated with a-Si:H on both side and the minority carrier lifetime was measured. The results presented Figure 4.b. show that even after more than 20 μm was removed from each side
497
Renaud Varache et al. / Energy Procedia 77 (2015) 493 – 499
a)
Without annealing With annealing in the MOCVD chamber
Minority carriers effective lifetime (s)
Minority carriers effective lifetime (s)
of the silicon, the bulk properties of the silicon did not change. This shows that the contaminating species is a fast diffusing species that diffuses more than 20 μm inside the silicon. Finally, TXRF analyses were performed on a sample thermally treated in the MOCVD chamber. As shown table 1, no significant difference is observed except for As and Mg between the reference sample and the thermally treated sample, which indicates that the concentration of the contaminating species is below the detection level. The Mg detection is a measurement artefact from interference with the As line. This was confirmed by ICPMS where Mg concentration was below the detection level of 109 cm-3. Arsenic is a dopant for silicon and is not known to be a recombination center. These various experiments confirm that the minority carrier lifetime degradation is attributed to a contaminating species diffusion from the MOCVD chamber to the sample. The contaminating species has a very low concentration and diffuses across (at least) 20 μm.
-3
10
-4
10
10
13
14
15
10
10
10
-3
Excess minority carrier concentration (cm )
10
-2
10
-3
b)
Without annealing Without annealing + 23μm etch With annealing With annealing + 24μm etch
10
16
-4
10
13
10
14
10
15
-3
Excess minority carrier concentration (cm )
10
16
Fig. 4. Minority carrier lifetime measured (a) on p-type 200 mm, 750 μm CZ silicon wafers covered with 500 nm-thick Si3N4 with and without annealing in the MOCVD chamber. (b) Minority carrier lifetime measured on p-type 300 mm CZ silicon after etching more than 20 μm from each side of the sample (with and without annealing in the MOCVD chamber) Table 1. Elemental concentration in cm-3 of contamination at the wafer of p-type 300 mm CZ silicon wafer measured by TXRF. *The Mg line interferes with the As line ��
Al�
As�
Au�
Br�
Ca�
Cl�
Co�
Cr�
Cu�
Fe�
Ref.� Annealed� ��