Air Conditioning and Refrigeration Center A National Science Foundation/University ... Amana Refrigeration, Inc. ... Air Conditioning & Refrigeration Center ...... Figure 3.12 Lift degradation term divided into three parts for µ=0.5 and Ï=50 sec .
University of Illinois at Urbana-Champaign
Air Conditioning and Refrigeration Center
A National Science Foundation/University Cooperative Research Center
Effect of Shorter Compressor On/Off Cycle Times on A/C System Performance S. M. Ilic, C. W. Bullard, and P. S. Hrnjak
ACRC CR-43
December 2001
For additional information: Air Conditioning and Refrigeration Center University of Illinois Mechanical & Industrial Engineering Dept. 1206 West Green Street Urbana, IL 61801 (217) 333-3115
Prepared for Copeland Corporation
The Air Conditioning and Refrigeration Center was founded in 1988 with a grant from the estate of Richard W. Kritzer, the founder of Peerless of America Inc. A State of Illinois Technology Challenge Grant helped build the laboratory facilities. The ACRC receives continuing support from the Richard W. Kritzer Endowment and the National Science Foundation. The following organizations have also become sponsors of the Center.
Alcan Aluminum Corporation Amana Refrigeration, Inc. Arçelik A. S. Brazeway, Inc. Carrier Corporation Copeland Corporation Dacor Daikin Industries, Ltd. Delphi Harrison Thermal Systems General Motors Corporation Hill PHOENIX Honeywell, Inc. Hydro Aluminum Adrian, Inc. Ingersoll-Rand Company Invensys Climate Controls Kelon Electrical Holdings Co., Ltd. Lennox International, Inc. LG Electronics, Inc. Modine Manufacturing Co. Parker Hannifin Corporation Peerless of America, Inc. Samsung Electronics Co., Ltd. Tecumseh Products Company The Trane Company Valeo, Inc. Visteon Automotive Systems Wolverine Tube, Inc. York International, Inc. For additional information: Air Conditioning & Refrigeration Center Mechanical & Industrial Engineering Dept. University of Illinois 1206 West Green Street Urbana, IL 61801 217 333 3115
Abstract Effects of compressor on/off cycle times shorter than typical a/c heat exchanger thermal time constant (~1 min) were examined as a method of cooling capacity regulation. Short compressor on/off cycle times enable the use of heat exchangers continuously throughout entire off-cycle, thus reducing on-cycle temperature lift and increasing COP compared to conventional cycling. Experiments were done for a typical residential a/c system for run time fractions from 0.3 to 1.0, and cycle periods from 10 to 80 seconds. The objective was to understand how pulsed refrigerant flow from the compressor affects performance of the other components. Refrigerant side heat transfer resistance, pressure drop, and magnitude and curvature of heat exchanger surface temperature fluctuations were identified as the most influential factors affecting system performance. Virtually identical effects were observed for wet and dry coil experiments. Results at a run time fraction of 0.56 were compared to continuous (simulating variable speed) operation of a smaller compressor providing the same cooling capacity. Cycling the compressor at cycle periods of 10-80 sec degraded the performance of other components enough to reduce COP by approximately 2.5-7.5%, respectively. The corresponding COP loss for conventional long-cycling was 11.5%, all on the condenser side, because evaporator surface temperature was held constant to ensure that sensible and latent capacities were comparable. Comp arisons of actual variable speed and cycling strategies must also account for parasitic power such as inverter losses and differences in fan and blower power.
ii
Table of Contents Page
Abstract .........................................................................................................................................ii List of Figures ............................................................................................................................. v List of Tables ............................................................................................................................. vii Nomenclature........................................................................................................................... viii Chapter 1: Introduction ............................................................................................................ 1 1.1 Background........................................................................................................................... 1 1.2 Purpose ................................................................................................................................. 2
Chapter 2: Experimental facility, test matrix and procedure ......................................... 3 2.1 Experimental facility.............................................................................................................. 3 2.2 Test procedure ...................................................................................................................... 4 2.3 Test matrix ............................................................................................................................ 5
Chapter 3: Analysis of factors affecting short-cycling performance........................... 7 3.1 Evaluating short-cycling performance .................................................................................. 7 3.2 Factors affecting short-cycling efficiency ............................................................................. 8 3.2.1 Refrigerant side heat transfer................................................................................................................................8 3.2.2 Pressure drop...........................................................................................................................................................8 3.2.3 Thermal capacitance (heat exchanger metal temperature nonlinearity)........................................................8 3.3 Analysis of short-cycling experiments.................................................................................. 9 3.3.1 Automobile a/c system experiments....................................................................................................................9 3.3.2 Residential a/c system experiments ...................................................................................................................10 3.4 Effect of evaporator thermal capacitance............................................................................ 17 3.4.1 Model validation using the experimental measurements...............................................................................18 3.4.2 Effect of changing the design variables hAair and Cm.....................................................................................20 3.5 Wet coil performance under short-cycling .......................................................................... 23 3.6 Open vs. closed valve operation......................................................................................... 26
Chapter 4: Short-cycling comparison to continuous operation .................................29 4.1 Short-cycling losses at µ=0.56 compared to continuous operation .................................... 29 4.2 Lift degradation terms breakdown for τ=0, 10 and 80 seconds at µ=0.56 ............................ 31 4.3 Lift loss for τ=10 and 80 seconds at µ=0.56......................................................................... 34 4.3.1 Losses due to short-cycling at τ=10 seconds ...................................................................................................35 4.3.2 Losses due to short-cycling at longer cycle periods (τ=80 seconds)...........................................................36 4.4 Short-cycling comparison to conventional cycling ............................................................. 37
iii
Chapter 5: Conclusions..........................................................................................................38 5.1 Defining an ideal baseline for comparing capacity regulation methods.............................. 38 5.2 Factors affecting short-cycling COP degradation ............................................................... 38 5.2.1 Refrigerant side heat transfer resistance...........................................................................................................38 5.2.2 Pressure drop.........................................................................................................................................................39 5.2.3 Heat exchanger thermal capacitance .................................................................................................................39 5.2.4 Other effects...........................................................................................................................................................39 5.3 Short-cycling compared to variable-speed meeting ~1/2 of design load............................. 40 5.3.1 Losses for 10-second cycle period.....................................................................................................................40 5.3.2 Losses for 80-second cycle period.....................................................................................................................40 5.4 Short-cycling compared to conventional cycling ................................................................ 41
References.................................................................................................................................42 Appendix A: Short-cycling experiments on R134a mobile a/c system .....................43 A.1 Purpose .............................................................................................................................. 43 A.2 Experimental setup............................................................................................................. 43 A.3 Experiment description ...................................................................................................... 43 A.4 Experimental results and analysis...................................................................................... 44 A.5 Conclusions ....................................................................................................................... 49
Appendix B: Experimental setup for residential a/c system ........................................51 B.1 A/C refrigeration loop and components.............................................................................. 51 B.2 Environmental chambers and evaporator wind tunnel....................................................... 55 B.3 Measured parameters......................................................................................................... 55 B.3.1 Measured parameters providing information about COP..............................................................................56 B.4 Data acquisition .................................................................................................................. 58 B.4.1 Data acquisition system ......................................................................................................................................59 B.4.2 Slow data sampling for instantaneous display................................................................................................60 B.4.3 Fast data sampling................................................................................................................................................62
Appendix C: Short-cycling experiments at 26.7/27.7 o C (80/82o F) .............................65 C.1 Dry coil experiments........................................................................................................... 65 C.1.1 Short-cycling losses at µ=0.57 compared to continuous operation.............................................................65 C.1.2 Temperature lift degradation breakdown for τ=0, 50 seconds at µ=0.57...................................................67 C.1.3 Lift loss for τ=10 and 50 seconds at µ=0.57 ...................................................................................................68 C.1.4 Short-cycling comparison to conventional cycling........................................................................................69 C.2 Wet coil experiments at 26.7/27.7 C (80/82 F)...................................................................... 70
APPENDIX D: Temperature lift degradation for open vs. closed valve.....................72
iv
List of Figures Page Figure 2.1 The change in capacity and air flow rate with run time fraction...........................................................................4 Figure 3.1 Automotive a/c system efficiency comparison; variable speed vs. short-cycling..............................................9 Figure 3.2 COP degradation with cycle period for experiments at µ=0.5 ............................................................................10 Figure 3.3 The saturation temperature lift increase with τ for experiments at µ=0.5 .........................................................10 Figure 3.4 Lift degradation term increase with cycle period for experiments at µ=0.5 .....................................................11 Figure 3.5 Lift degradation term as a function of cycle period and run time fraction ........................................................12 Figure 3.6 Temperature lift as a function of µ for τ=10 sec....................................................................................................13 Figure 3.7 Lift degradation term as a function of µ for τ=10 sec...........................................................................................13 Figure 3.8 Refrigerant heat transfer part of temperature lift degradation term, ∆Te(rht) ...................................................14 Figure 3.9 Refrigerant pressure drop part of lift degradation term, ∆Te(∆P) .......................................................................15 Figure 3.10 Nonlinear evaporator metal temperature, T m,e, oscillations at µ=0.5 and τ=50 sec.......................................16 Figure 3.11 Metal temperature nonlinearity part of a COP loss term, ∆Te(nonlin) ............................................................16 Figure 3.12 Lift degradation term divided into three parts for µ=0.5 and τ=50 sec ...........................................................17 Figure 3.13 Experimentally obtained values of hAair,e for the range of µ and τ ..................................................................19 Figure 3.14 Experimentally obtained values of C m for the range of µ and τ........................................................................19 Figure 3.15 The model results comparison to the experimental results at µ=0.5 and τ=80 sec........................................20 Figure 3.16 Calculated evaporator metal temperature..............................................................................................................21 Figure 3.17 Influence of halving C m............................................................................................................................................22 Figure 3.18 Influence of doubling hAair,e....................................................................................................................................22 Figure 3.19 COP degradation with cycle period for dry coil experiments ...........................................................................24 Figure 3.20 COP degradation with cycle period for wet coil experiments...........................................................................24 Figure 3.21 On -cycle average saturation temperatures for dry coil experiments ................................................................25 Figure 3.22 On -cycle average saturation temperatures for wet coil experiments................................................................25 Figure 3.23 Evaporator metal and dew point temperature at µ=0.3 and τ=80 sec ..............................................................26 Figure 3.24 Refrigerant mass flow rate into the evaporator overlaid for OV and CV........................................................27 Figure 3.25 Evaporator and condenser saturation temperatures overlaid for OV and CV.................................................28 Figure 4.1 Saturation temperature lift and degradation terms increase with τ.....................................................................29 Figure 4.2 Coefficient of performance decrease with τ ...........................................................................................................30 Figure 4.3 Evaporator side lift degradation term increase with τ...........................................................................................31 Figure 4.4 Condenser side lift degradation term increase with τ............................................................................................31 Figure 4.5 Lift degradation term breakdown on evaporator side ...........................................................................................32 Figure 4.6 Lift degradation term breakdown on condenser side ............................................................................................32 Figure 4.7 Evaporator degradation term for VS operation (τ=0) ...........................................................................................33 Figure 4.8 Evaporator degradation term for SC at τ=10 sec ...................................................................................................33 Figure 4.9 Evaporator degradation term for SC at τ=80 sec ...................................................................................................34 Figure 4.10 Breakdown of the lift loss term on evaporator side.............................................................................................34 Figure 4.11 Breakdown of the lift loss term on condenser side..............................................................................................35 Figure 4.12 Evaporator pressure drop at τ=10 sec (short-cycling) and τ=0 sec (continuous)...........................................35 v
Figure 4.13 COP comparison to conventional cycling.............................................................................................................37 Figure A.1 Experiment results for short-cycling (SC) and variable speed (VS) capacity regulation method................46 Figure A.2 Change of compressor work and evaporator capacity for SC at τ=10 sec and VS .........................................46 Figure A.3 Change of coefficient of performance of cycle for SC at τ=10 sec and VS.....................................................47 Figure A.4 Saturation temperatures averaged over on-cycle for VS and SC .......................................................................48 Figure A.5 Change in evaporator and condenser saturation temperatures for two cycles of short-cycling operation at µ=0.35 and τ=10 sec .......................................................................................................................................48 Figure A.6 Change in evaporator and condenser saturation temperatures for two cycles (τ=10 seconds) for run time fractions µ=0.8, 0.6 and 0.35......................................................................................................................................49 Figure B.1 Residential a/c facility for short-cycling.................................................................................................................52 Figure B.2 1st slow sampling and averaging program screen shot........................................................................................60 Figure B.3 2nd Slow sampling and averaging program screen shot......................................................................................61 Figure B.4 3rd slow sampling and averaging program screen shot........................................................................................61 Figure B.5 4th slow sampling and averaging program screen shot........................................................................................62 Figure B.6 5th slow sampling and averaging program screen shot........................................................................................62 Figure B.7 1st screen shot of entire fast sampling and averaging program..........................................................................63 Figure B.8 2nd screen shot of fast sampling and averaging program ....................................................................................63 Figure B.9 E1313A Direct I/O control panel, configuration panel. .......................................................................................64 Figure B.10 E1313A Direct I/O control panel, engineering units panel...............................................................................64 Figure B.11 E1313A Direct I/O control panel, scan-list panel...............................................................................................64 Figure B.12 E1313A Direct I/O control panel, trigger panel. .................................................................................................64 Figure C.1 Saturation temperature lift and degradation terms increase with τ ....................................................................65 Figure C.2 Coefficient of performance decrease with τ...........................................................................................................66 Figure C.3 Evaporator side lift degradation term increase with τ..........................................................................................66 Figure C.4 Condenser side lift degradation term increase with τ...........................................................................................67 Figure C.5 Lift degradation term breakdown on evaporator side...........................................................................................67 Figure C.6 Lift degradation term breakdown on condenser side............................................................................................68 Figure C.7 Breakdown of the lift loss term on evaporator side..............................................................................................68 Figure C.8 Breakdown of the lift loss term on condenser side...............................................................................................69 Figure C.9 COP comparison to conventional cycling ..............................................................................................................69 Figure C.10 Saturation temperature lift and degradation terms increase with τ..................................................................70 Figure C.11 Coefficient of performance decrease with τ ........................................................................................................71 Figure D.1 Evaporator metal and saturation temperature for CV ..........................................................................................73 Figure D.2 Evaporator metal and saturation temperature for OV..........................................................................................73 Figure D.3 Evaporator superheat for CV....................................................................................................................................74 Figure D.4 Evaporator superheat for OV....................................................................................................................................74 Figure D.5 Evaporator pressure drop overlaid for OV and CV operation ............................................................................75
vi
List of Tables Page Table 2.2 Test matrix for automotive a/c system experiments .................................................................................................6 Table 3.1 Temperature lift degradation breakdown ..................................................................................................................12 Table 3.2 Experimental results compared for OV and CV operation....................................................................................27 Table A.1 Experimental results for short-cycling and variable speed capacity regulation method..................................44 Table A.2 Condenser and evaporator saturation temperatures for VS and SC operation (τ=10s)....................................47 Table B.1 Short-cycling parameters and instruments used for measurements.....................................................................53 Table D.1 Lift degradation term and its components for OV and CV operation.................................................................72
vii
Nomenclature A
area, m2
AMTD
arithmetic mean temperature difference
c C
specific heat, kJ/kg-K & * c) , kJ/K thermal capacitance ( m
COP
coefficient of performance
∆T
temperature difference, °C
∆Tc
condenser side degradation term, °C
∆Te
evaporator side degradation term, °C
∆Tsat
temperature lift (cond-evap saturation temperature difference), °C
∆P
pressure drop, kPa
∆u
internal energy difference.
h
heat transfer coefficient, kW/m2 -K
hA
product of heat transfer coefficient and corresponding area (h*A)
& Q e & Q
ref
evaporator capacity, kW refrigerant side heat transfer rate, kW
t
time, s
u
internal energy, kJ/kg-K
& V
volumetric air flow rate, cfm or m3 /s
W
power, kW
x
refrigerant quality
Greek µ
run time fraction
t
cycle period, s
ρ
density, kg/m3
Subscripts air
air
avg
average (mean)
c
condenser
cp
compressor
cv
closed valve
e
evaporator
f
fin
in
in
init
initial
m
metal
max
maximum
mean
arithmetic mean with respect to surface
viii
min
minimum
off
off-cycle
on
on-cycle
out
out
ov
open valve
ref
refrigerant
sat
saturation
sc
short-cycling
t
tube
vs
variable speed
ix
Chapter 1: Introduction 1.1 Background There is a need for capacity regulation in any air-conditioning system in order to maintain specified room comfort as sensible and latent loads change. Most residential air-conditioning (a/c) systems in North America are designed to meet the maximum heat load, sized to operate continuously at a specified design condition. During its lifetime an a/c system seldom operates at design conditions. In order to meet actual loads, less than the maximum, they usually operate in cycles of on and off operation, where the cycle length is determined by a deadband thermostat controlling indoor room temperature. A typical residential thermostat characteristic corresponds to approximately 3 cycles per hour at 50% system load, as discussed by Parken et al. (1977). For example, for a moderate summer day in which heat load is 50% of maximum (design) heat load, residential a/c system is on about 50% of time, and off about 50% of time. If cycle duration is 20 minutes, then it is turned off after about 10 min, stays off 10 minutes and is turned on again. For a different summer day, average evaporator capacity and compressor power, over the cycle period, are reduced by reducing compressor run time fraction. In this conventional cycling (CC) type of capacity regulation using long cycling, both evaporator capacity and compressor power have maximum values during a large portion of on-cycle and minimum values during a large portion of off-cycle. The heat exchangers (evaporator and condenser) are practically inactive during off-cycles that exceed the heat exchanger thermal time constant. This causes very high pressure lift during a large portion of the on-cycle and thus low efficiency. In addition, long cycling efficiency is affected by cyclic losses. A significant amount of work has been done in determining and quantifying cyclic losses in refrigeration systems. Refrigerant migration and component thermal masses have been identified as the important contributors to cycling losses in the work of Coulter and Bullard (1997), Krause and Bullard (1996), Wang and Wu (1990), Mulroy and Didion (1985), Murphy and Goldschmidt (1986). One alternative to the capacity regulation by long cycling is variable speed (VS) capacity regulation, in which the system runs continuously, but at lower compressor speed. The room thermostat is connected to the compressor controller such that when the heat load increases (indoor temperature increases) compressor speed increases maintaining constant indoor temperature, while the compressor operates all the time. A heat transfer surface area of heat exchangers is used in whole period of continuous operation reducing pressure lift and achieving high cycle efficiencies. The findings of Bahel and Zubair (1989), Tassou et al. (1983), Marquand et al. (1984), Toshiba (1987), Umezu and Suma (1984) show that VS systems can achieve seasonal energy savings of 15% to 40%. The cost of using VS capacity regulation method is high due to a need for inverter for changing compressor speed. Another way of regulating system capacity during the year is by cycling a compressor using shorter on/off cycle times than typical a/c heat exchanger thermal time constant (~ 1 min). Thus, the compressor short-cycling (SC) is characterized by short cycles of compressor on and off operation having duration on the order of seconds (520 sec). The room thermostat would regulate the run time fraction of short-cycling similarly to regulating speed during the variable speed regulation method. Thus, when the heat load increases (indoor temperature increases) run 1
time fraction increases maintaining constant indoor temperature. Heat exchangers are used in whole period of shortcycling operation, reducing pressure lift during the on-cycle and ideally achieving the cycle efficiency of VS capacity regulation method. The initial cost of using short-cycling capacity regulation method is potentially lower, since there is no need for inverter. Even though the short-cycling may seem as a special case of a conventional long-cycling, its performance and regulation are almost the same as during the variable speed operation. There are several important similarities to the variable speed operation. Firstly, the room thermostat doesn’t regulate directly the cycle period (as in the long-cycling), but run time fraction similar to the way compressor speed is regulated in variable speed system. Secondly, the evaporator airflow requirements for compressor short-cycling are essentially the same as for a variable-speed compressors. Since the heat exchangers are used during the whole cycle period, evaporator blower operates all the time, ideally at a speed adjusted to enable independent control of humidity. In contrast, during the long-cycling operation, the fan and blower operate only during the on-cycle, and in some instances during the short initial phase of the off-cycle during which there is still potential for exchange of heat at the condenser and evaporator. Finally, the evaporator and condenser saturation temperatures cycle with a small amplitude around almost the same average temperature as in the variable speed operation during the short-cycling operation, which provides for almost the same on-cycle pressure lift in between variable speed and short-cycling and thus almost the same energy efficiency. In the limit as cycle period is reduced to zero, short-cycling becomes indistinguishable (viewed from the perspective of heat exchangers’ response, not compressor) from VS. By increasing cycle period significantly, short-cycling operation becomes equal to the conventional long-cycling operation with the evaporator blower constantly operating. 1.2 Purpose The purpose of this report is to experimentally explore a method of capacity regulation involving compressor on/off cycle times shorter than typical a/c heat exchanger thermal time constant, Experiments were conducted in a conventional residential-scale split a/c system. The factors causing compressor short-cycling efficiency losses are identified and quantified. The experimental facility, test procedure and test matrices will be described in Chapter 2. After introducing the procedures used for evaluation of short-cycling performance in Chapter 3, the factors important for the evaluation will be explained: 1) refrigerant side heat transfer resistance, 2) pressure drop and 3) the heat exchanger thermal capacitance. Chapter 4 presents an experimental comp arison between short-cycling and continuous operation for meeting an equal and constant load, and analyzes the effect of cycle period on system performance. Conclusions are presented in Chapter 5. Appendix A compares SC and VS operation in automotive a/c system. With our residential a/c apparatus, it was not possible to compare SC with VS operation without resorting to use of different compressors and then sorting out the effects of their different efficiencies. Therefore, to compare SC and VS operation in a controlled fashion, some preliminary experiments were conducted using an automotive a/c systems. Experimental results showing almost the same efficiency of SC and VS method in automotive a/c system is presented in Appendix A (and excerpt in section 3.3.1). A description of the residential a/c system facility is presented in Appendix B. Appendix C and D present figures with experimental data related to residential a/c experiments, which were not included in the Chapters for the clarity of presentation purposes.
2
Chapter 2: Experimental facility, test matrix and procedure 2.1 Experimental facility The main components of a residential air conditioning system tested were condenser, evaporator, compressor and expansion valve. The heat exchangers (condenser and evaporator) were taken from a two-ton, R-22, unitary rooftop air conditioning system (Trane model TCH024100A). Indoor and outdoor heat exchangers for this system are made of copper tubing and plate fins, and were placed in separate environmental chambers. The heat exchangers were not modified from the original unitary a/c design in any way, but compressor, piping and expansion device were replaced. A Copeland’s two-ton hermetic scroll compressor (Copeland model ZR22K3-TF5) was fitted with a dynamic solenoid valve to enable more precise measurement and system control during the experiments. The valve ensured that no refrigerant vapor leaked back to the evaporator during the off-cycle, and eliminated power inputs during the off-cycle. The compressor was connected to a switch and timer that controlled lengths of on and off compressor operation during short-cycling. The existing commercial implementation of this concept has the mechanical clutch mechanism installed in the compressor for the purpose of engaging and disengaging scrolls, enabling power efficient short-cycling without high starting currents and potential reliability risks which exist when a switch is used. A switch was used in our experiment since our focus has been on the influence of short-cycling on the rest of the system, not compressor. The high starting currents were excluded from the analyses presented in this report. The measured start-up power peak lasted about 0.2 seconds and accounted for about 0.5 – 10 % of the cycle -average measured power, for the longest (56 sec) and shortest (3 sec) on-cycles, respectively. In addition, the system was designed to enable liquid flow into the evaporator during the whole off-cycle, by adding receiver holding enough liquid refrigerant to last during off-cycles of up to 40 seconds. A manually adjusted expansion device replaced the original TXV to enable more precise control of the experiments by eliminating the uncontrollable lags inherent in TXV’s. A solenoid valve was installed upstream of the expansion device to enable comparison of two operating modes: 1) valve continuously open; and 2) valve synchronized with compressor to isolate evaporator from condenser during off-cycle. The latter mode has been found to be an efficient strategy in conventional cycling experiments, reported by Wang and Wu (1989). Fast data scanning speed is needed to capture quick changes in measured parameters during short-cycling. All data was taken with data acquisition system which was programmed for scanning a group of more than 50 parameters in 0.2 seconds. The data acquisition system carried special 7 Hz fixed filters capable of filtering electrical noise from thermocouple measurements. The filters were installed since electric noise produces huge errors on thermocouple readings at very fast scanning rates without filters. The temperatures, pressures, powers and flow rates were measured throughout the facility. The air side and surface temperatures were measured by T-type thermocouples, and the refrigerant side temperatures were measured by T-type immersion thermocouple probes. Thermocouples were adjusted for tare values to provide the same output at the room temperature. The uncertainty in thermocouple measurement is estimated to be +-0.1o C, using manufacturer's specifications. Low range, 0 to 1” water (+/-0.4% FS), differential air pressure transducer was used for measuring the air side pressure drop across the nozzle. The refrigerant pressures and pressure drops were measured by using absolute 0 to 500 psia (+/-0.1 % FS) 3
and differential 0 to 50 psid (+/-0.25% FS) pressure transducers. Watt transducers 0 to 8 kW (+/-0.5% FS) measured the compressor, blower and heater powers. Coriolis type 0 to 680 kg/h (+/ -0.15% of reading) mass flow meter, consisting of sensor and transmitter was used for measuring the refrigerant mass flow rate. 2.2 Test procedure For clarity of presentation, this report presents results from experiments performed with dry indoor coil, at 80o F (26.7o C) indoor air, and 95o F (35o C) outdoor air temperatures used for evaluation of the short-cycling performance. The results at other experimental conditions will be presented in appendices. There is no significant difference in the COP loss analysis, for the wet and dry coil experiments, as long as the evaporator surface temperature remained lower than the dew point temperature at the end of the off-cycle. Results for a wet coil tests will be presented in section 3.5. The main method of regulating the evaporator capacity in short-cycling systems is the regulation of run time fraction. The air flow rate over evaporator was decreased along with run time fraction (capacity), in order to maintain the evaporator surface temperature at about 12o C during all experiments, as would be required during actual wet coil operation. This enabled approximately the same latent/sensible load split during the wet indoor coil surface experiments at different evaporator capacities. Figure (2.1) shows that the percent reduction from the design air flow rate was almost the same as the percent change in the evaporator capacity due to the requirement to maintain constant evaporator surface temperature. The evaporator design air flow rate was
& = 2500 cfm (1.180 m3 /s). V
100
100
75
75
50
50
25
25
Qe V 0 0.00
0.25
0.50
0.75
run time fraction - µ Figure 2.1 The change in capacity and air flow rate with run time fraction
4
0 1.00
Air flow rate [% of design V at µ=1]
Evaporator capacity [% of design capacity at µ=1]
m3 /s). The air flow rate over the condenser was kept constant for all experiments at
& = 800 cfm (0.378 V
An EEV was installed in the system and adjusted manually to achieve the desired fixed opening for each operating condition. A fixed opening proved capable of providing the desired average on-cycle superheat at the evaporator exit (of about 4o C) for experimental points at short-cycle periods (τ~10 sec). However, during longer cycle periods (τ~60 sec) the fixed opening caused large fluctuations of superheat (1 – 15o C), with especially large superheat at the end of on-cycle, causing significant degradation of evaporator capacity. A fast-responding EEV, which would maintain constant superheat at the exit of evaporator during whole cycle period was not available. Therefore to ensure that evaporator performance was repeatable, an expansion device opening was found which enabled maintenance of the two-phase refrigerant evaporator exit throughout the whole on-cycle for each experimental point. This eliminated the evaporator capacity degradation. To protect compressor from liquid slugging a tape heater was installed on the suction line. In a real system, a fast-responding EEV would serve this purpose with no additional energy input. Variation in average on-cycle suction superheat of 5 to 11o C was observed for the whole test matrix due to use of fixed orifice and tape heater instead of more suitable fast EEV. The analysis presented in Chapter 4 of the report compares short-cycling experiments done at run time fraction of 0.56 to continuous operation to meet a load of about 4.0 kW. Continuous operation was achieved by installing a nominal one-ton rotary compressor (Kenmore a/c unit, model 253.8783110, with compressor part# A445513). 2.3 Test matrix The experiments were done in automotive and residential a/c lab. The a/c systems in these two labs are described in Appendices A and B respectively. The residential a/c system experiments were conducted at several conditions: at 80/95o F (indoor/outdoor air temperature) with dry and wet coil; at 80/82o F with dry and wet coil. The test matrix listing all run time fractions and cycle periods run at thes e conditions is shown in Table 2.1. The test matrix was designed to provide information on short-cycling performance at various cycle periods and run time fractions. The compressor was short-cycled at run time fractions (µ=0.56, 0.57 or 0.58 depending on running conditions) to match exactly the capacity achieved during the continuous compressor operation. These short-cycling experiments can therefore be compared to continuous operation.
5
Table 2.1 Test matrix for residential a/c system experiments o
run time fraction 1 0.7 0.56 (0.57 wet) 0.5 0.3
wet x x x x x
80/95 F cycle period [sec] 30 50 dry wet dry x x x x x x x x x x x x x x
wet x
80/82 F cycle period [sec] 30 50 dry wet dry wet x x x
10 dry x x x x x
80 wet x x x x
dry x x x x x
wet
x
o
run time fraction 0.57 (0.58 wet)
10 dry x
80 dry
wet x
Before designing the residential a/c experiments, an initial set of experiments were conducted on an automotive a/c system using both short-cycling and variable -speed capacity regulation method. The design compressor speed was chosen. The system was run at various run time fractions and cycle periods at the design oncycle compressor speed during short-cycling operation. During the variable speed operation, the system was run at several compressor speeds lower than the design speed and the efficiencies of the two methods were compared. The test matrix listing all run time fractions, cycle periods (for short-cycling) and speeds (for variable -speed) is shown in Table (2.2). Those results, detailed in Appendix A, showed that short-cycling system efficiency could indeed approach that of variable-speed system. They also revealed that the built-in time lags of a TXV rendered it unsuitable for conducting repeatable experiments on short-cycling system. Table 2.2 Test matrix for automotive a/c system experiments
run time fraction 1
Short-cycling cycle period [sec] 5 10 15 x x x
Variable-speed compressor speed [rpm] 1700 x
0.8 0.6
x x
x x
x x
1350 1000
x x
0.35
x
x
x
700
x
6
Chapter 3: Analysis of factors affecting short-cycling performance 3.1 Evaluating short-cycling performance Widespread reliance on cycling as the preferred method for modulating capacity in a/c systems has resulted in a large body of literature that defines cycling “losses” by comparing cycling COP to the steady state COP at 100% capacity. Today, with the increasing use of variable-speed and variable-capacity compressors, it is appropriate to redefine the baseline, and measure COP degradation from a condition closer to the thermodynamic ideal. This will facilitate definitions and comparisons of a wide variety of systems, in terms of their cycling period τ, and their capacity factor µ, as the evaporator capacity decreases with run time fraction). To meet a given heating or cooling load, an ideal vapor-compression system must operate continuously to minimize temperature lift, pumping just enough refrigerant to provide the needed capacity. The thermodynamically ideal (Carnot) cycle operates between the indoor and outdoor ambient temperatures. The more realistic “ideal” baseline system operates – continuously – between heat source and sink temperatures defined by the tube temperatures of real heat exchangers, which have finite size and finite airflow rate. This ideal system would be sized to meet the maximum load, and its steady state operation can be represented generally as a limiting case of a system cycling at the range of capacities (run time fractions), µ≤1 and τ→0. On the other hand a conventional cycling system would operate at the same capacity to meet the same load, but at a cycling period τ~O (30 min) that reflects the thermal capacitance of the conditioned space. This chapter focuses on short-cycling systems having the same capacity, but τ~O (10 sec) reflecting the thermal capacitance of the heat exchangers. The time-averaged on-cycle temperature lift for all three systems (ideal baseline operation, conventional cycling and short-cycling) will be different. The lowest ideal temperature lift is defined by the difference in between the heat source and sink tube temperatures for the ideal baseline system where refrigerant side ∆T = 0. The highest temperature lift exists for the conventional cycling operation. The refrigerant saturation temperatures follow those of the heat source and sink, namely the heat exchanger surface that is in contact with the refrigerant. Due to their relatively small thermal capacitance, real heat exchangers generally achieve thermal equilibrium with the indoor and outdoor air during the first few minutes of the off-cycle. Therefore during conventional cycling, little heat is transferred from the air to the refrigerant during the off-cycle, requiring large on-cycle air side ∆T’s to achieve the required capacity. Since the compressor operates only during the on-cycle, large on-cycle air-side ∆T’s lead to high on-cycle temperature lift, causing conventional cycling systems to have the highest power requirement for the same capacity and the lowest efficiency. The purpose of short-cycling is to exploit the thermal capacitance of the heat exchangers to minimize the magnitude of oscillation of the source and sink temperatures, around those of the steadystate ideal system. That magnitude is much smaller than in the extreme case of conventional cycling. Viewed from the air side, the requirement for sensible and latent cooling capacities to be the same for all three systems implies that the cycle time averaged sink (evaporator) temperatures must be the same while the blower is operating. Since the numerator of COP is therefore constant, the amount of degradation depends solely on the power, which in turn is a function of on-cycle temperature lift. The energy efficiency will therefore be inversely proportional to the magnitude of the temperature lift. Therefore to compare short-cycling system efficiencies with
7
those of variable-speed, we monitor the difference between the whole-cycle mean tube (metal) temperature and the on-cycle mean saturation temperature in the evaporator and condenser (∆Te = T m,e – Tsat,e,on and ∆Tc = Tsat,c,on - Tm,c ). The larger the defined difference, which causes the temperature lift degradation (therefore called lift degradation term), the greater the COP degradation relative to the ideal condition. 3.2 Factors affecting short-cycling efficiency For the case of steady state operation with a variable -speed or variable-displacement compressor, the exis tence of finite refrigerant side ∆T is one factor increasing the on-cycle temperature lift, and thereby degrading COP relative to the ideal case where ∆Tref = 0. The other factor is refrigerant pressure drop, which increases temperature lift by ∆Tsat(∆Pref). 3.2.1 Refrigerant side heat transfer During short-cycling, on-cycle refrigerant side heat transfer rate must be greater, by almost a factor of 1/µ (due to low refrigerant side heat transfer rate during the off-cycle), than in the case of continuous operation at the same capacity. However the penalty in terms of on-cycle ∆Tref need not increase by the same amount (1/ µ), if the on-cycle refrigerant side heat transfer coefficient is larger. The full-speed operation of a short-cycling compressor may increase on-cycle refrigerant mass flux enough to ameliorate the COP degradation due to low offcycle heat transfer rate. 3.2.2 Pressure drop Another factor influencing COP degradation is refrigerant pressure drop, which increases temperature lift by ∆Tsat(∆Pref). Since pressure drop in a crossflow heat exchanger also increases capacity, the net effect of pressure drop on system temperature lift, in the case of constant capacity can be approximated by ∆Tsat(∆Pref/2). The degradation due to the on-cycle refrigerant pressure drop, ∆Pref,on, is expected to be greater than for continuous operation at the same capacity, due to the higher mass flux. 3.2.3 Thermal capacitance (heat exchanger metal temperature nonlinearity) Thermal capacitance is another factor affecting COP degradation during cycling, independent of the factors described above. In all cases of cycling with τ>0, the source and sink (tube) temperatures will oscillate around the same mean in order to maintain a fixed capacity. However, the on-cycle mean tube temperatures could be significantly different from the whole-cycle mean temperatures depending on the thermal capacitance of the heat exchangers. Since refrigerant saturation temperatures follow the oscillations of the tube temperatures, COP may be affected to the extent that on-cycle average surface temperatures significantly differ from the whole-cycle average, thus increasing the temperature lift. For those average saturation temperatures to be equal, the tube temperature oscillations must be linear. They are not, due to the inherently exponential nature of the heat transfer process (Figure 3.17). The worst case of nonlinearity occurs for the “step function like” tube temperature oscillations in conventional long-cycling; the on-cycle average saturation temperature is far greater than whole-cycle average. At the opposite extreme, very short cycling exploits the thermal capacitance of the heat exchangers, having almost linear tube temperature oscillations minimizing the effects of exponential nature. The linearity of those oscillations
8
would eliminate the difference between on-cycle and whole-cycle mean tube temperatures which are equal to the tube temperatures of the steady-state ideal system (Figures 3.15 and 3.16). 3.3 Analysis of short-cycling experiments The pressure lift integrated over the on-cycle (difference between condenser and evaporator saturation pressure) of the short-cycling operation is the main parameter for evaluating short-cycling performance. The higher the pressure lift, the higher compressor work required for compressing a unit of refrigerant mass. The evaporator capacity determines the refrigerant mass flow rate required. Thus, for two systems operating at the same capacity (the same refrigerant mass flow rate), the system with the higher integrated on-cycle pressure lift would consume more power and be less efficient. 3.3.1 Automobile a/c system experiments With our residential a/c apparatus, it was not possible to compare short-cycling with variable-speed operation without resorting to use of different compressors and then sorting out the effects of their different efficiencies. Therefore, to compare short-cycling and variable-speed operation in a controlled fashion, some preliminary experiments were conducted using an automotive a/c systems. These initial experiments were done with clutch-cycling an automotive scroll compressor in R134a automotive a/c system at three run time fractions (µ=0.8, 0.6 and 0.35). Run time fraction µ=1 (100% on) was chosen as the design, maximum capacity operation at 1700 rpm. Short-cycling could therefore be compared directly to the variable -speed capacity regulation method, since the compressor in the system was driven by a variable speed electric motor. The capacity during variable speed experiments was regulated by changing compressor speed to 1350 rpm, 1000 rpm and 700 rpm. The results shown in Figure 3.1 show that short-cycling achieved almost the same efficiency as variable speed operation at lower than design capacities, which is significantly higher than achieved in conventional longcycling which would be close to that observed at µ=1. µ=0.35
COPshort-cycling
4 700 rpm
µ=0.6
COPvariable,speed
COP
3
µ=0.8
1000 rpm 1350 rpm
µ=1
1700 rpm
2
1
0 1.5
2.5
3.5
Evaporator capacity [kW] Figure 3.1 Automotive a/c system efficiency comparison; variable speed vs. short-cycling
9
3.3.2 Residential a/c system experiments The focus of analysis in the next sections will be on the factors influencing the increase in pressure lift at a given capacity of short-cycling operation. The range of capacities is achieved by changing run time fraction of the short-cycling residential a/c system. To illustrate how COP decreases with pressure lift during short-cycling operation, Figures (3.2) and (3.3) show the COP and saturation temperature lift respectively, for experiments at µ=0.5 (50% on time) and several cycle periods (τ=10–80 sec) with dry evaporator surface at indoor/outdoor temperature 80/95o F.
5
COP
4
3
2
1
0 0
20
40
60
80
100
cycle period [sec] Figure 3.2 COP degradation with cycle period for experiments at µ=0.5
50
Temperature [oC]
40 30
Tsat,c,on,avg Tsat,e,on,avg
20 10 0 0
20
40
60
80
100
cycle period [sec]
Figure 3.3 The saturation temperature lift increase with τ for experiments at µ=0.5
10
3.3.2.1 The lift degradation term as a basis for evaluating the system efficiency The short-cycling operation will be evaluated by comparing it to the ideal system baseline operation. The ideal system baseline operation is defined as continuous operation at the same capacity, between heat source and sink temperatures defined by the tube temperatures of real heat exchangers. In other words the ideal baseline case corresponds to VS operation with infinite refrigerant side heat transfer coefficients causing zero refrigerant side temperature differences. Actual variable -speed system would fall short of this ideal due to its finite h ref. An ideal baseline defined in this manner allows both variable-speed and short-cycling systems to be compared in terms of their increased pressure lift caused by finite h ref, ∆Pref and other factors. The system efficiencies were compared by monitoring the difference between the whole-cycle mean tube temperature (Tm,avg) and the on-cycle mean saturation temperature (Tsat,on,avg ) in the evaporator and condenser. The larger those differences, the greater the temperature lift and COP degradation relative to the ideal condition at a given capacity. Figure 3.4 shows the same evaporator and condenser saturation temperatures (shown in Figure 3.2), with an overlay showing the whole -cycle mean heat exchanger metal temperature for experiments at µ=0.5 (about 50% of design capacity) and several cycle periods (τ=10–80 sec).
50 ∆ Tc
Temperature [oC]
40 30
Tsat,c,on,avg Tsat,e,on,avg Tm,e
20
Tm,c
∆T e
10 0 0
20
40
60
80
100
cycle period [sec]
Figure 3.4 Lift degradation term increase with cycle period for experiments at µ=0.5 The factors affecting short-cycling efficiency will be analyzed on the evaporator side. The same mechanisms and processes influence the establishment of higher on-cycle condenser saturation temperature. We will focus on the evaporator side temperature lift degradation term (∆Te = Tm,e,avg - Tsat,e,on,avg ) and its components in next paragraphs in order to explain the mechanisms causing the COP degradation during short-cycling operation. The third (bold) column of Table 3.1 shows the values of the evaporator side lift degradation term (∆Te) for the set of experiments at various run time fractions and cycle periods with dry evaporator surface at indoor/outdoor temperature 80/95o F.
11
Table 3.1 Temperature lift degradation breakdown o
run time fraction 1 0.7 0.7 0.7 0.7 0.5 0.5 0.5 0.5 0.3 0.3 0.3 0.3
∆ Te
cycle period [sec] 0 10 30 50 80 10 30 50 80 10 30 50 80
80/95 F ∆ Te(ht)
[o C] 2.7 2.5 2.7 3.2 3.6 2.3 2.8 3.5 4.8 2.0 2.7 3.3 4.3
∆ Te(nonlin)
∆ Te(∆ P)
[oC] 0.0 0.0 0.1 0.3 0.7 0.0 0.1 0.4 1.2 0.0 0.0 0.3 0.7
[oC] 0.6 0.5 0.5 0.5 0.5 0.4 0.5 0.6 0.5 0.4 0.5 0.6 0.6
[oC] 2.1 2.0 2.1 2.3 2.4 1.9 2.2 2.5 3.1 1.7 2.2 2.5 3.0
Figure 3.5 shows the lift degradation term as a function of cycle period for four run time fractions. It can be seen that the lift degradation term increases with the cycle period for a given run time fraction.
5
∆T e [ oC]
4
3
2
mu=0.7 mu=0.5
1
mu=0.3 0 0
20
40
60
80
100
cycle period [sec] Figure 3.5 Lift degradation term as a function of cycle period and run time fraction Figure (3.6) shows how on-cycle temperature lift decreases at lower run time fractions. Therefore a given value of the lift degradation term (∆Te) will have a proportionally greater effect on COP at lower capacities.
12
Temperature lift [ oC]
50
40
30 20
10 0 0
0.2
0.4
0.6
0.8
1
run time fraction - µ Figure 3.6 Temperature lift as a function of µ for τ=10 sec The absolute value of the degradation term of about 3 C at various µ, shown in Figure 3.7, represents higher percentage of saturation temperature lift at low than at high run time fractions and thus hurts performance more.
5
o ∆Te [ C]
4 3 2 1 0 0
0.2
0.4
0.6
0.8
1
run time fraction - µ Figure 3.7 Lift degradation term as a function of µ for τ=10 sec Therefore the short-cycling COP loss is actually greatest for small run time fraction (at lower capacities), despite the fact that experimental results show a larger evaporator temperature lift degradation at µ=0.5 than at µ=0.3, might appear to suggest a different conclusion.
13
3.3.2.2 Separating the lift degradation term The lift degradation term was separated into three terms, each representing one major factor increasing the temperature lift (columns 4 to 6 in Table 3.1): refrigerant side heat transfer resistance [∆Te(rht)], pressure drop [∆Te(∆P)] and nonlinearity term [∆Te(nonlin)]. Equations 3.1 to 3.4 show that mathematical sum of these three degradation terms is equal to total degradation of temperature lift. Tm,e,avg - Tsat,e,on,avg = ∆Te(rht) + ∆Te(∆P) + ∆Te(nonlin)
(3.1)
where: ∆Te(rht) = Tm,e,on,avg – Tsat,e,mean,on,avg
(3.2)
∆Te(∆P) = Tsat,e,mean,on,avg - Tsat,e,on,avg
(3.3)
∆Te(nonlin) = T m,e,avg - Tm,e,on,avg
(3.4)
3.3.2.2.1 The refrigerant side heat transfer term -- ? Te(rht) The existence of finite on-cycle refrigerant side temperature difference, ∆Tref(t)= T m,on(t) – Tsat,on (t), is one factor increasing the average on-cycle temperature lift, thereby degrading COP relative to the baseline ideal case where ∆Tref = 0. The mean evaporator surface temperature was obtained as an area-weighted average of 12 surface thermocouples located on return bends. The corresponding mean saturation temperature with respect to evaporator surface, Tsat,e,mean = Tsat,e + ∆Te(∆Pe/2), was obtained by monitoring the exit saturation pressure and the total pressure drop across the evaporator. Figure 3.8 shows the refrigerant side heat transfer lift degradation term increasing slightly with cycle period, at four run time fractions.
5
∆ Te(rht) [o C]
4
3
2
mu=0.7 mu=0.5
1
mu=0.3 0 0
20
40
60
80
100
cycle period [sec] Figure 3.8 Refrigerant heat transfer part of temperature lift degradation term, ∆Te(rht)
14
3.3.2.2.2 The pressure drop term -- ? Te(? P) The evaporator mean saturation temperature with respect to surface, Tsat,e,mean, is defined such that it does not depend on the refrigerant side pressure drop. However, the effect of evaporator pressure drop on the compressor suction pressure is exactly half of the refrigerant side pressure drop (difference between evaporator mean and exit pressure). The equation Psat,e,out = Psat,e,mean - ∆Pe/2 can be written in terms of temperatures used in equation 3.3, Tsat,e = Tsat,e,mean - ∆Te (∆Pe/2). The evaporator exit pressure was measured and used as the indicator of the temperature lift in this analysis. The compressor inlet pressure is real representative of the temperature lift, therefore the chosen pressure drop term ∆Pe/2, omits the system-specific suction line pressure drop, which is proportional to it. Figure 3.9 shows that the pressure drop term was almost constant for the set of cycle periods, as expected due to the almost constant on-cycle refrigerant mass flux resulting from the constant on-cycle compressor speed. For the same reason, the temperature lift degradation term due to the pressure drop is also nearly independent of run time fraction. 5 mu=0.7
∆Τe( ∆P) [o C]
4
mu=0.5 mu=0.3
3
2
1
0 0
20
40
60
80
100
cycle period [sec] Figure 3.9 Refrigerant pressure drop part of lift degradation term, ∆Te(∆P) 3.3.2.2.3 The metal temperature nonlinearity term -- ? Te(nonlin) Due to the inherently exponential nature of the heat transfer process, the evaporator metal temperature during the off-cycle will approach the air temperature nonlinearly. The same phenomenon occurs during the on-cycle as the metal temperature is pulled down towards the steady-state refrigerant saturation temperature. Short-cycling truncates these processes, but the fundamental asymmetry remains. As a result, the on-cycle average metal temperature is always less than the whole-cycle average, as shown in Figure 3.10. Since the compressor sees only the lower on-cycle metal temperature, there is a penalty in pressure lift for long cycle periods where the nonlinearities are the greatest.
15
16 Tm,e = f(t) ∆Te(nonlin) = 0.4 oC
T m,e,avg Tm,e,on,avg
o
T [ C]
13
10
ON - CYCLE
7
OFF - CYCLE
4 0
10
20
30
Time [sec]
40
50
Figure 3.10 Nonlinear evaporator metal temperature, T m,e, oscillations at µ=0.5 and τ=50 sec Figure (3.11) shows how this loss significantly increases with cycle period, more than was observed for the pressure drop and refrigerant heat transfer terms. The effect of evaporator metal thermal mass on the nonlinearity of the temperature fluctuations is explored in Section 3.4.2. 5 mu=0.7
o ∆ T e(nonlin) [ C]
4
mu=0.5 mu=0.3
3
2
1
0 0
20
40
60
80
100
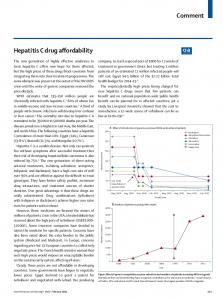
cycle period [sec] Figure 3.11 Metal temperature nonlinearity part of a COP loss term, ∆Te(nonlin) All three lift degradation terms are illustrated in Figure 3.12, for cycle period τ=50 sec and run time fraction µ=0.5.
16
Tsat,e,mean
16
Tsat,e Tm,e
T [o C]
13
Tm,e,on,avg
Tm,e,avg ∆ Te(nonlin) = 0.4oC ∆ Te(rht) = 2.5oC
10
∆Te = 3.5oC
∆ Te(∆ P) = 0.6oC
Tsat,e,mean,on,avg 7 Tsat,e,on,avg ON - CYCLE
OFF - CYCLE
4 0
10
20
30
40
50
Time [sec] Figure 3.12 Lift degradation term divided into three parts for µ=0.5 and τ=50 sec
3.4 Effect of evaporator thermal capacitance To understand the significance of parameters influencing the nonlinearity of the evaporator metal temperature fluctuation, represented by the difference in between the entire cycle and on-cycle average metal temperature, the dynamics of the evaporator metal temperature fluctuation during the compressor on and off-cycle were modeled as a 1st order, lumped capacitance system. The model validity will be checked by comparing it with the experimental results. It has been shown that the nonlinearity part of the temperature lift degradation term becomes dominant as the cycling period increases. It is possible that heat exchanger having relatively large thermal capacitance, may be able to minimize COP degradation at longer cycle periods than a less massive one. Equation 3.5 describes the change of evaporator metal temperature as a function of the air side and refrigerant side heat transfer rates. The resistance of the copper and aluminum to internal heat conduction is assumed to be small compared to convective resistance of the air side heat transfer, so the metal can be assumed to be isothermal throughout.
Cm * (
dTm & −Q & ) =Q air ref dt
(3.5)
The thermal capacitance Cm = c t *mt + c f* mf = 14 kJ/K (about 60% tubes, 40% fins) was calculated from the dimensions of evaporator fins and tubes, assuming the densities and specific heats of copper and aluminum to be 0.356 kJ/kg-K and 0.886 kJ/kg-K respectively. The heat transfer rate from the air to the evaporator metal, during both compressor off and on-cycles, is approximated using a simple arithmetic mean temperature difference model,
& Q air = hA air ,e * AMTD
(3.6)
17
where hAair,e [kW/K] is product of the air side heat transfer coefficient and evaporator surface area averaged over entire evaporator surface and AMTD = [(Tair,in + Tair,out)/2 – Tm] is arithmetic mean temperature difference, which is solved simultaneously at each time step with the air side energy balance using equation (3.7).
& & Q air = ρ air * Vair * c p * ( Tair ,in − Tair ,out )
(3.7)
Equations 3.8 and 3.9 describe the refrigerant side heat transfer rate from the evaporator metal to the refrigerant during the off and on-cycles, respectively.
u ref ,off − u ref ,init,off & & Q ref , off = m ref * t off
(3.8)
& Q e,a v g & Q = ref ,on µ
(3.9)
where
& & & Q e,a v g = Q ref ,on * µ + Q ref ,off * (1 − µ )
(3.10)
is the evaporator heat transfer rate averaged over the entire cycle period, and mref and u ref,init,off are the refrigerant mass and internal energy in the evaporator at the end of the on-cycle. It is clear from the experimental data (e.g. Figure 3.12) that the off-cycle heat transfer rate between the tube and refrigerant is almost negligible, reaching only ~15% of on-cycle heat transfer rate in the worst case (µ=0.7, τ=10 sec). Therefore we assume that all refrigerant side heat transfer occurs during the on-cycle at a constant rate equal to the
& Q e,avg /µ, as indicated by the nearly
constant on-cycle temperature difference, T m - Tsat,e. Note that the slight on-cycle temperature difference increase is offset by a slight decrease in refrigerant mass flow rate through the compressor as suction pressure declines. In addition, data also show that the off-cycle refrigerant internal energy term mref*∆u/t off varies between 3.5 to 4.5 % of the metal thermal capacitance term depending on µ, suggesting the dominance of hAair,e/Cm term in equation 3.11. The model governing equations are therefore written for off and on-cycle respectively:
hA air * (Tair ,a v g − Tm ) (u ref ,off − u ref ,init,off ) dTm = + m ref * / Cm dt Cm t off
dTm = dt
hA air * ( Tair ,a v g − Tm ) −
(3.11)
& Q e, a v g µ
(3.12)
Cm
3.4.1 Model validation using the experimental measurements The validity of the model will be checked by comparing it with the experimentally obtained evaporator metal temperature during the on and off-cycle. The average hAair,e for entire evaporator was determined from dry coil steady state (µ=1 at 80/95o F) data to be 0.94 kW/K. The average hAair.e was determined from experimental data by integrating the term
18
& /AMTD Q air
& was obtained from the air side energy balance. Since air flow rate Q air
over entire cycle period at a given µ, where
varied for µ