Computer Science Division. Dept. of Electrical Engineering .... basic block entry; trace records for all instruction fetches are then constructed from the basic block ...
--
--
Cache Performance of the SPEC92 Benchmark Suite
Jeffrey D. Gee Sun Microsystems Inc. Mark D. Hill Dionisios N. Pnevmatikatos Computer Sciences Department University of Wisconsin-Madison Madison, WI 53706 Alan Jay Smith Computer Science Division Dept. of Electrical Engineering and Computer Sciences University of California Berkeley Berkeley, CA 94720
This paper will appear in IEEE Micro
--
--
-2Abstract The SPEC92 benchmark suite consists of twenty public-domain, non-trivial programs that are widely used to measure the performance of computer systems, particularly those in the Unix workstation market. These benchmarks were expressly chosen to represent real-world applications and were intended to be large enough to stress the computational and memory system resources of current-generation machines. The extent to which the SPECmarks (the figures of merit obtained from running the SPEC benchmarks under certain specified conditions) accurately represents performance with live real workloads is not well established; in particular, there is some question whether the memory referencing behavior (cache performance) is appropriate. In this paper, we present measurements of miss ratios for the entire set of SPEC92 benchmarks for a variety of CPU cache configurations; this study extends earlier work that measured only the performance of the integer SPEC89 benchmarks. We find that instruction cache miss ratios are generally very low, and that data cache miss ratios for the integer benchmarks are also quite low. Data cache miss ratios for the floating point benchmarks are more in line with published measurements for real (i.e. non-benchmark, non-synthetic) workloads. We believe that the discrepancy between the SPEC benchmark miss ratios and those observed elsewhere is partially due to the fact that the SPEC benchmarks are all almost exclusively user state CPU benchmarks run until completion as the single active user process. We therefore believe that SPECmark performance levels may not reflect system performance when there is multiprogramming, time sharing and/or significant operating systems activity.
KEYWORDS: Cache performance, Memory system design, Multiprogramming, Program behavior, SPEC benchmarks, Trace-driven simulation
--
--
-31. Introduction The 1992 SPEC benchmarks [SPEC91] are a selection of non-trivial programs chosen to standardize benchmarking. SPEC (System Performance Evaluation Consortium) assembled this suite to provide a standard set of realistic benchmarks for intersystem comparisons; see [Pric89, Hinn88] for a discussion of the many problems with the benchmarking situation prior to SPEC. Several factors, including strong industrial support for SPEC, the realistic nature of the benchmarks, and acceptable code portability have led to the wide use of these programs for benchmarking purposes. To improve the verification and reproducibility of results, SPEC benchmark results must include a description of any source code modifications, compiler and operating system release numbers, machine characteristics, and most other factors that can affect the reported results. The SPEC benchmarks have become so important as a measure of CPU performance that some system developers are parameterizing their designs to maximize SPEC benchmark performance, even when this might lead to lower performance on other, perhaps more realistic, workloads. Similarly, compiler writers have been concentrating on producing good code for the frequently executed inner loops of some of the SPEC benchmarks. Recent very high benchmark results for the SPEC89 program matrix300 demonstrated the success of their efforts and forced the SPEC consortium not to include matrix300 in the SPEC92 benchmark release. � ������������������������������������������������������������������ � �� ��������������������� ����������������������� ������SPEC ����������Benchmark ����������������������Suite ����������������������������������������������������� � � Program � Language � � �� ��������������������������������������������������������������������������������Description ����������������������������������������������������� � � � Robotics neural network training C � alvinn � � � Adaptive Lempel-Ziv compression C � compress � � � Fortran Thermohydraulic simulation of a nuclear reactor � doduc � � � � ear � C Human ear simulation � � � eqntott � C � � Builds truth table from a boolean expression � espresso � � � Boolean function minimization C � � � Fortran � Two electron integral derivative � fpppp � � GNU C compiler compiling pre-processed source files � C � gcc � � � � hydro2d � Fortran � Galactical jet computation � � mdljdp2 � Fortran � Molecular dynamics (double precision) � � mdljsp2 � Fortran � Molecular dynamics (singe precision) � � nasa7 � � Fortran � Seven floating-point synthetic kernels � � � Fortran � Ray tracing � ora � � � Spreadsheet calculator C � sc � � � Fortran Analog circuit simulator � spice � � � � su2cor � Fortran Quantum physics mass computation � � � swm256 � Fortran � Shallow water equation solver � � tomcatv � Fortran � Mesh generation program � � � � Fortran � Maxwell’s equation solver wave5 � � � � � ��xlisp ����������������������������C ����������������Lisp ��������interpreter ������������������solving ������������the ������nine ��������queens ������������problem ����������������������� Table 1: SPEC Benchmark Applications
--
--
-4The SPEC92 benchmark suite consists of six integer-intensive C programs (compress, eqntott, espresso, gcc, sc, and xlisp) and fourteen floating-point intensive programs (alvinn, doduc, ear, fpppp, hydro2d, mdljdp2, mdljsp2, nasa7, ora, spice, su2cor, swm256, tomcatv, and wave5). The SPEC benchmarking procedure is to run each program to completion on the target system, with only one user process active, and then take the ratio of that run time to the run time of the same program on a DEC VAX 11/780, as measured originally at the start of the SPEC effort. The geometric mean of those ratios over the integer and floating point intensive programs, yields the "SPECint92" and "SPECfp92" respectively, which are the figures of merit. Table 1 lists and gives a short description of each benchmark. As noted above, considerable effort is being expended on creating computer systems (hardware and software) to optimize SPEC benchmark results. Two questions therefore arise: (a) In what ways should the system be designed to perform well on the SPEC benchmark suite? (b) Is this a good idea? One important aspect of CPU performance, and probably the most important of the architectural aspects (as opposed to technology parameters, such as circuit speed) is the performance of the memory hierarchy. We note that SPEC benchmark results are quite sensitive to cache size, as may be seen by comparing the various published measurements of systems, with varying caches sizes, based on the Motorola 88000. (reference?) In terms of the SPEC benchmarks, the two questions above become: (a) What miss ratios can be expected when running the SPEC benchmarks on a machine with a cache of a given design? (b) Are these miss ratios comparable to those for ‘‘typical’’ user workloads, for some definition of typical? In this paper we present measurements of the cache miss ratios of the entire SPEC92 benchmark suite and comment on their potential use in the design of caches and memory hierarchies. We compare the SPEC cache miss ratios to design target miss ratios [Smit87], miss ratios measured using hardware monitors at Amdahl [Smit82] and on DEC VAX-series machines [Clar83,88], miss ratios observed from very long address traces [Borg90], and other miss ratios that include operating system and multiprogramming behavior. We note that miss ratios for multiprogrammed workloads with significant operating system activity are known to be high [Agar88,Ande91]. We find that the miss ratios for the SPEC benchmarks are generally lower than should be expected from multiprogrammed workloads.
--
--
-52. SPEC Cache Performance 2.1. Methodology We compiled and ran the SPEC programs on DECstation which contain the MIPS R2000 and R3000 microprocessor, running version 4.1 of the DEC Ultrix operating system. We used version 2.0 of the C compiler and version 2.1 of the Fortran compiler with optimization level according to the SPEC Makefiles. We then used the MIPS pixie [DEC91] tool to generate address traces to feed directly to the tycho [Hill] cache simulator. Pixie modifies the compiled code to generate a trace record for each load, store and basic block entry; trace records for all instruction fetches are then constructed from the basic block records. Tycho uses algorithms that, for a given block size, simulate all cache sizes and associativities in a single pass through an address trace [Hill87]. Note that since our traces are derived from the MIPS architecture, different results will be obtained for other CPUs and other compilers. We varied cache size from 1 Kbyte to 1 Mbyte, set size from one (direct-mapped) to eight, and block size from 16 to 256 bytes. All caches used the LRU replacement algorithm and the lowest order available address bits to select the set. We simulated instruction, data, and unified caches, without any periodic cache flushing, as the SPEC benchmarks are typically run in a uniprogrammed environment. Miss ratios represent the complete execution of a benchmark and include start-up as well as steady-state effects. The use of pixie to generate address traces allows simulation of only user, and not system references, and our data is for user code only. Table 2 shows the user and system times for an execution of each of the benchmarks when run on a DECstation 5000/240 MIPS processor based workstation. The system time accounts for 1.5% of the total run time for the benchmark suite, and the linear average of the percentage of system time for each benchmark is 2.5%. The fraction of system time is sufficiently low that we believe that user state only measurements of cache miss ratios are a very accurate approximation of the miss ratios when including both user and system state memory accesses. Table 2 also lists the number of instruction, data, and total user memory references made by each program. The SPEC92 release specifies that compress is run twenty times with the same input and gcc is run four times with the same input. The number of references reported here corresponds to one of these runs. Note that the trace reflects a 4-byte memory interface; the trace would be different for a different memory interface width. Note also that the trace includes only actual program loads, stores and instruction fetches; it does not include the extra memory activity such as instruction prefetch that would occur on most machines [Clar83]. For analysis of some of the benchmark programs and their execution behavior, see [Saav92a,b]. To increase our confidence in our results we compared them with two other studies that ran the SPEC benchmarks on a MIPS R2000 microprocessor. Pnevmatikatos and Hill [Pnev90] presented cache miss ratios for the four integer SPEC89 benchmarks (eqntott, espresso, gcc and xlisp). They used a different compiler (gcc) and a tracing methodology that excludes library references. Nevertheless, most miss ratio differences are less than 0.01. In few cases, however, a seemingly small miss ratio difference translates into a substantial relative change. We are inclined to place the most confidence in the results presented here, since this analysis has used much more mature and sophisticated compilers, but the comparison demonstrates that cache miss ratios, instruction
--
--
-6�������������������������������������������������������������������������������������������������������������������������������� ������������������������� �������������������
� � Program � UserTime � SysTime Instruction Data Total �� � � � � � � � � � � � � � � � � � � � � � � � � � � � � � � � � � � � � � � � � � � � � �� � � � � � � � � � � � � � � � � �� � � � � � � � � � � � �� � � � � � � � � � 87,493,425 23,079,252 � 110,572,677 � 5.5 0.6 � Compress �
� Eqntott 1,241,913,236 215,772,134 1,457,685,370 41.1 0.5 � � �
� � Espresso � � 2,899,136,916 642,332,818 3,541,469,734 81.3 0.7
� � Gcc � � 1,262,492,069 398,952,157 1,661,444,226 55.8 5.1
� � � � 3,872,103,933 1,180,851,591 � 5,052,955,524 � 129.5 18.0 � Sc �
2,313,405,716 � 6,257,593,610 8,570,999,326 205.6 � � �Xlisp � �
� � � � � � � � � � � � � � � � � � � � � � � � � � � � � � � � � � � � � � � � � � � �� � � � � � � � � � � � � � � � � �� � � � � � � � � � � � �� � � � � �10.6
� � � �
� Alvinn 6,563,724,007 1,881,599,643 8,445,323,650 250.5 3.1
� � � �
� Doduc 1,619,374,300 583,667,566 2,203,041,866 75.4 0.7 � � � 16,808,813,786 3,973,854,638 � 20,782,668,424 � � Ear � 562.8 5.1
� � Fpppp � � 7,420,830,444 4,511,281,096 11,932,111,540 443.9 3.1
� � � � 8,398,925,572 3,227,708,646 � 11,626,634,218 � 515.6 4.7 � Hydro2d � 4,767,422,316 2,063,639,524 � 6,831,061,840 � 202.0 0.8 � Mdljdp2 �
� � Mdljsp2 � � 3,980,213,579 5,080,511,093 159.7 0.6
1,100,297,514 � � Nasa7 � � 9,195,719,149 4,720,515,938 13,916,235,087 805.7 14.1
� � � � 6,461,088,985 1,606,039,952 � 8,067,128,937 � 302.2 1.2 � Ora � 28,696,843,509 8,288,246,353 � 36,985,089,862 � 1496.2 21.2 � Spice �
2,579,035,906 � � Su2cor � 5,932,445,133 8,511,481,039 � 387.2 2.0 � � Swm256 � � 11,551,490,879 3,716,782,216 15,268,273,095 662.3 3.5
� � � �
� 1,872,460,468 913,221,318 2,785,681,786 � 132.3 3.5 � Tomcatv �
1,224,717,917 � �����Wave5 � � 3,704,008,705 4,928,726,622 165.4 1.2 � �������������������� ���������������������������������� ����������������������������������� ����������������������������������� ������������������������� ������������������� �����Total �������������������� ����132,594,094,021 ������������������������������ ����45,165,001,895 ������������������������������� ����177,759,095,916 ������������������������������� ������6680.0 ������������������� ��������100.3 ����������� � Arithmetic mean � � ��� ����������������������������������������������������������������������������������������������������������������������������� ��������334.0 ����������������� ������������5.0 ������� Geometric mean 191.5 2.5 ������������������������������������������������������������������������������������������������������������������������������������������������������������������������� Table 2: Program Reference Counts and Execution Time in seconds counts, and related measures are, as might be expected, sensitive to the compiler used. We must thus caution readers that your actual mileage may vary. Cmelik et al. [Cmel91] give instruction counts for the SPEC89 benchmarks. With one exception, Spice, their counts are close to ours. We cannot explain the difference for Spice, although simulation runs at both Berkeley and Madison yielded consistent results. Simulating these caches required 200 to 400 microseconds of CPU time per memory reference in each trace. Assuming an average 300 microseconds per memory reference, simulating all twenty SPEC benchmarks requires some 980 days or nearly 40 months of CPU time. Including false starts, simulation errors, and operating system bugs, we used three to four years of machine time to compute our results; this type of measurement would not have been possible if it had been necessary to pay for CPU time on a timeshared machine. (Workstations aren’t free, but they are a lot cheaper than the same number of cycles on a timeshared machine.) With seven machines available for running simulations at Berkeley and Madison, we were able to generate these results in less than seven months of calendar time.
�
�
�
�
�
�
�
�
�
�
�
�
�
�
�
�
�
�
�
�
�
�
�
�
�
�
�
�
�
�
�
�
--
--
-72.2. Results In our simulations we varied the block (line) size from 16 to 256 bytes, the cache size from 4Kbytes to 1 Mbyte, and the set-associativity from 1 (direct mapping) to 8. for instruction, data and unified caches. The complete set of results is not included for brevity reasons, but an electronic copy is available via anonymous ftp‡. In this section, we comment on some of that data; in section 3, we present and discuss the averages over the benchmark programs. We first examine instruction cache miss ratios for the different programs. For alvinn, compress, ear, eqntott, hyrdo2d, mdljdp2, mdljsp2, nasa7, ora, swm256, and tomcatv, instruction cache miss ratios are very low, generally less than 0.0001 for caches as small as a few kilobytes. These programs spend much of their execution time in a few small routines; the SPEC89 program matrix300, for example, spends about 99% of its execution time in one small basic block in the code [Saav90,Saav92a,b]. Miss ratios for sc, espresso, su2cor, xlisp, spice and wave are only slightly larger, as miss ratios again fall below 0.0001 for cache sizes as small as 16 or 32 Kbytes. Instruction cache miss ratios are largest for doduc, gcc, and fpppp, yet are well below half a percent for caches as small as 64 or 128 Kbytes. None of the SPEC benchmarks makes significant use of more than 128 Kbytes of instruction cache. Miss ratios for data caches are larger, especially for several of the floating-point Fortran benchmarks, but for the most part are quite low as cache size approaches one megabyte. Miss ratios for ora, fpppp, xlisp and doduc are the lowest among the SPEC suite, dropping below one percent for caches as small as 16 or 32 Kbytes, and falling below 0.0001 for a 64 Kbyte cache. Results for ear, mdljdp2, and espresso are also low, especially when the set size is greater than one, and for somewhat larger for directmapped caches. Among the integer programs, compress, eqntott and gcc exercise fairly large data caches; miss ratios remain above one percent until cache size reaches 512 Kbytes. The floating-point programs nasa7, spice, su2cor, swm256, tomcatv, and wave5 exhibit the largest data cache miss ratios. Miss ratios for su2cor, nasa7, spice, and wave5 are several percent until the cache size reaches one megabyte, causing miss rates to fall below one percent. Swm256 and tomcatv require extremely large caches when the cache block size is small. Data cache miss ratios are over 12 percent and 6 percent respectively for a 1 Mbyte cache at a 16-byte block size. Each successive doubling of block size at 1Mbyte reduces data cache miss ratios by almost half, and miss ratios do become less than one percent for a 128 byte block for tomcatv and a 256 byte block for � ��������������������������� ‡
A machine readable copy of the complete set of tables can be available via anonymous ftp from reggiano.cs.wisc.edu: ftp reggiano.cs.wisc.edu (or: ftp 128.105.8.27 ) reply to login: anonymous reply to passwd: type any non-null string here cd SPEC92 get README get fullmissratios.ascii get fullmissratios.postscript.Z bye
--
--
-8swm256. Unified (data and instruction) cache miss ratios usually fall between instruction and data cache miss ratios, as the strong locality in instruction references offsets the weaker locality in data references. We do observe several instances where unified cache miss rates are higher than corresponding data cache miss rates (doduc, fpppp, ora, xlisp). This behavior occurs mainly at larger cache sizes coupled with low associativities, and where separate instruction and data cache miss ratios have fallen to nearly zero. The low associativity causes instruction and data references to conflict for cache sets, while such conflicts do not occur in separate instruction and data caches. Note that a split directmapped instruction/data cache pair is more like a 2-way set-associative unified cache than a direct-mapped unified cache. It is worth noting that there are a few anomalies in the data with respect to the effect of associativity on miss ratio. Generally, miss ratios decrease with increased degrees of set associativity, since the probability of mapping conflicts decreases [Hill89]. It is possible, however, that miss ratios can increase with increasing associativity if certain reference patterns are present in the memory reference string; we note just that effect at one or more data points for the fpppp, spice, tomcatv, and doduc miss ratios. 3. Evaluation In this section we compare the SPEC miss ratios with miss ratios from previous studies and discuss whether the SPEC applications make suitable cache benchmarks. We first describe the other studies. (a) Smith [Smit82] includes several measurements taken with a hardware monitor at Amdahl Corporation on various models of the Amdahl 470V machines, running a standard internal benchmark containing supervisor, commercial and scientific code. Results showed that supervisor state miss ratios were much higher than problem state miss ratios, and that the miss ratio for each of user and supervisor state could be approximated by equations of the form m = a * k b , where a and b are constants and k is the cache size in kilobytes. (b) Two studies [Clar83,88] provide cache miss ratios taken via hardware measurement from VAX 11/780 and VAX 8800 computers. The 11/780 has an 8 Kbyte, writethrough unified cache with an 8-byte block size and a set size of two. The 8800 has a 64 Kbyte, write-through, direct-mapped unified cache with a 64-byte block size. In both cases, these were timeshared workloads, measured at DEC in an engineering environment. (c) Smith [Smit85] introduced the design target miss ratios (dtmrs) to represent typical levels of performance, averaged over a wide class of workloads, ranging from workstations to timeshared mainframes. (In practice, miss ratios for workstations would probably be lower, and for large timeshared mainframes would probably be higher.) He synthesized them from real (hardware monitor) measurements that existed in the literature and a large number of trace-driven simulation results. The initial dtmrs for 16-byte line size, fully-associative caches [Smit85] were later extended to other line sizes [Smit87] and to set-associative caches [Hill87,89].
--
--
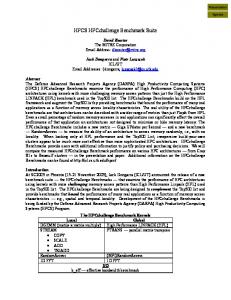
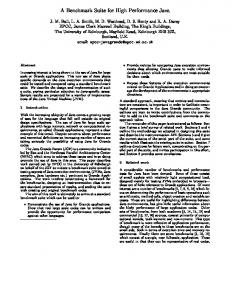
-9(d) Agarwal, et al. [Agar88] presented miss ratios that include the effects of operating system references and multiprogramming by using microcode to capture address traces from multi-tasked machines. These effects can more than double miss rates from those measured in a uniprogrammed, user-only environment. They used a varied set of 20 applications programs. (e) Borg, et al. [Borg90] generated miss ratios for very long address traces using tools similar to our own; those traces were over twelve billion memory references long. The traces were used to evaluate the performance of a variety of caches. They used three individual traces and another which was a multiprogramming workload consisting of several jobs. It is important to note that although some of these studies are rather old, we have been unable to find newer or better data. There are many other studies using traces, but we believe that those other workloads are no more representative. With regard to the discussions below, we believe that were any of the above real measurements to be repeated today, the programs and memories would be larger, and the miss ratios (for a given size cache) would be higher. Figures 1 through 3 show average SPEC miss ratios for instruction, data, and unified caches, with 32-byte lines and 2-way set-associativity, computed separately for the integer and floating-point benchmarks. We also list in Tables 3 through 5 average miss ratios for the integer, floating-point, and complete SPEC92 suite across the entire range of simulation parameters. These averages represent the unweighted arithmetic mean of individual program miss ratios†. The unweighted arithmetic mean of the program miss ratios gives the miss ratio of a workload where each program runs for the same number of references. In Figures 1 and 2, average miss rates are plotted against the design target miss ratios (labeled dtmr) and primary cache miss ratios from [Borg90] for a multiprogrammed workload (labeled borg). Unfortunately, miss ratios from the other studies are not available for separate instruction and data caches, but are plotted against SPEC unified cache results in Figure 3. Previous results based on different block sizes (VAX 11/780, VAX 8800, Agarwal, et al.) or different associativities (VAX 8800, Borg et al.) have been adjusted for these parameters using ratios of miss ratios from prior studies [Hill89, Smit87]. A look at Figure 1 suggests that instruction cache miss ratios for the SPEC benchmarks are unusually low, as they are as low as one-fourth of the design target miss ratios and one-half of Borg’s miss ratios. In Figure 2, we see that data cache miss ratios for the SPEC integer and floating point benchmarks bracket the dtmrs for small cache sizes and are close for the larger sizes for which the dtmrs are defined; all of them are above the [Borg90] measurements. Both sets of SPEC benchmarks approach zero miss ratio for moderately large caches; we would not expect the miss ratios in a timeshared system to approach zero until the cache were as large as main memory because of misses due to task switching (i.e. cold start). � ��������������������������� n † The average miss ratio is calculated using the formula ��1 � ��M ��� i where n is the total number of n iΣ =1 Ri programs, Mi is the number of misses for program i and Ri is the number of references for program i.
--
--
- 10 -
Instruction Caches
0.100
Block Size: 32 bytes Associativity: 2-way M i s s R a t i o
0.075 dtmr
0.050 borg
0.025
SPEC.fp SPEC.int
0.000 1
10
100
1000
Cache Size (kbytes) Figure 1: Instruction cache miss ratios Were the cache the same size as main memory, ‘‘misses’’ would appear as I/O activity, but would still occur. Figure 3 contains unified cache measurements from the various other studies in addition to SPEC and design target miss ratios. These include: Amdahl 470 supervisor and user state miss ratios (plots labeled 470.sup and 470.user), VAX 11/780 and VAX 8800 miss ratios (plots labeled VAX.780 and VAX.8800), and miss ratios from [Agar88] for a multiprogramming level of 3 (plots labeled agarwal.mul3). (We plot the Amdahl data from the fitted curve in [Smit82]; the original data points are not available.) We note that the VAX8800 data was collected from a very heavily used timeshared system. The Amdahl 470 supervisor data was collected from the execution of a standard internal Amdahl commercial workload. For both the VAX8800 and Amdahl data, the level of supervisor activity was quite high. Following in decreasing order of miss ratio are the dtmrs and Agarwal’s multiprogrammed miss ratios. SPEC floating point, VAX 11/780 and Amdahl 470 user state miss ratios follow, and the SPEC integer miss rates are smallest by a wide margin. All of the data in the literature (see e.g. [Smit82], [Ande91], [Agar88]) suggests that operating systems activity significantly increases miss ratios. First, operating
--
--
- 11 -
Data Caches
0.25
Block Size: 32 bytes Associativity: 2-way 0.20 M i s s R a t i o
0.15 dtmr
SPEC.fp
0.10
0.05 borg SPEC.int
0.00 1
10
100
1000
Cache Size (kbytes) Figure 2: Data cache miss ratios systems code tends to loop less than user code, and so instruction miss ratios are high. Second, operating systems routines are usually called into the cache by an exception, interrupt or trap, then run for a short time, and finally are replaced from the cache before they run again; they effectively always face a "cold start" situation. Sanguinetti observes [Sang84] that for the Amdahl 580, routines must execute over 600 times per second to stay cache resident. Third, operating system activity is associated with timesharing and high levels of multiprogramming; frequent task switching means that programs are constantly experiencing cold start. As illustrated by Figure 3, miss ratios for the SPEC benchmarks are considerably below those for any workload with significant OS activity, and as noted earlier and as shown in Table 2, the SPEC benchmarks actually contain very little operating system activity. Similar differences in cache performance between compute bound and multiprogrammed environments are reported in [Mogu91]. The SPEC floating-point benchmark miss ratios are quite close to the dtmrs, the data from [Agar88], and the VAX 11/780 measurements, and for large cache sizes are also very close to the Amdahl 470 user program miss ratios. The SPEC integer benchmark miss ratios are the lowest.
--
--
- 12 -
Unified Caches
0.100
Block Size: 32 bytes Associativity: 2-way M i s s R a t i o
0.075
470.sup
VAX.8800
0.050 dtmr VAX.780 0.025
agarwal.mul3
470.user
SPEC.fp SPEC.int 0.000 1
10
100
Cache Size (kbytes) Figure 3: Unified cache miss ratios
1000
0.0166 0.0109 0.0076 0.0054 0.0037 0.0016 0.0001 0 0.0164 0.0109 0.0074 0.0053 0.0037 0.0016 0.0002 0.0001 0.0177 0.0119 0.0081 0.0059 0.0041 0.0020 0.0002 0.0001 0.0205 0.0132 0.0090 0.0064 0.0045 0.0021 0.0003 0.0002
xx
xx x
0.0266 0.0163 0.0113 0.0078 0.0056 0.0026 0.0006 0.0005 8K 16K 32K 64K 128K 256K 512K 1M
xx
xx
0.0297 0.0177 0.0114 0.0080 0.0056 0.0038 0.0016 0.0002 0
y y y y y y y y y y y y y x a a a a a a a a a a a a a `` `` `` ` a a a a a a a a a a a a a ``` 0.0291 0.0175 0.0113 0.0078 0.0055 0.0037 0.0017 0.0002 0.0001
``
`` `
0.0302 0.0189 0.0124 0.0086 0.0061 0.0042 0.0020 0.0003 0.0001
a a a a a a a a a a a a a ```` `` `` ` a a a a a a a a a a a a a ``` 0.0343 0.0217 0.0139 0.0094 0.0066 0.0045 0.0022 0.0004 0.0002
``
`` `
0.0441 0.0278 0.0173 0.0117 0.0081 0.0057 0.0027 0.0007 0.0005
a a a a a a a a a a a a a ```` `` `` ` a a a a a a a a a a a a a ``` 4K 8K 16K 32K 64K 128K 256K 512K 1M
``
``
0.0679 0.0363 0.0233 0.0151 0.0093 0.0063 0.0040 0.0017 0.0002 0.0001
a a a a a a a a a a a a a ` I I I I I I I I I I I I I HH HH HH H I I I I I I I I I I I I I HHH 0.0597 0.0355 0.0229 0.0148 0.0091 0.0061 0.0040 0.0018 0.0003 0.0001
HH
HH H
0.0561 0.0356 0.0237 0.0158 0.0099 0.0067 0.0044 0.0021 0.0004 0.0001
I I I I I I I I I I I I I HHHH HH HH H I I I I I I I I I I I I I HHH 0.0639 0.0400 0.0263 0.0173 0.0108 0.0073 0.0048 0.0023 0.0005 0.0003
HH
HH H
0.0790 0.0507 0.0331 0.0214 0.0135 0.0091 0.0060 0.0030 0.0009 0.0005
I I I I I I I I I I I I I HHHH HH HHH I I I I I I I I I I I I I HHH HH
HH
2K 4K 8K 16K 32K 64K 128K 256K 512K 1M
256 128 64 32 16
Size
256 128 64 32 16
Size
256 128 64 32 16
Size
x
y y y y y y y y y y y y y xxxx xx xx x y y y y y y y y y y y y y xxx
I I I I I I I I I I I I I H 1 1 1 1 1 1 1 1 1 1 1 1 1 00 00 00 0 1 1 1 1 1 1 1 1 1 1 1 1 1 000
128
0.1692 0.0972 0.0626 0.0401 0.0264 0.0172 0.0119 0.0079 0.0054 0.0035 0.0031 0.1310 0.0809 0.0538 0.0353 0.0235 0.0151 0.0100 0.0061 0.0035 0.0014 0.0010
0
00
00
32
0.1332 0.0829 0.0565 0.0366 0.0242 0.0163 0.0105 0.0066 0.0038 0.0017 0.0012 0.1499 0.0969 0.0684 0.0450 0.0301 0.0204 0.0132 0.0083 0.0049 0.0024 0.0017
1 1 1 1 1 1 1 1 1 1 1 1 1 0000 00 00 0 1 1 1 1 1 1 1 1 1 1 1 1 1 000
16
Size
xx
xx
y y y y y y y y y y y y y xxxx xx xx x y y y y y y y y y y y y y xxx
64
256
y y y y y y y y y y y y y xx xx xx x y y y y y y y y y y y y y xxx
0.1994 0.1145 0.0699 0.0435 0.0287 0.0186 0.0132 0.0089 0.0063 0.0043 0.0040
y ww y ww ww w y www y ww ww w y wwww y ww ww w y www y ww ww w y wwww y ww ww w y www y ww ww ywy a __ a __ __ _ a ___ a __ __ _ a ____ a __ __ _ a ___ a __ __ _ a ____ a __ __ _ a ___ a __ __ a_a I GG I GG GG G I GGG I GG GG G I GGGG I GG GG G I GGG I GG GG G I GGGG I GG GGG I GGG I GG GG IGI 1 // 1 // // / 1 /// 1 // // / 1 //// 1 // // / 1 /// 1 // // / 1 //// 1 // /// 1 /// 1 // // 1/1
0
00
00
1 1 1 1 1 1 1 1 1 1 1 1 1 0000 00 000 1 1 1 1 1 1 1 1 1 1 1 1 1 000
1K 2K 4K 8K 16K 32K 64K 128K 256K 512K 1M
Block size (bytes)
Unified Unified
Block size (bytes) Block size (bytes)
Unified Unified
0.2557 0.1674 0.1148 0.0809 0.0613 0.0395 0.0283 0.0195 0.0099 0.0016 0.0007 0.1925 0.1347 0.0975 0.0745 0.0600 0.0410 0.0303 0.0212 0.0109 0.0021 0.0009 0.1706 0.1236 0.0929 0.0736 0.0601 0.0442 0.0323 0.0226 0.0117 0.0027 0.0014 0.1705 0.1301 0.1043 0.0850 0.0710 0.0537 0.0394 0.0273 0.0145 0.0044 0.0023
y uu y vv y uu vv uu vv uu vv uu vv y uu vv uu vv uu vv uuu vvv y uu vv uu vv uu vv uu vv y uu vv uu vv uu vv uu vv y uu vv uu vv uu vv uu y y v y uu uu u yu y y a ]] a ^^ a ]] ^^ ]] ^^ ]] ^^ ]] ^^ a ]] ^^ ]] ^^ ]] ^^ ]] ^^ a ]] ^^ ]] ^^ ]] ^^ ]] ^^ a ]] ^^ ]] ^^ ]] ^^ ]] ^^ a ]] ^^ ]] ^^ ]] ^^ ]] ^^ ]] a a a ]] ]] a] a a I EE I FF I EE FF EE FF EEE FFF I EE FF EE FF EE FF EE FF I EE FF EE FF EE FF EE FF EE FF I EE FF EE FF EE FF EE FF I EE FF EE FF EE FF EE I I F I EE EE E IE I I 1 -- 1 .. 1 -- .. -- .. --- ... 1 -- .. -- .. -- .. -- .. 1 -- .. -- .. -- .. -- .. -- .. 1 -- .. -- .. -- .. -- .. 1 -- .. -- .. -- .. -- 1 1 . 1 --1- 1 1 Block size (bytes)
0.0435 0.0355 0.0300 0.0244 0.0174 0.0077 0.0006 0.0001 0.0413 0.0346 0.0292 0.0236 0.0168 0.0076 0.0009 0.0002 0.0459 0.0388 0.0328 0.0262 0.0189 0.0087 0.0008 0.0004 0.0512 0.0429 0.0358 0.0279 0.0200 0.0091 0.0012 0.0008 0.0640 0.0529 0.0442 0.0338 0.0244 0.0108 0.0022 0.0017 8K 16K 32K 64K 128K 256K 512K 1M
0.0627 0.0451 0.0363 0.0304 0.0246 0.0176 0.0078 0.0009 0.0002 0.0571 0.0424 0.0351 0.0296 0.0238 0.0169 0.0076 0.0010 0.0003 0.0565 0.0467 0.0393 0.0332 0.0264 0.0190 0.0087 0.0011 0.0005 0.0610 0.0519 0.0434 0.0363 0.0280 0.0201 0.0093 0.0014 0.0009 0.0755 0.0646 0.0536 0.0447 0.0341 0.0245 0.0113 0.0026 0.0017 4K 8K 16K 32K 64K 128K 256K 512K 1M
0.1344 0.0828 0.0599 0.0461 0.0325 0.0253 0.0179 0.0079 0.0011 0.0003 0.1113 0.0737 0.0551 0.0438 0.0313 0.0244 0.0173 0.0076 0.0011 0.0004 0.0945 0.0700 0.0566 0.0470 0.0347 0.0271 0.0194 0.0089 0.0014 0.0005 0.0922 0.0732 0.0604 0.0504 0.0376 0.0290 0.0205 0.0097 0.0018 0.0009 0.1028 0.0855 0.0721 0.0600 0.0458 0.0355 0.0250 0.0123 0.0032 0.0018 2K 4K 8K 16K 32K 64K 128K 256K 512K 1M
128 64 32 16
Size
256 128 64 128 32
Size
16
64
256
Size
16
32
64
128
256
Size
16
32
Data
Block size (bytes) Block size (bytes)
Data Data
y y y y y y y y y y y y y tt y tt tt t s s s s s s s s s s s s s ttt tt tt t r r r r r r r r r r r r r tttt tt tt t q q q q q q q q q q q q q ttt tt tt t p p p p p p p p p p p p p tttt tt tt t o o o o o o o o o o o o o ttt tt tt y y y y y y y y y y y y y ty a a a a a a a a a a a a a \\ a \\ \\ \ [ [ [ [ [ [ [ [ [ [ [ [ [ \\\ \\ \\ \ Z Z Z Z Z Z Z Z Z Z Z Z Z \\\\ \\ \\ \ Y Y Y Y Y Y Y Y Y Y Y Y Y \\\ \\ \\ \ X X X X X X X X X X X X X \\\\ \\ \\ \ W W W W W W W W W W W W W \\\ \\ \\ a a a a a a a a a a a a a \a I I I I I I I I I I I I I DD I DD DD D C C C C C C C C C C C C C DDD DD DD D B B B B B B B B B B B B B DDDD DD DD D A A A A A A A A A A A A A DDD DD DD D @ @ @ @ @ @ @ @ @ @ @ @ @ DDDD DD DDD ? ? ? ? ? ? ? ? ? ? ? ? ? DDD DD DD I I I I I I I I I I I I I DI 1 1 1 1 1 1 1 1 1 1 1 1 1 ,, 1 ,, ,, , + + + + + + + + + + + + + ,,, ,, ,, , * * * * * * * * * * * * * ,,,, ,, ,, , ) ) ) ) ) ) ) ) ) ) ) ) ) ,,, ,, ,, , ( ( ( ( ( ( ( ( ( ( ( ( ( ,,,, ,, ,,, ' ' ' ' ' ' ' ' ' ' ' ' ' ,,, ,, ,, 1 1 1 1 1 1 1 1 1 1 1 1 1 ,1
1K 2K 4K 8K 16K 32K 64K 128K 256K 512K 1M
Data
Block size (bytes)
256
y nn y nn nn n s nnn s nn nn n r nnnn r nn nn n q nnn q nn nn n p nnnn p nn nn n o nnn o nn nn yn y a VV a VV VV V [ VVV [ VV VV V Z VVVV Z VV VV V Y VVV Y VV VV V X VVVV X VV VV V W VVV W VV VV aV a I >> I >> >> > C >>> C >> >> > B >>>> B >> >> > A >>> A >> >> > @ >>>> @ >> >>> ? >>> ? >> >> I> I 1 && 1 && && & + &&& + && && & * &&&& * && && & ) &&& ) && && & ( &&&& ( && &&& ' &&& ' && && 1& 1
0.2942 0.1892 0.1280 0.0877 0.0650 0.0416 0.0295 0.0202 0.0103 0.0017 0.0006
y ll y mm y ll mm ll mm ll mm ll mm s ll mm ll mm ll mm lll mmm r ll mm ll mm ll mm ll mm q ll mm ll mm ll mm ll mm p ll mm ll mm ll mm ll o o m o ll ll l yl y y a TT a UU a TT UU TT UU TT UU TT UU [ TT UU TT UU TT UU TT UU Z TT UU TT UU TT UU TT UU Y TT UU TT UU TT UU TT UU X TT UU TT UU TT UU TT UU TT W W W TT TT aT a a I