The IPACS-Project at Glance – IPACS Benchmark Suite, Performance Modeling and Prediction Methods, Benchmarking Environment – Giovanni Falcone∗ Matthias Merz¶
Heinz Kredel†
Michael Krietemeyer‡
Franz-Josef Pfreundtk
Christian Simmendinger∗∗
Dirk Merten§ Daniel Versick††
September 28, 2005
Abstract The IPACS-Project (Integrated Performance Analysis of Computer Systems), which was founded by the German Federal Department of Education, Science, Research and Technology (BMBF), wants to define a new basis for measuring system performance of distributed systems. Its objective is to develop methods for measuring system performance on High Performance Computers (HPC) based on low level benchmarks, compute kernels, open source- and commercial application benchmarks. Additionally, it covers the development of methods for performance modelling and prediction of commercial codes. A further significant element is the integration into a benchmark environment consisting of a web based repository and a distributed benchmark-execution framework that ensures an easy usability and enables a just-intime analysis of benchmark results. This paper is an expanded and updated version of the article ”Integrated Performance Analysis of Computer Systems (IPACS) – Benchmarks for Distributed Computer Systems” published at PIK 3/05 (Praxis der Informationsverarbeitung und Kommunikation) in 2005.
∗
[email protected] †
[email protected] ‡
[email protected] §
[email protected] ¶
[email protected] k
[email protected] ∗∗
[email protected] ††
[email protected]
i
Contents 1
Introduction 1.1 Context and Motivation . . . . . . . . . . . . . . . . . . . . . . . . . . . . . . . . . . . . . . . . . . . . 1.2 Related Work . . . . . . . . . . . . . . . . . . . . . . . . . . . . . . . . . . . . . . . . . . . . . . . . . 1.3 Outline of the Paper . . . . . . . . . . . . . . . . . . . . . . . . . . . . . . . . . . . . . . . . . . . . . .
1 1 1 2
2
IPACS Benchmark Suite 2.1 Low-Level Benchmarks . . . . . . . . . . . . 2.1.1 PRIO MARK - Parallel I/O Benchmark 2.1.2 C ACHE B ENCH , PMB and b eff . . . 2.2 Compute Kernels . . . . . . . . . . . . . . . 2.2.1 TAU F LOW S OLVER . . . . . . . . . 2.2.2 TAU B ENCH . . . . . . . . . . . . . . 2.3 Application Benchmarks . . . . . . . . . . . 2.4 Commercial Software Packages . . . . . . .
. . . . . . . .
2 2 3 4 4 4 5 5 6
3
Performance Modeling and Prediction Methods 3.1 Serial Performance . . . . . . . . . . . . . . . . . . . . . . . . . . . . . . . . . . . . . . . . . . . . . . 3.2 Parallel Performance . . . . . . . . . . . . . . . . . . . . . . . . . . . . . . . . . . . . . . . . . . . . .
7 7 8
4
The Benchmarking Environment 4.1 The Process of Benchmarking High Performance Computers 4.2 Benchmark Execution Framework . . . . . . . . . . . . . . 4.3 Benchmark Repository . . . . . . . . . . . . . . . . . . . . 4.4 Information Retrieval Component . . . . . . . . . . . . . .
5
. . . . . . . .
. . . . . . . .
. . . . . . . .
Conclusion
. . . . . . . .
. . . . . . . .
. . . . . . . .
. . . . . . . .
. . . . . . . .
. . . . . . . .
. . . .
. . . . . . . .
. . . .
. . . . . . . .
. . . .
. . . . . . . .
. . . .
. . . . . . . .
. . . .
. . . . . . . .
. . . .
. . . . . . . .
. . . .
. . . . . . . .
. . . .
. . . . . . . .
. . . .
. . . . . . . .
. . . .
. . . . . . . .
. . . .
. . . . . . . .
. . . .
. . . . . . . .
. . . .
. . . . . . . .
. . . .
. . . . . . . .
. . . .
. . . . . . . .
. . . .
. . . . . . . .
. . . .
. . . . . . . .
. . . .
. . . . . . . .
. . . .
. . . . . . . .
. . . .
. . . . . . . .
. . . .
. . . . . . . .
. . . .
. . . . . . . .
. . . .
. . . .
9 9 10 11 12 14
ii
1
Introduction
With the continuing relevance of PC-clusters, SMP-clusters and the development of chip architectures into memory hierarchies and internal parallel processing, computer architectures have become more and more complex. Parallelism and the growing capacity of memory and storage has led to an increase of the growth of today’s problems. But reliable and easy to use benchmarks, which moreover support the users in rating and evaluating parallel computer systems and help in the procurement of new computers are still missing.
1.1
Context and Motivation
In this section we will give some background information on performance analysis of computer systems before we turn to related efforts in developments of integrated benchmarking environments. Among the vast number of benchmark programs the TOP500 [TOP05] list, based on the L INPACK benchmark [Net05a], is the most public visible benchmark in the world. Its success comes first from the open availability of the source and supporting code together with the community validation of the results, second from the scalability of the L INPACK benchmark over all computer architectures within the last 25 years and third from the interest of computer manufacturers to publish the best L INPACK numbers for their systems as a competitive comparison. L INPACK numbers are for customers a prime corrective to the peek advertised performance (PAP) of computer systems, since a real benchmark program must be executed on a existing computer in order to obtain the performance numbers. Many other benchmark initiatives fail short on some of these three aspects: • the benchmarks are only meaningful for certain architectures, hardware features or certain system sizes (e.g. NAS PB [BBB+ 91, NAS05] use only fixed problem sizes), • to obtain and publish the benchmark one must be a member of an organization (and sometimes pay high membership fees) and follow certain procedures (e.g. SPEC [Sta05]), TPC [Tra04]) • or there is only an academic interest in the results of a benchmark (see the N ETLIB link collection [Net05a] with many dead projects). However, the success of the L INPACK benchmark is also due to a limitation, it assesses the suitability of a computer system only by computing a solution to a dense and arbitrarily big system of linear equations. But many of today’s applications incorporate new algorithms with different system stress patterns or algorithms based on new mathematical theories. Applications, which are not numerical and yet using parallel systems, are still not covered. With the growing relevance of computing grids the situation will even become more aggravated in a few years. On the practical side it is relatively easy to run the L INPACK with reasonable results by a benchmark professional but for most new or young benchmarkers it is very hard to tune and optimize the L INPACK software configuration to achieve good results. The IPACS-Project [IPA05] wants to improve this situation by augmenting L INPACK with a set of low level and application benchmarks and in easing the execution of these benchmarks. In cooperation with colleagues at LBNL/NERSC, IPACS wants to define a new basis for benchmarks measuring system performance of distributed systems. These benchmarks should allow for a realistic evaluation of performance, leading even to the prediction of performance, and are especially designed to be scalable and portable to facilitate their wide range and future use. The evaluation and selection or the development of augmenting benchmarks is part of other IPACS publications [PM04, IPA05] and some extend in section 2. The usability of these benchmarks is further improved by providing a benchmark execution environment with online evaluation of benchmarking results to assist the inexperienced user.
1.2
Related Work
Other benchmarking activities do not aim at such an highly automated benchmarking process cycle. There is one project ’Repository in a Box’ (RIB, [Inn05]) which is a software package for creating web metadata repositories which can contain metadata for benchmark suites for various application domains. This tool helps finding benchmarks or other software in a specific application domain that does not contain the benchmark code or benchmark results. The P ERFORMANCE DATABASE S ERVER ([Net05b]) is a web-server which contains results of various benchmarks from Dhrystone to Linpack. The results from Linpack are mostly up to date, but other tables contain merely historical data. Data input seems to be sent via email to the maintainers. The goal of the P ERFORMANCE E VALUATION R ESEARCH C ENTER ([Per05]) is a scientific
1
LLB characterize the distributed system Fluent StarCD
Develop real app´s that scale
Open Source Applications
Understand their performance
PARPACBench, DDFEM
Compute Kernels Performance Prediction
Linpack , TauBench
Low level Benchmarks (LLB) b_eff, PMB, CacheBench, PRIOmark
Verify prediction quality for commercial codes
Figure 1: The ’Benchmark pyramid’ illustrates the hierarchy of benchmarks and the utilization of the gathered information up to performance modeling.
understanding and improvement of the performance of HPC systems. Although they develop benchmarks and performance models for predictions (just as IPACS) it seems not to be intended to facilitate the benchmarking and publishing process. The HPC C HALLENGE ([HPC05]) together with the PA M AC project ([San04]) also aim at a suitable benchmark suite which can complement the Linpack/TOP500 benchmark. The proposed benchmarks are primarily based on Linpack and its software infrastructure. The suite has not defined an I/O benchmark and there are no application benchmarks. The web-site contains an archive of benchmark results and provides a web-form to be filled out and submitted together with the benchmark result file. User validation is via email response with an activating URL. So the IPACS concept of integrating a benchmark code repository, a benchmark result repository and automated process cycle contributes new ideas and experiences in benchmarking.
1.3
Outline of the Paper
The remainder of this paper is organized as follows: In section 2 the IPACS benchmark suite is introduced and developed benchmarks, namely low level, compute kernels, open source- and commercial application benchmarks are described. Section 3 covers the performance modeling and prediction method based on the results of the benchmarks. Section 4 introduces the web based repository and the distributed benchmark-execution framework with its main components: benchmark client, repository server and web-presentation. In the last section we will draw some conclusions and give some ideas for further work.
2
IPACS Benchmark Suite
The development and compilation of the IPACS benchmark suite is driven by the aim to provide a framework for measuring system performance in a realistic, expressive, universally valid way. Hence, it is not restricted to pure architectural benchmarks. But, in addition to that, the numbers measured should be related more or less directly to performance of real-world applications and throughput in production runs. Therefore, the collection of benchmarks is actually divided into four classes, which form a hierarchy depending on the complexity of the execution and the level of the measured data, as illustrated by the benchmark pyramid in figure 1. These classes range from Low-level benchmarks, which measure basic performance aspects of a specific part of the architecture, through compute kernels to benchmarks for open-source and commercial applications, where the performance of a complex software package is determined. In the selection of these benchmarks the scalability of the software has been an important criterion to ensure the applicability for future systems. With this variety the resulting suite covers a larger range of performance aspects than most other collections ([HPC05], [Sta05]) and provides the data necessary for the analysis of performance on all system levels. In the following, these classes and the benchmarks belonging to them are described in more detail.
2.1
Low-Level Benchmarks
The benchmarks in this class are intended to extract basic performance properties of the key components and devices of an architecture, i.e. the memory hierarchy, the file I/O system and the parallel network (the floating point unit, which mostly is not the bottleneck in today’s systems, is evaluated by the compute kernels more accurately). For this, a collection of
2
simple operations, basic access patterns and typical workloads are implemented and invoked in isolation. In detail, these benchmarks are PRIO MARK, C ACHE B ENCH and PMB. 2.1.1
PRIO MARK - Parallel I/O Benchmark
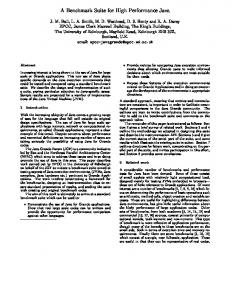
Modern computer systems use a hierarchical storage architecture called memory hierarchy, typically consisting of CPU registers as highest level followed by the 1st level cache, the 2nd level cache, the main memory, and secondary storage in form of hard disks. The performance gap between main memory and secondary storage of computer systems is the largest and increased continuously during the last years. Therefore, the analysis of secondary storage performance becomes very important and is a major element of low level benchmarks in the IPACS-Project.
bandwidth (MB/s)
60 NFS
GFS
3 # processes
4
Lustre
PVFS
50 40 30 20 10 0 1
2
5
Figure 2: The cumulative bandwidth for different file systems against the number of processes on dual Pentium III cluster with Gigabit Ethernet interconnection, as measured with PRIO MARK
Operating systems organize secondary data storage in hierarchical structures called file systems and provide a file system interface to access data. The most common file system interface is the POSIX-I/O interface, designed to support file systems on local storage devices. Unfortunately it lacks support for parallel accesses to files in distributed environments. Other interfaces like the MPI-IO interface are developed to overcome this disadvantage and to allow parallel I/O in such environments [GHLL+ 98]. File system benchmarks are applications to evaluate the performance of accesses to files in file systems. They measure the performance of read and write accesses. Since it was payed small attention to I/O benchmarks in the past there are few well known I/O benchmarks like Bonnie [Bon05], IOzone [IOz05], and b eff io [RK00]. The HPC C HALLENGE benchmark suite [HPC05] does not contain an I/O benchmark at all. Available file system benchmarks lack in support for complex workload definitions or support one file system interface only. We implemented the novel I/O benchmark PRIO MARK to solve all these issues. PRIO MARK measures POSIX-I/O as well as MPI-IO interface calls and supports complex workload definitions describing the I/O access behavior of an application. By supporting user-defined workloads the emulation of I/O activity of common applications is possible [KVT05]. Furthermore, the PRIO MARK is based on an easy extensible plugin software architecture. It allows the building of special versions, for example a non-parallel benchmark for stand-alone workstations or an only-parallel variant for clusters. PRIO MARK supports two different performance analysis methods: Concurrent accesses of many processes to one common file and accesses to individual files of the processes. Both methods use the POSIX-I/O interface for performance evaluation. Furthermore, the individual file per process benchmark can also run in stand-alone environments. The more interesting measurement method for distributed systems and parallel programming is the concurrent access to a common file. Using this access type PRIO MARK is able to measure the POSIX-I/O as well as the MPI-IO interface calls with its different variants (individual file pointer, shared file pointer, explicit offset; see [GHLL+ 98] for details). Additionally, it uses available synchronous and asynchronous file system interface calls. Synchronous calls return when the whole operation is completed and asynchronous calls return immediately while doing the operation in background. In case MPI-IO is used, even collective interface calls invoked and coordinated by a group of processes, are possible. They allow an optimization of disk accesses, for example by ordering the accesses to reduce hard disk seeks. Additionally, MPI file views can be analyzed allowing every process to see only its segments of a file. As stated above PRIO MARK supports detailed application-specific workloads. The workload used during benchmark runs is a very important issue for the interpretation of measurement results, because the results may vary in a large range. Workloads are characterized by a lot of parameters e.g. the number of processes that access data and how data is accessed.
3
PRIO MARK features the specification of many of these parameters. For example it allows the user to specify a range of file/data sizes, a range of block sizes for I/O requests, the ratio between read and write requests, and the used file system interface calls. These definition abilities allow the reproduction of access behavior of many existing programs. The whole workload configuration is stored in a single file and allows an easy rerun of the benchmark with the same settings. For supporting the user in creating workload configuration files, PRIO MARK includes workloads for main application domains (e.g. web server, workstation, on line transaction processing). The PRIO MARK produces detailed measurement output. To assist the user it displays various calculated short summaries for the described file access methods and combines these to one value. With this value it enables the user to compare different file systems, file system interfaces or workloads to find the best combination for his application. E.g. figure 2 shows some measured values for a read intensive workload to compare four different file systems: NFS (Network File System, [PJS+ 94]), GFS (Global File System, [GFS05a] [GFS05b]), Lustre 1.0.4 ([Lus05]), and PVFS 1 (Parallel Virtual File System, [CIRT00]). The shown bandwidths are accumulated by all started processes when accessing a common file. When increasing the number of concurrent processes the Lustre bandwidth increases and reaches a stable value, whereas the NFS bandwidth decreases continuously. After reaching their maximum I/O performance at two concurrently running processes, the bandwidth of PVFS and GFS decreases continuously, too. 2.1.2
C ACHE B ENCH , PMB and b eff
C ACHE B ENCH [MLT98], taken from the LLCBENCH benchmark collection (low-level Characterization Benchmarks), is a synthetic benchmark to measure the bandwidth of a (hierarchic) memory subsystem. A pre-allocated part of the memory is addressed by straight read, write and read-modify-write accesses repeatedly. Additional, partly optimized versions of theses accesses allow for an evaluation of compiler effects. PMB (Pallas MPI Benchmarks) is a comprehensive set of MPI benchmarks developed by Pallas [Pal03] that measures the bandwidth and latency of different MPI communication patterns. These patterns range from point-to-point message-passing to collective operations. In addition to that the effect of different groupings of the processors are taken into account. Derived from PMB is the effective bandwidth benchmark (b eff) which measures the accumulated bandwidth of the communication network of parallel and/or distributed computing systems. The algorithm averages over several message sizes and communication patterns to take into account that short and long messages are transferred with different bandwidth values in real applications, leading to one effective bandwidth. For a more detailed descriptions and example results of these benchmarks we refer to the cited literature.
2.2
Compute Kernels
The major aspect of the benchmarks in this class is the performance of a specific algorithm, which is isolated or derived from (a category of ) ‘representative‘ applications. One example for this is the well-known L INPACK benchmark, which performs basic Linear Algebra operations. Additional compute kernels are implemented in TAU B ENCH, a parallel pseudo benchmark. The respective kernels are derived from TAU – a Navier Stokes solver which has been developed at the German Aerospace Research DLR in Germany. The original flow solver is a three-dimensional parallel hybrid multigrid solver, which uses a finite volume scheme in order to solve the Reynolds-averaged Navier-Stokes equations. It is working with hybrid, unstructured or structured grids. The benchmark itself is meant to mimic the run-time performance of the TAU solver. The structure of TAU and TAU B ENCH are outlined in more detail in the following subsections. For a description of the L INPACK benchmark see the cited literature. 2.2.1
TAU F LOW S OLVER
The code is composed of three independent modules: a preprocessing module, the solver and a grid adaptation module. The preprocessing module is decoupled from the solver. Preprocessing steps like grid partitioning and calculation of the metrics can thus be done on a dedicated preprocessor platform. The decoupled solver therefore can handle large scale calculations on distributed memory machines with limited local memory. The third module is used for grid adaptation. It detects regions with insufficient grid resolution and performs local grid refinement. The initial solution is interpolated to the adapted grid. The flow variables of TAU are stored in the vertices’s of the initial grid. Temporal gradients are discretized using a multi-step Runge-Kutta scheme. In order to accelerate the convergence to steady state a local time-stepping concept is employed. The gradients of the flow variables are determined by employing a Green-Gauß formula. Alternatively, a central method with either scalar or matrix dissipation can be employed. The viscous fluxes are discretized using central differences. Several turbulence models have been incorporated for this solver. The flow solver TAU has become one of 4
the standard tools within the German and European aerospace industry and is still actively developed. For a more detailed description we refer to e.g. [GFEG97]. 2.2.2
TAU B ENCH
The scalable Benchmark TAU B ENCH is a pseudo benchmark. It emulates the run-time behavior of the TAU F LOW S OLVER with respect to memory footprint and floating point performance. In order to accomplish this, a run time profile of the TAU F LOW S OLVER has been generated. After analyzing the profile, the actual loop structure of the most cpu consuming kernels has been duplicated. TAU B ENCH therefore can predict the performance of the TAU F LOW S OLVER not only with respect to machine properties like memory bandwidth or cache latencies, but also with respect to the quality of compilers. As a typical example we mention the problem of unrolling/resolving short inner loops and invariant ifs. In order to help the compiler with this task, directives can be inserted by changing the corresponding header files.
Figure 3: TAU B ENCH Since TAU is an unstructured grid solver, it’s most important property with respect to performance is the fact that all accesses to the grid are indirect. On one hand this in general causes performance degradation, since e.g. prefetches cannot be applied easily. On the other hand this fact has been exploited by the developers in the implementation: The preprocessor can optimize the grid for cache architectures: The MPI domains themselves are divides into – minimally connected – subgrids. The size of these subgrids is chosen such that the corresponding data fits into one of the caches of the cache-hierarchy – typically the 2nd level is chosen here. Strip mining then is applied. Since the blocks are minimally connected, the grid points can be renumbered and the data thus at the same time also is blocked with respect to cachelines and the associated caches. In addition, the preprocessor can generate a grid which is suitable for vector machines. The preprocessor then generates subgrids in which the memory accesses within the subgrids are mutually exclusive. In contrast, the pseudo Benchmark TAU B ENCH does not use a preprocessor. Instead the code generates an artificial grid. The features of cache blocking and strip mining thus also had to be included into the code. To this end, the typical memory access pattern of an optimized grid has been analyzed and implemented. The feature of vector colored grids can be used by changing the compile directives in the corresponding header files. Last but not least the MPI communication had to be re-implemented. Since the communication in the original solver uses non-blocking sends/receives for boundary exchanges – overlapped with an occasional MPI-allreduce – the implementation is straightforward. In order to obtain a scalable benchmark, the grid size per processor remains constant. The total grid size thus scales with the number of processors used. As a test for the accuracy of prediction for TAU B ENCH, a wide spectrum of platforms and compilers has been examined. Given the complexity of the problem the comparison of the runtime shows an excellent agreement. Most modern computational fluid dynamics (CFD) solvers rely on unstructured grids. This implies that all accesses to main memory are indirect. Since this is the main bottleneck for this type of application, TAU B ENCH is well suited as a generic unstructured grid CFD Benchmark within the IPACS framework.
2.3
Application Benchmarks
More complex is the structure of application benchmarks. These are derived from real parallel applications combined with a generic benchmark case. These benchmarks will demonstrate the effect of the interplay of different hardware components with their characteristics as measured by the low-level benchmarks, resulting in the sustained performance 5
IPACS ParPac Benchmark (NERSC IBM SP3) 140
GNU compiler gcc VA compiler xlc
performance (Gflop/s)
120 100 80 60 40 20 0
0
500
1000 # processes
1500
2000
Figure 4: Measured speed-up of PARPACB ENCH on an IBM SP3.
of an application. Therefor, this kind of data, which is missing in low-level benchmark suites ([HPC05] und [Muc05]), complements and exceeds the information, that is contained in hardware benchmarks. The benchmarks of this class in the IPACS-Project, chosen as ’representatives’ of their software category, are derived from two applications developed at the ITWM [ITW05] and are provided as source. This allows to study the effect of compiler optimization and to even pinpoint architecture specific bottlenecks. The first one, PARPACB ENCH, is a flow simulation code for viscous fluids through complex three-dimensional porous structures. It is based on the generalized lattice Boltzmann method, describing the Navier-Stokes equations by simulating simplified particle dynamics. It is fully parallelized, making it a highly efficient code for large and complex applications. The automatic domain decomposition allows for dynamic load balancing. The number of communication steps between the calculation nodes is optimized by colored graph methods. As a benchmark case the permeability of a generic cube with a regular internal structure is calculated. The second one, DDFEM, is a parallel 3D linear elasticity solver for steady-state problems. Finite element discretization of tetrahedral meshes, which are generated by the built-in mesh generator, and first order shape functions are used to resolve the problem. An iterative linear solver based on the conjugate gradients method with block-Jacobi preconditioning is employed. as a benchmark the deformation of a generic cylindric structure under an external normal force is calculated. Both applications are implemented in C++, using heavily the object-oriented programming style. The benchmark geometries are generated by the application. Thereby, the size of the problem is scaled by the number of processors to keep a constant load per node and thus to receive a scalable benchmark. These more complex benchmark codes have been ported already to a great variety of architectures and have proven their scalability up to 1000 processors, as shown in figure 4.
2.4
Commercial Software Packages
Finally, the performance of commercial applications and software suites is measured. This is done with the focus on efficiency and productivity of the architecture when executing a real-world, non-optimized application as it is done in production runs. Therefor, the measured performance is the most realistic and most important for the user since it governs the daily work, but is ignored by many benchmark suites. To cover this segment within IPACS, special benchmark cases have been developed for common simulation packages. These benchmarks are dimensioned and generated locally, depending on the number of processors, to achieve flexibility and scalability. The applications supported up to now in this way are F LUENT, S TAR CD and P OWER F LOW. The knowledge of the performance data on all levels of the benchmark pyramid allows already for inference and 6
time / cell / iteration [us]
100
measured predicted
80
60
40
20
0
fl5s1 fl5s2 fl5s3 fl5m1 fl5m2 fl5m3 fl5l1 fl5l2
Figure 5: Measured execution time per cell and iteration (solid circles) compared to the predicted execution time (open circles) on an IBM pSeries690 (1.3 GHz).
conclusion of strengths and weaknesses of a specific system and the influence on application specific performance. But in addition to that, performance modeling and prediction methods based on this data are developed, as shown on the right side of figure 1, which is described in the next chapter.
3
Performance Modeling and Prediction Methods
Another main focus of the IPACS-Project is the development of methods for the modeling and the prediction of performance of commercial codes. The need for and the benefit of performance prediction techniques can be roughly divided into two areas: On the one hand, there is software development, where the understanding of the performance of an implemented algorithm is important for the developer to find and perhaps cure the bottlenecks of the code. For this aim, very precise modeling techniques are necessary, and detailed information and data from hardware counters and/or source code analysis is mandatory. But in many situations and on many systems such kind of information is hard or even impossible (e.g. for commercial software) to gain. On the other hand, performance prediction is also important for the user, who wants to find out, which hardware upgrade would improve the run-time of ’his’ application most effectively. In this case, the data, the modeling is based on, must be easily obtainable, while an accuracy of ≈ 10% for the prediction might be sufficient. But a reasonable estimate for the performance of an architecture, which can not be accessed or is not even build yet, should be possible. This is the area, that is addressed by the modeling methods in this project.
3.1
Serial Performance
In order to find a simplified approach to describe performance some basic assumptions and conditions are necessary. For the class of CFD software considered here it is assumed that the main computational part of these programs provides a distinctive structure: It consists of a loop over elementary building blocks of the inspected geometry like points or cells. The memory size of such a cell is small enough (a few 100 Byte) to fit into L1 cache. The total amount for all cells on the other hand is too large to fit into L2 cache so that there is no cache reuse between different loops. The run-time should then mainly be given by the number of L1 cache hits and L2 cache misses and the associated bandwidths of the architecture. The memory bandwidths are measured using C ACHE B ENCH (see section 2.1.2). These assumptions could be shown to be mainly met by an investigation of the PARPACB ENCH code with the help of hardware counters. In order to apply this model to commercial applications where an instrumentation in general is not possible, the number of cache misses and memory references can be determined approximately on a dual node system with shared bus architecture like the Intel Xeon [Int05a]. In this system the two processors posses their own cache hierarchy while frontside bus for main memory accesses is shared. For the parallel execution of two independent processes with concurrent main memory accesses this results in an reduced, almost halved, bandwidth as shown in [GPKB03] for different computational kernels. This behavior is used by running the application in parallel with an instance of C ACHE B ENCH on the
7
time / cell / iteration [us]
100
measured predicted
80
60
40
20
0
fl5s1 fl5s2 fl5s3 fl5m1 fl5m2 fl5m3 fl5l1 fl5l2
Figure 6: Measured execution time per cell and iteration (solid circles) compared to the predicted execution time (open circles) on an Alpha ES45 (1.0 GHz).
second node which saturates the bus. From the reduced memory bandwidth the number of cache misses and memory references can be extracted. This procedure has been applied to F LUENT using the benchmark cases, that are provided for this application by the vendor together with performance results from different architectures [Flu05]. Measuring and fixing the characterizing data for this application as described above is done on an Intel Xeon. Together with available measurements of the memory system performance from C ACHE B ENCH and the theoretical peak flop rate we arrive at the results shown in figures 5 and 6 for an IBM pSeries690 (1.3 GHz) and an Alpha ES45 (1 GHz), respectively, for 8 different benchmark example cases. As can be seen the prediction of the run-time is quite well. The deviations are mostly less then 10%. Thus this simple approach seems to describe the main aspects of the application concerning the execution time reasonably well.
3.2
Parallel Performance
To capture also the parallel performance and the speed-up characteristics a description of the communication pattern is necessary. The information mandatory to do this is the amount of transferred data, a description of the partitioning by the number of neighbors a processor has to communicate with and a characterization of the network performance. The first part is often reported by the application itself in order to estimate the quality of the applied partitioning. The network characteristics, bandwidth and latency, can be measured with PMB (see sect. 2.1.2). Assuming an optimal, well balanced inter-processor communication with a minimal number of communication steps, the time overhead for communication can then be calculated. This has been applied to F LUENT with an example benchmark case of medium size (fl5m2, 250000 cells, segregated implicit) on an Intel Xeon (2.4 GHz) cluster. To stress the influence of the interconnection, results with Myrinet and fast ethernet are shown in figure 7. The measured speed-up is compared to the prediction. As can be seen the agreement is quite good and the necessary precision can be achieved. Of course, such a simple description can not account for more complicated structures like cache anomalies or competition for bandwidth. But the main characteristics seem to be described and, in connection with the model for the single performance an extension with regard to the cache usage is possible.
8
32
Myrinet fast ethernet
speed-up
16 8 4 2 1
1
2
4 8 # processes
16
32
Figure 7: Measured speed-up compared to the prediction for F LUENT (case fl5m2) on an Intel Xeon (2.4 GHz) cluster using Myrinet (solid) and fast ethernet (open).
4
The Benchmarking Environment
Due to the continuing relevance of High Performance Computing there is an increasing need for people in research labs, institutes and high-tech companies, e.g. decision-makers interested in buying a new supercomputer, to get above all upto-date performance information about specific computer systems. As outlined in section 2, performance aspects can be gained in an objective way, by using the IPACS benchmark suite. To support the execution of benchmarks, a benchmark environment has been developed that also allows users to provide their measured results to third parties. Therefore, the benchmark client submits these information to the web based repository server and all benchmark results can be accessed through dynamically generated web pages just-in-time. The information displayed on this pages is not a single ranking for a specific benchmark as it is done with the L INPACK benchmark on the TOP500 list. Furthermore, it enables a user to see the strengths of the own system in comparison to others as well as to detect bottlenecks and potential problems. As already mentioned PRIO MARK (see chapter 2.1.1) analyzes the file system and disk I/O performance, PMB (see chapter 2.1.2) the load of the interconnection between different nodes and C ACHE B ENCH (see chapter 2.1.2) the memory bandwidth of cache hierarchies. In the following subsections we introduce the benchmarking environment a little more in depth by first recalling a non-computer-assisted benchmarking process cycle. Furthermore, we outline the benchmark client as an essential part of the benchmark execution framework. Later on we will discuss the process how data is shared with the benchmark repository and finally, how interested parties like decision-makers are able to retrieve characteristic information as basis for reasonable investment decisions.
4.1
The Process of Benchmarking High Performance Computers
In recent years, it has become more evident that the process of benchmarking High Performance Computers is quite complex and assumes fundamental benchmarking experience. In particular, a benchmarker has to configure and compile benchmark sources with approved compiler flags and advanced operating system settings. Figure 8 recalls a noncomputer-assisted benchmarking process cycle by the example of L INPACK: a person selects the L INPACK source code from N ETLIB web-site, the L INPACK is transferred to the target computer system, compiled, tuned and by the benchmarker executed without any computer-assistance. Finally the results are pasted into a web-form at TOP500 or send by email to the developer and maintainer of the benchmark. If the results are meaningful, wrong or bad can be seen by feedback from the TOP500 team or the biyearly published and moderated result lists on www.top500.org.
9
Data base Moderator
WebServer
benchmarks and results
install / run BMs
Email Web-Form
High Performance Computer
Person BM-results
Figure 8: Non-Computer-Assisted Benchmarking Process Cycle
Data base Repository
submit results
WebServer
published results
download benchmarks
detect HW+SW, install / run BMs
interacts
High Performance Computer
BM Client
Person
configuration, BM-results
Figure 9: IPACS Process Cycle
IPACS aims at an automated process cycle (see figure 9). The benchmark environment guides benchmarking professionals as well as unexperienced benchmarkers in selection, deployment, execution and tuning of benchmarks as well as in the comparison of measurement results with other computer systems. In detail, the benchmark client connects to the IPACS repository and guides a user in gathering basic facts about the corresponding High Performance Computer. Based on these information the repository server determines appropriate benchmark versions for the specific system and ensures an automatic download of the corresponding files. The benchmark client assists the user in compilation (if necessary), tuning and executing a selected benchmark. Once measurement results are available, they will be transmitted as XML form to the repository server. Finally the client guides the web-based browsing and comparison of the results in the information retrieval component (see section 4.4).
4.2
Benchmark Execution Framework
The IPACS benchmark client as part of the benchmark execution framework is the entry point for persons, companies, or manufacturers, which want to work with the IPACS benchmark environment. After a simple installation process via Java WebStart or a self extracting Java Archive File (IPACSClient.jar), the client software ends the installation process with an installation wizard, where the user finally needs to add extra information like the connection type to the internet.
10
The benchmarking environment provides beside the source code of the different benchmarks also binary versions for different system environments (figure 10). To get an appropriate binary version of a benchmark and also for displaying the results of an accomplished benchmark regarding to results of other systems, some additional information about the measured one are needed. If the auto detection mode is enabled, the client automatically tries to discover the needed information about the current system environment e.g. the current operating system. A simple script enables the user to additionally analyze an environment on a remote computer, if for example, a connection to the system to be measured is only available using a gateway computer. If the auto detection mode is enabled the output file gets automatically added to the client containing the results. Additionally relevant information about the site or the contact person of the measured system still need to be added manually.
Figure 10: IPACS Benchmark Download
The benchmark execution framework can be separated in two major parts: the benchmark client which acts as a mediator between the user and the benchmark repository and the execution part handling the installation and execution of the available benchmarks. The benchmark client has different roles in the benchmark environment. It’s used to gather needed system information and also for collecting the benchmark results, transforming them to an XML File regarding to the IPACS specific DTD and sending them to the benchmark repository. In case the client is running on the system to be measured, it provides an interface which is the association to the second part, the benchmark execution, which can be run as a stand-alone. The benchmark execution part enables a user to execute downloaded benchmarks, by compiling and tuning the source code on a specific system, almost without user interaction. Before execution, standardized settings are made for the benchmarks, so that results delivered are comparable to the other available ones at the IPACS benchmark repository. For example the installation and standardized execution of the HP L INPACK benchmark is already available and other benchmarks will follow soon.
4.3
Benchmark Repository
The benchmark repository provides a central information source for people interested in benchmarking High Performance Computing like scientists, administrators, end-users, manufacturers, or decision-makers. It offers also essential services to the benchmark client like converting textual benchmark results into convincing diagrams.
11
To release benchmarkers from compiling benchmark sources, the benchmark repository provides already built and tuned benchmark files for a variety of architectures. To ensure a correct assignment of benchmark binaries to a specific supercomputer, the repository needs detailed system-information like hardware architecture, MPI-version and available libraries. All required information that could have an effect on the benchmarking process has been already gathered from the benchmark client and finally submitted to the repository (section 4.2). The repository server stores and manages these information for every computer considered for benchmarking including measurement results after benchmark execution.
Figure 11: Simplified UML Class diagram describing a part of the data model
The most critical design aspect of the benchmark repository was to define a unique data model that covers all realworld details or variations in High Performance Computing. Figure 11 shows a slightly simplified UML diagram with the five main components: client, computer, computer-configuration, benchmark and site. A client represents an abstraction of the real world benchmark client that could be connected to a computer. One computer is located at one site and associated with a current computer-configuration. Whereas a computer represents basic and non-changing attributes like component family and date of installation, a computer-configuration covers often changing attributes like current MPI-version. For every benchmark executed on the supercomputer a benchmark contains the measured results according to the current computer-configuration. Certain details like subclasses of hard- and software have been omitted for the sake of clarity. Whereas the transformation of the data model into an object-oriented implementation is rather simple, the development of a suitable persistence layer was another critical design aspect in this context. People interested in using the retrieval component want to compare different benchmark results in a single table and also need a mechanism to sort the information according to different columns. Even though combining object-oriented application layers with relational data bases leads to the so-called impedance mismatch, in this scenario, a relational data base can show its strengths. Based on a XML-mapping file we developed a flexibel persistence layer that allows an easy data model redesign without codemodifications to the business logic (e.g. by adding attributes in order to be responsive to new hardware-architectures). This ensures an easy adaptability of all components for future requirements. In the client-server communication context several message oriented middleware standards like CORBA (Common Object Request Broker Architecture), RMI (Remote Method Invocation) or SOAP (Simple Object Access Protocol) have been considered. Although these approaches are based on higher-level protocols providing easier programming APIs, they all require a sophisticated infrastructure like setting up an Object Request Broker. To ensure an easy deployment of the benchmark client in an unknown environment we decided to keep software requirements as low as possible. Therefore we developed a communication model based on XML-messages and the robust and ubiquitous HTTP-protocol on port 80 that moreover prevents potential firewall-problems. For more information on the design of the IPACS distributed software architecture see [KM04].
4.4
Information Retrieval Component
Doing an investment in a supercomputer requires fundamental knowledge about hardware architectures and application software solutions in High Performance Computing. Decision-makers e.g. interested in buying a new supercomputer
12
Figure 12: Information Retrieval Screen at www.ipacs-benchmark.org
are often not in the proper position to express all technical requirements in a precise way. This is not to question the authority of a HPC center director, who will be able to meet investment decisions very well even without benchmark lists. Nevertheless, IPACS could provide a valuable assistance for decision-makers in the consideration of individual alternatives e.g. in enterprises and research facilities. Additionally, scientists could often specify their needs exactly regarding to software for mathematical models to perform complex simulations like weather forecast, automobile design and financial or economic behavior. But it remains an open question which computer architecture, interconnection or system software are best suited to solve these problems. If decision-makers do not want to rely on the data of computer manufacturers the best solution would be to run the used applications under real conditions at different supercomputers. However, this seems to be an unrealistic choice as on the one hand supercomputers are not generally accessible for anybody or on the other hand novel supercomputers are not yet constructed. A common solution is to use different kind of benchmarks that could reflect the real applications as realistic as possible. Even if it is not possible to run them directly on different supercomputers - using the IPACS repository data base to gather measurement results on a variety of architectures could be an appropriate solution. Additionally, the prediction models focused in section 3 enables performance modeling of not yet built computers from available prototypes. One controversial subject in the presentation of the results is the order in which the computer systems are listed. For L INPACK/TOP500 the computers are easily ordered with respect to their Rmax (maximal L INPACK performance achieved in Gigaflops) value. But with more than one different benchmark it is not possible to find a meaningful way to order the systems. The International Data Corporation (IDC) [Int05b] tries to define a rank based on a (equal) weighting scheme of the different benchmarks to construct a single number for ordering. However there has been disagreement about this scheme in the scientific benchmark community [vdS02] as a weight between different performance numbers depends on particular application characteristics. Each visitor has its own applications which imply different importance (or weights) between the numbers of different benchmarks. Therefore, IPACS will not imply any ordering on the overview results but will provide decision-makers with the option of selection of own ordering schemes for assessment. The information retrieval screen as shown in figure 12 is organized as easy as possible. To receive relevant benchmark results, decision-makers just have to select a set of benchmarks and make some restrictions regarding to manufacturer, computer type, computer architecture, operation system and hardware class. Within this information a table will be created representing the results together with a short computer description and the current computer-configuration. The results
13
HOME | PROJECT | DOWNLOADS | REPOSITORY | LINKS | INTERNAL | CONTACT
Funded by:
Repository
Computer Characteristics Computer Configuration
Computer Description Name
virgo
Software OS
Manufacturer
Intel
Software OS Version 2.4.21-99-default
Computer Type
Linux cluster
Hardware Class
AMD x86-64
Computer Architecture Intel Xeon
MPI Library
mpich-1.2.5..9
Site Name
Fraunhofer ITWM
MPI Device
ch-gm
Date of Registration
2004-06-03
MPI Path
/usr/local/compiler/gnu/mpich-gm
C Compiler
gcc 3.2
F77 Compiler
ifc 7.0
F90 Compiler
ifc 7.0
Last Change
2005-04-25 13:18:39
Linux
Available Benchmark Results ParPac Solver # Processors
1
2
4
8
16
32
64
Solver Total Simulation Time (sec)
299.89
487.45
432.64
454.51
509.19
488.08
535.24
Solver Fluid Grid Point Calculation Rate (millions/ sec)
0.5
0.672
1.356
2.641
5.034
9.618
17.943
Solver Floating Point Operation Rate (Gflop/s)
0.2987
0.4011
0.8097
1.577
3.006
5.742
10.71
Details Details Details Details Details Details Details [ View Graphics ] PMB PingPong # Processors
2
4
PingPong Max. Bandwidth (MB/sec)
222.83
134.57
PingPong Latency (usec)
11.5
19.3
PingPong Bandwidth at 4MB (MB/sec) 220.52 Execution Date
114.11
2005-04-08
2005-04-08
Details
Details
[ View Graphics ] PMB SendRecv
Figure 13:4 Result-Details 2
# Processors
SendRecvMax. Bandwidth (MB/sec)
294.52
136.14
SendRecvLatency (usec)
18.42
33.94
SendRecvBandwidth at 4MB (MB/sec) 291.29
138.63
Execution Date
2005-04-08
2005-04-08
can be compared and sorted according to differentDetails benchmark columns. If someone is interested in more details about a Details special benchmark result, with a click on view the benchmark output is displayed for documentation and verification (see [ View Graphics ] figure 13). PMB Allreduce The web interface is moreover integrated with the benchmark client. When a new benchmark result is uploaded 2 4 to the repository, the client# Processors will open a comparison page, where this results are listed in a table together with other Allreduce Latency (usec) 19.88 38.58 known results for this benchmark. This allows an instantaneous comparison of personal benchmark results with other Allreduce Time at 4MB (msec) 72.01459 182.32269 Date 2005-04-08 2005-04-08 best results from others the benchmark can be further tuned, peoples results. If the resultExecution numbers are below the current Details Details rerun and uploaded again until satisfactory results are achieved. In case a benchmark doesn’t reach an expected result [ View Graphics ] after a comprehensive tuning, one could draw the conclusion that the examined computer architecture is not well suited for this specific class of applications. Besides tabular information there are online graphics directly generated from PMB Bcast the repository content for one benchmark (and one computer-configuration) over all known processor numbers. With # Processors 1 2 4 this visual information benchmarkers easily identify weak scalability or problems with certain processor numbers Bcast Latency (usec)can 0.77 11.6 19.58 at 4MB (msec) 8.1447 45.85323 and it also may be helpfulBcast forTime decision-makers in22.53394 gaining a better insight. If a benchmark provides additional, more Execution Date 2005-05-11 2005-04-08 2005-04-08 detailed graphics, e.g. C ACHE B ENCH or PRIO MARK , the corresponding pictures are generated on the server side after Details Details Details uploading the results automatically. This frees the benchmarker from the installation of additional graphic software like [ View Graphics ] gnuplot or netpbm (see figure 14). In the future IPACS will also provide visualizations for different computers for several DDFEM benchmarks (and certain processor numbers).
5
Conclusion
# Processors
1
2
4
8
16
32
64
DDFEM Time in sec.
19.72
38.51
41.47
56.2
78.57
94.28
131.6
DDFEM Ratio Active Nodes
1
1.022693
1.04534
1.053924
1.05161
1.049234
1.04499
DDFEM Total Number of Active Nodes 33252
64176
123772
242828
472536
919140
1792308
DDFEM Ratio Execution Time
1.02123
1.02058
1.01556
1.01109
1.00834
1.00596
1
Ratio Flop/s 1 1.04376 1.0652 1.07013 1.0576 1.05103 We have presented a sound DDFEM collection of benchmarks for distributed high1.06297 performance computers. The benchmarks meaDDFEM MPI Messages 0 900 6000 22180 78070 243600 713200 sure all critical hardware, interconnect and software parts ofDetails a high performance computer: from the characteristics of Details Details Details Details main memory, disk access,[ View inter node communication, to scientific software architecture and software workload patterns. Graphics ] Based on the developed performance model we are able to predict application performance from tho low level characteri-
CacheBench # Processors
1
CacheBench Read
9124.5614
CacheBench Write 19718.8607 CacheBench RMW
10729.9115
Execution Date
2005-05-11
14
Details [ View Graphics ]
Copyright © 2002-2005 ipacs-benchmark.org
Memory Hierarchy Performance of Xeon.iccO2_4 16000
read write handread handwrite handrmw memset memcpy
14000
12000
MB/Sec
10000
8000
6000
4000
2000
0
32
1024
32768 1.04858e+06 Vector Length
3.35544e+07
1.07374e+09
Figure 14: C ACHE B ENCH
zation benchmarks. To support an easy and efficient benchmarking cycle we developed the IPACS software environment. This environment helps not only in the setup and execution of the benchmarks, but also in the analysis and comparisons of the results. The proposed software architecture is robust and simple to be deployed in a wide variety of heterogeneous client environments. The data base design is elaborate enough to start with the benchmarking but is also flexible in design to be easily adaptable to future requirements. The presentation of the benchmark results is designed to be most useful for the benchmark community. All results are immediately transferred to the web site via the repository server to make them available for comparison and analysis with other results. The next step in the IPACS-Project is to reach a critical mass of data in the repository to obtain a meaningful base for investment decisions. To increase the number of benchmark results in the repository we will further develop adapters for HPC-batch systems and GRID-environments to cover more HPC-systems. Future work will also include the handling of additional benchmark cases in coordination with the IPACS benchmark experts.
Acknowledgments We thankfully acknowledge the fruitful discussions with our colleagues from the IPACS-Project and others. In particular thanks H.-W. Meuer, D. Tavangarian, M. Meuer, A. Geiger, E. Strohmaier for clarifying the requirements of the benchmark process. We also thank S. Kreuter and D. Reinig from the IT Center, our colleges of the department of Information Systems III and the department of mathematics and computer science of the University of Mannheim for their continued support. We thank the Interdisciplinary Center for Scientific Computing (IWR) of the University of Heidelberg for providing access to the HELICS cluster. The work on IPACS was supported by a grant from the German Federal Department of Education, Science, Research and Technology (BMBF) in the program ”High Performance and Grid Computing”.
15
References [BBB+ 91] D. H. Bailey, E. Barszcz, J. T. Barton, D. S. Browning, R. L. Carter, D. Dagum, R. A. Fatoohi, P. O. Frederickson, T. A. Lasinski, R. S. Schreiber, H. D. Simon, V. Venkatakrishnan, and S. K. Weeratunga. The NAS Parallel Benchmarks. The International Journal of Supercomputer Applications, 5(3):63–73, Fall 1991. [Bon05] Bonnie Benchmark. http://www.textuality.com/bonnie, 2005. [CIRT00] P. H. Carns, W. B. Ligon III, R. B. Ross, and R. Thakur. PVFS: A Parallel File System for Linux Clusters. In Proceedings of the 4th Annual Linux Showcase and Conference, pages 317 – 327, 2000. [Flu05]
Fluent Benchmarks. http://www.fluent.com/software/fluent/fl5bench/intro.htm, 2005.
[GFEG97] T. Gerhold, O. Friedrich, J. Evans, and M. Galle. Calculation of Complex Three-Dimensional Configurations Employing the DLR-TAU-Code. AIAA, 97-0167, 1997. [GFS05a] GFS. Red Hat Cluster Project Page. http://sources.redhat.com/cluster, 2005. [GFS05b] GFS. Red Hat GFS 6.0 Administrator’s Guide. http://www.redhat.com/docs/manuals/csgfs/admin-guide, 2005. [GHLL+ 98] William Gropp, Steven Huss-Lederman, Andrew Lumsdaine, Ewing Lusk, Bill Nitzberg, William Saphir, and Marc Snir. MPI — The Complete Reference: Volume 2, the MPI-2 Extensions. MIT Press, 1998. [GPKB03] C. Guiang, A. Purkayastha, Milfeld K., and J. Boisseau. Memory performance of dual-processor nodes: comparison of Intel Xeon and AMD Opteron memory subsystem architectures. In Proceedings of the ClusterWorld Conference and Expo, San Jose, CA, 2003. [HPC05] HPC Challenge. HPC Challenge. http://icl.cs.utk.edu/hpcc/, 2005. [Inn05]
Innovative Computing Laboratory. Repository in a Box (RIB). http://icl.cs.utk.edu/rib/, 2005.
[Int05a] Intel Corporation. Intel Xeon Processor. http://www.intel.com/products/processor/xeon/, 2005. [Int05b] International Data Corporation (IDC). HPC User Forum. http://www.hpcuserforum.com/, 2005. [IOz05] IOzone Filesystem Benchmark. http://www.iozone.org/, 2005. [IPA05] IPACS. Integrated Performance Analysis of Computer Systems. http://www.ipacs-benchmark.org/, 2005. [ITW05] ITWM. Institut f¨ur Techno- und Wirtschaftsmathematik. http://www.itwm.fhg.de, 2005. [KM04] Heinz Kredel and Matthias Merz. The Design of the IPACS Distributed Software Architecture. In 3rd International Symposium on Information and Communication Technologies, Second Workshop on Distributed Objects Research, Experiences and Applications (DOREA), A Volume in the ACM international conference proceedings series, pages 14–19, Las Vegas, 2004. Computer Science Press. [KVT05] Michael Krietemeyer, Daniel Versick, and Djamshid Tavangarian. The PRIOmark – Parallel I/O Benchmark. In Proceedings of the IASTED International Conference on Parallel and Distributed Computing and Networks, pages 595 – 600, 2005. [Lus05] Lustre. Lustre: A Scalable, High-Performance File System. http://www.lustre.org/docs/whitepaper.pdf, 2005. [MLT98] Philip J. Mucci, Kevin London, and John Thurman. The CacheBench Report. http://icl.cs.utk.edu/projects/llcbench/cachebench.pdf, 1998. [Muc05] Philip J. Mucci. LLCbench - Low-Level Characterization Benchmarks. http://icl.cs.utk.edu/projects/llcbench, 2005. [NAS05] NAS Parallel Benchmark (NPB). http://www.nas.nasa.gov/Software/NPB/, 2005.
16
[Net05a] Netlib. High performance Linpack (HPL) at netlib. http://www.netlib.org/benchmark/hpl/, 2005. [Net05b] Netlib. Performance Database Server. http://performance.netlib.org/performance/html/PDStop.html, 2005. [Pal03]
Pallas MPI Benchmarks (PMB). http://www.pallas.com/pages/pmb.htm, 2003.
[Per05]
Performance Evaluation Research Center (PERC). http://perc.nersc.gov/, 2005.
[PJS+ 94] B. Pawlowski, C. Juszczak, P. Staubach, C. Smith, D. Lebel, and D. Hitz. NFS Version 3: Design and Implementation. In Proceedings of Summer 1994 USENIX Conference, pages 137 – 152, 1994. [PM04] Franz-Josef Pfreundt and Matthias Merz. The IPACS project - a New Benchmarking Environment. In International Supercomputer Conference ISC2004, June 23-25, Heidelberg, Germany. MATEO, 2004. [RK00] R. Rabenseifner and A.E. Koniges. The Effective I/O Bandwidth Benchmark (b eff io). In Proceedings of the Message Passing Interface Developer’s Conference, 2000. [San04] San Diego Supercomputer Center at UCSD. http://www.sdsc.edu/PMaC/Benchmark/, 2004. [Sta05]
Performance Modeling and Characterization (PaMaC).
Standard Performance Evaluation Corporation (SPEC). http://www.specbench.org/, 2005.
[TOP05] TOP500 Supercomputer Sites. http://www.top500.org/, 2005. [Tra04]
Transaction Processing Council (TPC). http://www.tpc.org/, 2004.
[vdS02] Aad van der Steen. How informative is the IDC balanced rating HPC benchmark? http://www.hoise.com/primeur/02/articles/weekly/AE-PR-03-02-60.html, 2002.
17