Weibull parameters, wind rose, extracted energy, wind power, noise, Algerian coast. 1. ... alternative energy resources have been and must still continue.
International Journal of Computer Applications (0975 – 8887) Volume 56– No.2, October 2012
Wind Potential Assessment of Three Coastal Sites in Algeria; Calculation and Modeling of Wind Turbine Noise using Matlab M. BENMEDJAHED Unité de Recherche Matériaux et Energies Renouvelables, DNMSE-URMER, University of Tlemcen
N. GHELLAI
A. BENMANSOUR
Unité de Recherche Matériaux et Energies Renouvelables, DNMSE-URMER, University of Tlemcen
Unité de Recherche Matériaux et Energies Renouvelables, DNMSE-URMER, University of Tlemcen
Unité de Recherche en Energies Renouvelables en milieu Saharien/ Adrar
ABSTRACT Our study focuses on the assessment of wind resources of three coastal sites, open to the Mediterranean Sea in north Algeria (Annaba, Oran and Bejaia). The hourly data used in this study span a period of 10 years. The parameters considered are the speed and direction of wind. For this purpose, the most energetic and frequent speed as well as the Weibull parameters were evaluated to plot the wind rose. In order to estimate the noise annoyance, a small30 kW wind turbine was used to produce energy. Then, its noise was calculated and then modeled. The results obtained from the three sites gave annual mean speedsaround4m/s as the west and north sectors are dominant, with an estimated noise level around 45 dB at a distance of60mfrom the wind turbine. Calculation of the energy produced showed that the optimal energy can only be produced by small wind turbines. Among the considered sites, Oran was found to be the best in terms of energy (63.83 GWh/wind turbine), with a capacity factor of around24%
Keywords Weibull parameters, wind rose, extracted energy, wind power, noise, Algerian coast.
1. INTRODUCTION Considering the exhaustion of fossil energy resources and environmental problems caused by the emission of greenhouse gases while using these resources, other alternative energy resources have been and must still continue to be developed. Among these, nuclear fission energy, which does not directly release any carbon dioxide, can be mentioned. However, waste treatment from this mode of production is very expensive, its radioactivity remains high for many years and the risks resulting from the operation of nuclear power plants due to natural disasters or human incidents are irreversible. Renewable energy can be another alternative that allows producing clean and sustainable electricity, with less dependence on conventional resources, provided that natural and random fluctuations are accepted. Today, after water. The low production costs of wind power make it more competitive. It helps reduce greenhouse gas emission in the atmosphere as well. Wind energy by the first decade of the 21st century had a growing importance worldwide, year by year[1][2]. Indeed, the turbines installed in 2009 accounted
for an electrical power of 37500 megawatts, the equivalent of 20 EPR nuclear reactors, representing a 31 % increase, between 2008 and 2009[3] [3]. The works on wind energy potential in Algeria were firstly undertaken by Said & al in their publications [4]in 1984, followed by Benssad in 1985 [5] Hammouche in 1990 [6], Kasbadji Merzouk in 2000 [7]and Farouk Chellali[8]. The present study tries to determine various wind parameters and then focuses on the processing and simulation of hourly data, collected during 10 years (from 2001 to 2010). Wind potential, its direction and frequency are assessed by plotting the wind rose, in order to select the appropriate site for future wind turbines. Finally, after the evaluation of wind power, energy and capacity for WGT 30kw, the environmental impact of wind turbines was evaluated. For this purpose, the ISO 9613-2 calculation model is used in the case where octave data are available; otherwise some calculation formulas based on Matlab are developed. The optimal energy can be only produced by small wind turbines in the Algerian coastal area which is characterized by its significant agricultural potential and where the small wind turbine is used to generate electricity and supply it to electrical equipment (pumps, lighting ...), in an economical way with a low noise impact. This study aims to complete the work of Benmedjahed & al (2010) on installing and dimensioning a wind turbine and its noise impact on the environment in the region of BeniSaf[9].
2. WIND DAT & SITES DESCRIPTIONS In this study, meteorological data from three coastal sites, located in northern Algeria (see figure1), were used to evaluate the wind potential. The geographic coordinates are shown in Table 1. Table 1. The geographic coordinates of data collection station used in the study Location
Longitude
Latitude
Altitude [m]
Oran
00°37’W
35°38’N
90
Bejaia
05°04’E
36°43’N
02
Annaba
07°49’E
36°50’N
04
20
International Journal of Computer Applications (0975 – 8887) Volume 56– No.2, October 2012
Fig 1: The location of the wind measurement station in north Algerian The measurements were performed over the past decade, at a height of 10 m from the ground with a time interval of one hour for each recording
3. METHODOLOGY 3.1 Determination of Weibull parameters The wind characteristics will determine the amount of energy that can be effectively extracted from the wind farm. In order to determine the properties of a site, measurements of the speed of wind and its direction are needed. This study was carried out over a period of ten years. However, previous studies in the field of wind energy showed that the most important and appropriate characteristic to exploit is the Weibull statistical distribution [10]. This is a probability function that can be expressed as: k V f V C C
K 1
V exp C
K
(1)
Parameters k and C are the shape factor (dimensionless) and the scale factor (m/s), respectively. Usually, the shape factor characterizes the symmetry of the distribution. The scale factor is very close to the average speed of wind. The standard deviation method was chosen to determine both factors k and C. This method is based on the calculation of the standard deviation and the average speed [11]:
k V Vm C
1.090
3.3 Extrapolation of the Weibull parameters Justus C.G & all [12]proposed an expression for the exponent of the power law, to extrapolate the Weibull parameters k1 and C1at point z1 towards level z2: z 1 0.0881 log 1 10 k 2 k1 z2 1 0.0881 log 10
z C2 C1 2 z1
(4)
n
(5)
With
n
0.370 .0881 log C1 z 1 0.0881 ln 1 10
(6)
3.4 Wind power (2)
A wind turbine allows extracting the kinetic energy from the wind and converting it into mechanical and/or electric energy. Wind power plants for producing electricity are booming. The theoretical power of wind energy is defined by [13]:
(3)
P
2V m
from a particular direction, it is important to have as few obstacles as possible and an appropriate terrain in that direction.
Vm: average speed (m/s) σ: standard deviation(m/s)
1 S V 3 2
(7)
ρ: density of air at sea level(kg/m³).
3.2 Wind rose
S: pipe section or area swept by the rotor (m2).
The wind rose is like a navigational compass that divides the horizon into angular sectors. For each sector, are exhibited [11]: The wind frequency, i.e. the percentage of time that the wind blows in this sector, The average wind speed multiplied by its frequency, The power available in the wind. The wind rose plays a very important role in locating suitable sites for wind turbines. While much of the wind energy comes
V: wind speed(m/s).
peff ce
1 .S .V 3 2
(8)
Ce : coefficient of efficiency of the wind turbine.
21
International Journal of Computer Applications (0975 – 8887) Volume 56– No.2, October 2012
3.5 Estimation of the generated energy and the capacity factor The histogram method is used to estimate the energy generated by a wind turbine. The superposition of the energy response curve (KW) and the frequency histogram give[13]:
E
n
Pi Vi Fi Vi N i 1
(9)
N: number of hours per year. P (Vi): effective power of the wind turbine at speed Vi. F (Vi): probability at speed Vi.
E PN 8760
(10)
Usually, in order to measure the wind turbine noise, the level of the weighted acoustic power is calculated as an average level at 500 Hz. The impact of noise is calculated according to the international standard ISO 9613-2[14], as follows: (11)
Where LAW :level of weighted acoustic power of the noise source. D D : Correction made in order to take into consideration the directivity of the source (with out directivity=0dB) and the reflection on the ground DΏ which can be calculated as follows: C
d p 2 hs hr 2 D 10 Log 1 2 d h h 2 p s r
(12)
hs: height of source above the ground (hub height). hr: height of point of noise impact (depending on the regulations but also adjustable when defining the calculation). dp: distance between noise source and point of impact, projected on the ground (m). The distance is calculated from the coordinates (x, y) of the source (index S) to the point of impact (index r):
dp
x s x r
2
ys yr
(17)
hm: average height (m) of noise path above the ground. If no digital model of ground is found, then the average height can be calculated as follows:
hs hr
(18)
2
If contour lines are available, the vertical surface F is calculated, between the wind turbine and the point of noise impact. This surface is bounded by the ground and the straight line passing through the wind turbine and the point of noise impact. The average height is calculated as follows:
hm
3.6 Calculation models to estimate the noise level
LAT DW LWA DC A Cmet
2h 300 Agr 4,8 m 17 0 d d
hm
The capacity factor is defined as the ratio of the actual energy produced in a period of time (E) e, if the turbine operates at its rated power (PN), for one year.
CF
α500: absorption coefficient of air= 1.9dB/km in the most favorable condition of noise propagation (temperature = 10 °C and relative humidity = 70 %). Agr: attenuation of ground:
F d
(19)
F: total area after integrating all sub-areas calculated at each step(m2). d: distance between source and point of noise impact (m). Cmet: weather correction. This is done as follows cmet 0 if d p 10hs hr 10hs hr if d p 10hs hr cmet c0 1 dp
(20)
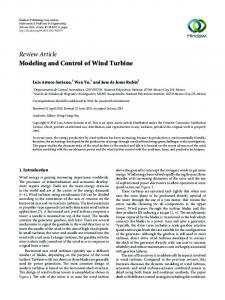
3.7 Wind turbine In the group of small wind turbines (personal or even domestic wind turbine), type FUHRLÄNDER FL 30 of wind turbines retained our attention. Its data sheet is shown in Table 2 and its power curve in Fig2. These wind turbines can be small to medium-sized; their power may range from 100 watts to 30 kilowatts. They are mounted at 10 to 35 meters high poles, and can be either connected to the network or stand-alone in an isolated rural site. Table 2. Wind turbine parameters[15] Model
FUHRLÄNDER FL 30
Rated power
30,0 kW
Rotor diameter
13,0 m
Hub height
27m
Swept area of rotor
133 m2
Cut-in wind speed
4 m/s
Rated wind speed
18 m/s
Cut-out wind speed
25 m/s
2
(13)
A: attenuation during noise propagation between the source (the wind turbine nacelle) and the point of impact. The total attenuation is given by:
A Adiv Aatm Asol
(14)
Adiv: is the attenuation due to spatial propagation
Adiv 10Log d 11
(15)
d: distance between source and point of impact(m). Aamt: attenuation due to atmospheric absorption
Aatm
d
1000
(16)
22
International Journal of Computer Applications (0975 – 8887) Volume 56– No.2, October 2012 Table 3. Weibull distribution parameter and wind speeds for three studied sites at 10m height site C (m/s) k V (m/s)
35 30
Power(kw)
25 20
Oran
4.9
1.84
4.4
Bejaia
4.8
2.64
4.2
Annaba
4.3
1.75
3.8
15 10 5 0 0
5
10
15
20
25
Wind speed (m/s)
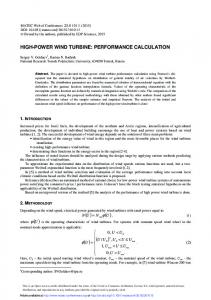
Statistical data analysis allowed the determination of the wind rose which is the graphical representation of wind frequency against the direction in a polar reference. It is determined for ten years. The results obtained (see Fig3) show that:
Fig 2: Power curve for WGT 30K (EMD 2009)[15]
4. RESULTS & INTERPRETATIONS
From the hourly data measured for ten years, from 2001 to 2010, in the three weather stations (Oran, Bejaia and Annaba) at a height of 10 m from the ground, the Weibull parameters could be calculated for the three sites (see Table3).
The factor form value k (2.64) for Bejaia shows that the distribution is stable, whereas the two other sites have a lower value of k, which means that winds are widely dispersed. Analysis of the scale factor C shows that Oran the most windy (4.9 m/s) and the least windy is Annaba (4.3 m/s)
NNW 35 30 NW 25 20 15 WNW 10 5 W 0
In Oran, the prevailing wind direction is the north which represents 29.5 % of episodes and other predominant directions are west-south-west (SW) and west which have respectively16.18 % and 11.97 % of episodes. In the region of Bejaia, the western sector represents 30.46 % of wind frequencies, while the west-south-west (WSW) and the east directions are two predominant sectors with a percentage of around 20 % each. In the area of Annaba, almost all sectors are equal; however the west direction remains dominant with16.17 %.
N NNE %
NE ENE E
WSW
ESE SW
SE SSW
SSE S
NNW 35 30 NW 25 20 15 WNW 10 5 W 0
Annaba
N
N NNW 35 30 NW 25 %
NNE %
NE
WSW SW
ENE
WNW
E
W
ESE
WSW
SSE S
NE
20 15 10 5 0
ENE E ESE
SW
SE SSW
NNE
Oran
SE SSW
SSE S
Bejaia
Fig 3: The wind roses for three studied sites at 10m height The western sector which is common to the three sites represents a significant percentage of frequencies for all the three, with a substantial average annual wind speed, ranging from3.5m/s to5.2m/s. The study of distribution of available energy (see fig4) shows that an energy exceeding2600kWh can be exploited in the three sites; the valuesof energy produced in one year in Oran, BejaiaandAnnabaare63.83,55.86and48.86GWh, respectively. Therefore, the maximum value of the capacity factor is 24% for Oran (seeFig5).The results show that Oran is the most
favorable site for the installation of this type of wind turbines, though Bejaia still remains profitable in rural and remote areas. The results for Annaba are somewhat lower compared to the first two sites.
23
Wind energy produced (GW/Yer)
International Journal of Computer Applications (0975 – 8887) Volume 56– No.2, October 2012
80
63.83 55.86
60
48.68
40 20 0 Oran
Bejaia
Annaba
site
Fig 4 :Annual wind energy produced results by WGT
30kW 24
Capacity factor (%)
24 23
using the (ISO 9613-2 [12]) method, the noise level is around 45 dB (A) at 60 m from the source. The noise fading due to spatial propagation is 50.86 dB (A) while the other attenuations are virtually negligible, but a correction of the order of 2.9 dB (A) is necessary in order to take into account source directivity. At a distance of 120 m, the noise level will be around 42 dB (A) and fading due to spatial propagation is of the order of 55dB (A) and atmospheric absorption around 0.23 dB (A). The correction is practically invariant. It is found that noise intensity decreases with distance from the source .Fading due to spatial propagation is the most significant factor that decreases the energy of sound waves. Disturbance from wind turbine noise during operation is low given the animal adaptability and the intermittent nature of noise emitted by wind. The noise level of a wind turbine is 42 dB (A), which corresponds to the noise inside quiet house. Hence, these noise levels have no effect on health and are consistent with the national standard (Executive Decree No. 93-184 of July 27, 1993, regulating noise emission).
5. Conclusion
22
21
21
20
20 19 18 Oran
Bejaia
Annaba
site
Fig 5 : Capacity factor results by WGT 30Kw The noise emitted by a wind turbine constitutes the main impact on environment. Noise can be produced by any obstacle placed on an air flow trajectory. The tone of this noise depends on the shape and dimensions of the obstacle as well as on the air flow speed, in addition to the mechanical noise from the operation of all components present in the enclosure. The main noise generating components are: the multiplier (except for some recent models), shafts, the generator, and auxiliary equipment (hydraulic systems, cooling units). The WGT 30kWwind turbine was chosen considering its low noise power. Matlab software was used to calculate the noise generated by the wind turbine under the conditions that can be met by our three sites (flat ground).
This study focused on the evaluation of wind potential of three coastal sites in northern Algeria (Annaba, Oran and Bejaia), in order to use small wind turbines, based on wind speed measurements recorded during a ten-year period, from 2001 to 2010. Wind resource analysis in the selected sites shows that northern Algeria has a wind energy potential that can be exploited effectively. Indeed, statistical treatment of data allowed evaluating the characteristic speeds and wind potential for each site. The results obtained show that: The average annual wind speeds, at 10 meters from the ground, are around 4.4 m/s, 4.2 m/s and 3.8 m/s for Oran, Bejaia and Annaba, respectively. As for the values of the Weibull parameters (at ten 10 m above the ground), the respective form factors k are 1.75 in Annaba, 2.64 in Bejaia and 1.84 in Oran, while the scale factor A is 4.3 m/s in Annaba, 4.8 m/s in Bejaia and 4.9 m/s in Oran. The western sector represents 30.46 % of wind frequencies in the region of Bejaia, and only16.17 % for the site of Annaba. However, the prevailing wind direction for Oran is the north with 29.5 % of episodes. The estimated capacities of the yearly energy produced at the sites of Oran, Bejaia and Annaba are 63.83,55.86 and 48.68GWh, respectively. The maximum capacity factor was 24% and was recorded in Oran. The noise level at 60 m above the ground, of the selected wind turbine is 45 dB (A), which corresponds to the noise inside a quiet house. These noise levels have no environmental effects.
6. REFERENCES [1] Carlin ,P W. Laxson .A.S, Muljadi. E. B. 2003.The History and State of the Art of Variable-Speed wind Turbine Technology. Wind Energy. 6:129–159. Fig 6: Noise propagation emitted by WGT 30kW The results of noise propagation are exhibited in fig 6.This wind turbine produces noise of magnitude 93 dB (A), (as given by the manufacturer). According to our calculations,
[2] Veldkamp , D. 2008. A Probabilistic Evaluation of Wind Turbine Fatigue Design Rules. Wind Energy11:655–672 [3] Boulif,M. 2010. L’Energie éolienne au Communication SMEE’2010.Alger. Algérie,
Maroc.
24
International Journal of Computer Applications (0975 – 8887) Volume 56– No.2, October 2012 [4] Said,M. Ibrahim,A.1984. Energy in the Arab. World. Energy. 9(3):217-38. [5] Bensaid,H .1985. The Algerian program on wind energy.Proceeding of WEAC,Oxfordpp. 21-27. [6] Hammouche, R. 1990. Atlas Vent de l’Algérie. ONM Office des Publications Universitaires (OPU). Alger. [7] Kasbadji Merzouk, N. 2000. Wind energy potential in Algeria. Renewable Energy. 21:553-62. [8] Chellali,F.Khellaf,A.Belouchrani,A. 2010. Application of time–frequency representation in the study of the cyclical behavior of wind speed in Algeria: wavelet transform.Stochastic Environmental Research and Risk Assessment. Vol8:1233-9. [9] Ben Medjahed ,M. Ghellai ,N.Tabet Hellal,MA. 2010 .choix du site et optimisation du dimensionnement d’une installation éolienne dans la région de ben Saf et son impact sur l’environnement. internationale d'héliotechnique.42, 1-6.
[11] Mathew,S .2006. Wind Energy Fundamentals.Resource Analysis and Economics,Springer-Verlag Berlin Heidelberg. ISBN-13 978-3-540-30905-5. [12] Justus,C G,Mikhail .1976.A.Height Variation of Wind speed and Win Distributions Statistics.Geophysical Research Letters. vol. 3: N° 5. [13] Yousef , B. Aymeric,G. 2005. Collecte, organisation, traitement, analyse de mesures éoliques et modélisation énergétique.Thèse doctorat,Université Tecnica Federico Santa Maria, UTFSM.Valparaso.Chili. [14] Judith , L. Gmbh ,L.1996.Industrial noise - Description of the calculation method. AR-INTERIM-CM adaptation and revision of the interim noise computation methods for the purpose of strategic noise mapping .LABEIN Technological Centre. [15] EMD .2009. The WindPro Software. Available from: http//emd.dk/WindPro/downloads%20 and20%updates (accessed 10july2011),
[10] Solari,G.1994.Wind Speeds Statistics.Collège on atmospheric Boundary Layer and Air Pollution, ICTP, Trieste, Italie .
25