Eighth International IBPSA Conference Eindhoven, Netherlands August 11-14, 2003
CALIBRATING MODELS FOR SIMULATION USE IN DESIGN PRACTICES Mark Tamburrini1 , David Palmer1 and Iain A Macdonald2 1 CampbellPalmer Group, Glasgow, Scotland
[email protected] 2 Scottish Energy Systems Group (IBPSA Scotland), University of Strathclyde, Glasgow, Scotland
[email protected] http://www.sesg.strath.ac.uk ABSTRACT When making design decisions, which can impact on building capital cost and performance, the design team has to be confident that the simulation tool is generating reliable output. Confidence can be gained via several mechanisms. In all cases data quality is of prime importance. Recognising the quality of data, or the lack of quality, and how this impacts on the predictions of the simulation tool is crucial to making informed design decisions. This paper describes information sources and their use with respect to simulation. To elaborate the process, inputs and outputs are examined from an example Supported Technology Deployment. The example demonstrates effective simulation use for assessing the refurbishment of an existing building. Many information sources were available to the design team, including data collected from site visits and from interviews with the building’s occupants. The example also demonstrates how simulation can be a cost effective solution for a client. INTRODUCTION IBPSA Scotland is involved with the transfer of simulation tools into design practices [McElroy et al 2001]. A key element of this process is a Supported Technology Deployment (STD) whereby simulation is used by the design team within live projects with technical assistance given by IBPSA Scotland. From this work several issues have been identified as barriers to the practical use of simulation: training of employees, investment in computer hardware and software, data collection, and assuring confidence in results. IBPSA Scotland is addressing these issues via several mechanisms, including training events, seminars and publications, and through the use of a configured computer loan pool and accompanying technical assistance. This last mechanism is the STD. This allows companies to use simulation technologies without the need to invest in new hardware and software, with the assistance of a simulation specialist to guide users through the process. Typically, an STD is focussed on a live project, thereby highlighting the benefits directly to practitioners within a commercial context.
Even though practitioners are supported by a specialist there are still barriers to the effective use of simulation. This paper focuses on those barriers that revolve around the quality of the data as used to construct a building model. PRACTICAL SIMULATION ”The results of modelling work must be balanced with a suitably pragmatic appreciation of the practicalities of the construction process and the variability of occupant behaviour.” [CIBSE 1998] Simulation tools have evolved and matured into commercially useful tools over the last decade. This has been due, in part, to extensive validation activities directed towards a range of simulation tools, e.g. Apache, SERI-RES, CLIM2000 and ESP-r [Lomas et al 1997, Strachan 2000]. Generally, the predictions made by such tools are considered to be acceptable, which would indicate that they may be applied commercially. However, there are yet two related barriers to be overcome: • When applied to real buildings, there is significant uncertainty as to the correct values of data, and • the ’correct’ data has to be entered into the tool. The former barrier is related to selecting the building characteristics which should be applied to the model, e.g. the value of casual gains, the thickness of a construction material, or the control set point. The second barrier is related to user confidence that the values chosen during the initial stage are correctly entered into the software tool, i.e. the intended model has been correctly defined. There are several mechanisms to support the checking of data at this stage, one such facility is displayed in figure 1. This data table was automatically generated by a simulation tool and shows the user pertinent data for a zone in their model. As can be seen surface areas, construction details and boundary conditions are reported initially, followed by air flow and casual gain data. It is clear from this table that there is a significant air supply throughout the week, although the
- 1273 1265 -
Figure 1: Section of a QA report. space is only used for six days of the week. As part of the STD process the simulation specialist will use information such as this to ask questions about the model, e.g. why is there such a large air supply on a Sunday when the building is unoccupied? To use simulation tools in practice requires that the user be able to review the data entered into the system and to judge it quantitatively. Given that these requirements are met, the tool should then provide acceptable performance predictions.
to assist with identifying cost-effective methods of refurbishing the roof of a factory. The factory comprised two contiguous buildings: the original being 100 years old and of sandstone construction, with an extension added in the 1960s constructed of cavity brick. The factory has significant overheating problems. In one area there are 110 people working in a floor space of 1800m2 , with high heat gains from occupants, factory equipment and lighting. Despite an existing mechanical ventilation system, air movement in the factory was reported to be poor, and temperatures of up to 34◦ C had been recorded over a summer period.
APPLYING SIMULATION An innovative Scottish environmental engineering company has recently started to employ detailed modelling to address some of the more complex design issues being faced by the practice. In one case, the company wished to employ simulation
The model creation process for this project raised several issues of the type discussed above. Original plans were considered to be inaccurate, the building fabric was not up to current standards (therefore thermal performance was uncertain), and the heat gains from people and equipment were variable due to work practices.
- 1274 1266 -
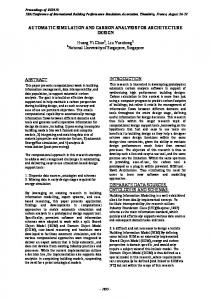
Figure 2: Results of initial calibration simulation. However, as the building existed, site measurements and interviewing of key staff could be carried out in order to reduce uncertainty in the model inputs.
Simulation process
affected areas (at a capital cost of £100 000) in order to make working conditions more tolerable for the employees. This was seen as an inelegant approach because ambient temperatures at the site are typically below 20◦ C, indicating that there is a significant free cooling resource available.
The following procedure was planned: 1. collect pertinent data to create a suitable model, including a site visit; 2. create model and run calibration simulations; 3. compare results with measured temperature data; 4. adjust model if required; 5. apply design changes to calibrated model and extract results.
Simulation aim The client wanted to achieve the most cost effective solution to the overheating problem. However, it was recognised that the re-roofing and cooling plant installation would be large and potentially expensive projects. A fundamental reassessment was recommended and a detailed study with no pre-conceived ideas about solutions was initiated.
Model Motivation The factory roof required replacing due to leaks and in the process it was planned to upgrade the roof’s thermal performance to comply with current UK Building Regulation Standards. To remedy this the client proposed to over-clad the roof with a new highly insulated system, including up to 200mm of additional insulation. However, initial simulations suggested that this would exacerbate the problem of high internal temperatures throughout the year. During initial meetings it was evident that the factory owners were unaware that this would be the likely outcome. The clients preferred solution to solve the overheating problem during these initial stages was to install air conditioning in the worst
A model of the factory was constructed using the ESPr system [ESRU 2003] to allow examination of the effects of heat gains and losses, and air movement within the factory. The data used was from supplied plans, schedules and interviews with the factory plant operators. Initial simulations indicated that despite careful attribution and checking of the building model, the internal temperatures and humidity measured in the factory were not reproduced in the simulation results. During a site visit, temperatures measured in the building were typically about 25◦ C for an ambient temperature of about 10◦ C. Figure 2 shows the predicted temperatures in various spaces and the ambient temperature. The predicted temperatures are significantly lower than
- 1275 1267 -
Figure 3: Results of calibrated simulation. those measured. This indicated that there was an error in the model or the simulation tool. Key features of the zones reported in figure 2 were high casual gains, up to 100W/m2 , and high fresh air supply rates, up to 16 air changes per hour. These data were re-checked and were found to be entered correctly into the model. After extensive checking it was suspected that there was an error in the data specification, i.e. the heat gain or ventilation data supplied was in error.
QA checking A key component of a Supported Technology Deployment is the support available from suitably experienced users of simulation tools. Using this expert resource the model was checked for consistency, user errors and data input errors. After these checks were made (highlighting some small errors) the model was still predicting temperatures as displayed in figure 2. Clearly the model was still in error and several ad hoc simulations were made of perturbed models in an attempt to identify the source. It was discovered that the predictions made by the model could be brought into line with the measurements (figure 3) if the ventilation rate was reduced by 95%. This was a significant change to the data used in the model and a further site visit was arranged to check the flow rates through the existing ventilation system.
Second site visit Upon the return visit to the factory it was found that only 5 of a total of 125 fans were actually operating,
hence validating the calibration process outlined above. It was later discovered that very little maintenance had ever been carried out (over a thirty-year period) on the ventilation system. Therefore, the initial information supplied was in error. These errors were compounded during the initial site visit where the maintenance manager indicated that the ventilation system was well maintained. The second site visit with its focused purpose (the measurement of ventilation system performance) based on the results of the initial simulations, identified the errors in the supplied data. Having thus calibrated and gained confidence in the model, it was then possible to re-assess the actual fresh air ventilation requirement to achieve comfortable room temperatures with the existing and proposed new roof constructions.
Simulation outcome Based on these results, the client no longer needed to consider air conditioning. It was proposed to refurbish the existing ventilation system to provide sufficient fresh air ventilation for the factory. Using the simulation results, it was also possible to establish that 100mm of insulation, together with the improved ventilation, would be more effective than the higher level of 200mm as originally proposed. This was still UK building regulation compliant as the overall CO2 emissions due to fuel use in the building are reduced as the air conditioning system is unnecessary (compliance checking via simulation based performance assessment is described elsewhere [McDougall and Hand 2003]).
- 1276 1268 -
Prior to implementation of the simulation exercise, the overheating problem in this factory appeared complex and potentially costly to solve. However, the results from the simulation showed that if the existing ventilation system could be restored and a reduced level of roof insulation was installed, the problems would be solved. Ultimately, modelling provided the client with a solution which is likely to present capital cost savings of the order of £50 000 in roof insulation and £100 000 in air conditioning plant. The cost of refurbishing the existing ventilation system was £30 000. Furthermore, the associated energy savings would be about 715 000kW h per annum. The cost of the simulation work was £4 000, justifying the assertion that dynamic building simulation was the most cost effective mechanism of identifying an apposite solution. Figure 4: Three data models of a building. LEARNING OUTCOMES The input data requirements of simulation tools can be extensive and a detailed review of data sources, issues, common mistakes and checklists has been published elsewhere [CIBSE 1998]. One aspect of modelling that the practitioner should be made aware of is that there are three versions of a building, one real and two virtual (figure 4): • the as-built design, • the planned design, and • the design as represented in the simulation tool. All three of these ’buildings’ should be equivalent. However, this is rarely the case and the differences between the simulated and real building may be substantial. The sources of non-equivalence are now summarised and methods to reduce the likelihood of error described with particular emphasis on existing buildings.
Performance specification and drawings These are the most frequently used source of information when creating models for simulation. Typical information contained therein includes • building geometry, orientation and location; • construction details; • occupancy patterns; and • heat loads and ventilation rates. There are several issues relating to these data: • The plans may be out of date due to design changes or refurbishments, e.g. openable windows may not have been installed due to achieve cost reductions.
• The building may not have been constructed as described, e.g. insulation may not have been installed uniformly due to poor construction control. • Spaces within the building may not be used as intended, e.g. rooms may have a higher heat load due to an increased use of IT equipment. • Build quality will effect the air tightness of the building and therefore design infiltration rates may be far removed from actual values. • Plant systems may not be commissioned correctly leading to errors between planned and actual operation, e.g. flow rates could be greater. • Maintenance may be inadequate leading to plant and building fabric components not performing as anticipated, e.g. fans may be broken or windows may be dirty, thus reducing solar transmission. Overall, the plans and drawings of a building represent the most cost-effective data source for use in simulation. To reduce the above uncertainties in the case of existing buildings site visits are essential and appropriate measurements should be taken.
Measurements Site visits are generally a useful tool in the case of existing buildings and many of the above uncertainties can be reduced. There are several useful measurements which can be taken to aid the modelling procedure. These include energy consumption data, temperatures, light levels etcat varying frequencies, e.g. spot measurements or data automatically logged at fixed time intervals, for example half hourly. The purpose of these measurements is to increase the confidence in the model created. The modelling process should include a calibration phase. The nature of any calibration may be crude due to the inability of the practitioner to make extensive measurements in a commercial time scale. However, if the
- 1277 1269 -
model is generating significantly different predictions to the measurements then there is likely to be a problem with the data as used in the simulation. One mechanism to trace the errant data is to interview the building operators and occupants.
In the example given, the data supplied was in error. With the use of a detailed simulation tool the performance of the building was examined and the data error identified. This error was confirmed via a site visit.
Information gathered from building occupants is prone to error but may inform the practitioner about strange usage patterns and/ or work practices, e.g. the first person into the building switches on all of the lights rather than a subset causing a larger than anticipated heat load.
Overall, the use of simulation was perceived to simplify the analysis process as traditional manual calculations were avoided. If these methods had been used then the critical nature of the fan’s performance to the building’s internal environment would not have been so evident. By using simulation as described, less time was required on site as these visits were focused on specific issues. Finally, the example shows that simulation can result in significant cost savings for a modest investment.
HANDLING UNCERTAINTIES
REFERENCES
Occupant’s descriptions
Typically, only changes in a few data items will effect simulation predictions. The problem for the practitioner is that it is not possible to know these data items a priori. However, many techniques exist to analyse the sensitivity of predictions to variations in the input data [Saltelli et al 2000] and some of these have been embedded within building simulation software [Macdonald 2002]. Traditionally, practitioners have carried out ad hoc uncertainty analyses. This process is often part of a good practice approach to simulation whereby suspect data and key assumptions are altered and the effect noted on the simulation output. Where significant effects are noted, the practitioner may then initiate further checks to confirm the correct value. Typically, several important data items are discovered out of the many hundreds used within a simulation model. The practitioner can then focus further data collection on these data in the case of existing buildings. It should be noted that if a modelling process is undertaken for a new building, then on-site quality assurance checks should be made to confirm that the critical aspects of the design are correctly addressed.
CIBSE 1998, Building Energy and Environmental Modelling, CIBSE Applications Manual AM11. ESRU 2003, The ESP-r http://www.esru.strath.ac.uk.
System,
Lomas K J, Eppel H, Martin C J and Bloomfield D P 1997, Empirical Validation of Building Energy Simulation Programs, Energy and Buildings, Vol 26, No 3, pages 253-276. Macdonald I A 2002, Quantifying the effects of uncertainty in building simulation, PhD thesis, ESRU, University of Strathclyde. McDougall S and Hand J 2003, Using simulation to move from daylighting issues to first use of the new UK carbon emissions calculation method, Proc. Building Simulation ’03, Eindhoven. McElroy L B, Clarke J A, Hand J W and Macdonald I A 2001, Delivering simulation to the profession: The Next Stage?, Proc. Building Simulation ’01, Rio de Janeiro. Saltelli A, Chan K and Scott E M 2000, Sensitivity analysis, J Wiley and Sons.
CONCLUSIONS When applying simulation in practice it can usually be assumed that given a well tested simulation tool and suitably trained users, errors in the predictions will be due to errors in the data used. There are two possible mechanisms whereby errors in the data will be introduced to the tool: a simple data input mistake and incorrect data supplied by the client.
Strachan P A 2000, ESP-r: Summary of Validation Studies, ESRU Technical Report, University of Strathclyde, Glasgow.
IBPSA Scotland, through its Supported Technology Deployments, is ensuring that practitioners are given the necessary skills and confidence in checking that the supplied data has been entered correctly into the simulation tool. This is a necessary process for any simulation project. However, it also assists the training of the user and their confidence in the tool when they see that they have made few modelling mistakes.
- 1278 1270 -