Eleventh International IBPSA Conference Glasgow, Scotland July 27-30, 2009
COMPUTER SIMULATION FOR BETTER DESIGN AND OPERATION OF LARGE OFFICE BUILDING AIR-CONDITIONING Milos Lain1, Jan Hensen2 and Vladimir Zmrhal 1 1 CTU in Prague, Faculty of Mechanical Engineering, Czech Republic;
[email protected] 2 Center for Building & Systems TNO-TU/e, Technische Universiteit Eindhoven, The Netherlands. . ABSTRACT The paper deals with the use of computer simulations both for the design support of a new buildings and HVAC system development and for the optimisation of the system control strategy in the building. This is presented on a real office building in Prague. For a new large bank head office in Prague, computer simulations were carried out to find solutions for reducing the required cooling capacity, verify the fan-coil capacity design, and optimise the external gassing for atriums. Because the design included exposed concrete ceilings, the idea was to apply building thermal mass and find out a way to operate the building. The cooling capacity was initially estimated at 3 MW and simulations proved possibility of decreasing it to 81 % for the whole building. Other simulation helped designers to optimise, roof glazing and shading for atria, with stress on thermal comfort in open corridors. The building and HVAC system monitoring and meassurements to confirm the simulation based design changes are presented in the paper.
INTRODUCTION
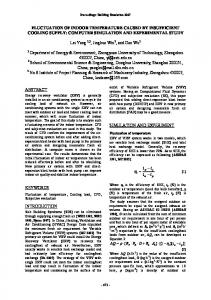
but can include the indoor environment, while simultaneously taking into account the outdoor environment, mechanical, electrical or structural systems, and traditional and renewable energy supply systems. By assessing equipment and system integration ideas, it can aid building analysis and design in order to achieve a good indoor environment in a sustainable manner, and in that sense to care for people now and in the future. Building Description The presented building is a large office (bank headquarters) building in Prague. With a footprint of 220 x 75 m, it is one of the largest projects in the Czech Republic to date. The building includes office area with a capacity for more than 2500 employees. It has 8 floors; 5 above and 3 below street level. The main longitudinal axis is east-west. The building structure is medium heavy and allows heat accumulation in its reinforced concrete load bearing elements such as ceilings, floors and columns. Most of the Envelope is glazed, with some lightweight elements. It has blinds as external shading. The building can be divided in 6 sections (A – F), plus three large, glazed roof atriums and two small open atriums (Figure1). The employees’ workplaces are equally distributed in open space office areas. Smaller briefing rooms, conference rooms and single executive offices are adjacent to the atria. Toilets, kitchenettes and cleaners’ rooms are concentrated near lifts and staircases. The roof has terraced gardens with deciduous trees. This paper focuses on the office areas of the building.
The computer simulations have the potential to add value in all stages of a buildings life cycle; design constructing and commissioning. The value of computer simulation when used in early conceptual design lays in the opportunity to quantify the effect of design decisions on energy and comfort thereby reducing the time needed to turn-around design iterations. During the detailed design stage, computer simulation can provide a means to optimize the favorite design solution. Air-Conditioning System To provide substantial improvements in energy consumption and comfort levels, there is a need to treat buildings as complete optimized entities not as the sum of a number of separately optimized components. Simulation is ideal for this because it is not restricted to Figure 1: Typical floor 1. large atrium, 2. small atrium, 3. air duct the building structure itself
- 740 -
There is a separate air-conditioning system for each section Depending on the particular section, the air supply is via VAV, VAC boxes or 4-pipe fan-coil units (FCU). The FCUs allow both cooling and heating. All pipes are located in the floor. The supply units have a 3 stage regulation. The FCUs have fan rotation speed control. The control system allows the shut-down of a particular FCU or VAV box, but the minimum supply of fresh air per person is guaranteed. A few ventilation units for air supply and exhaust are placed on the roof of each section. Both supply and exhaust fans of the units are equipped with frequency inverters. Some of the air is extracted by one unit from toilets, kitchenettes, storage and IT rooms, however the majority of the air is exhausted via the atriums.
operation strategy to enable a decrease in the nominal output of chillers, and at the same time ensuring that the energy consumption will be as low as possible. This stage was based on whole building energy simulation. To verify the terminal units cooling capacity there was a simulation of selected rooms performed for typical and extreme climate conditions. The proper glazing and shading of atriums was another issue, where the computer simulation of atrium helps to find optimal solution.
BUILDING SIMULATION Every professional designer performs some kind of optimization in each stage of the design process in order to ensure a good indoor environment quality while limiting or minimizing energy consumption. But this task is very complicated in current practice because each stage of project documentation is processed by another subject and cooperation of specialists is limited. The role of the investor andtheir expert consultant is crucial for the coordination and transfer of ideas in this procedure. During the CSOB project, the expert consultant emphasized the energetic conception, and because in this case this consultant was the same person for all the stages of the project, all decisions were kept. Next, elements that help with optimization of the whole building concept as well as with particular details were individually assigned to pilot projects Three pilot projects for the design of energetic conception of the building were processed in total. The first very extensive pre-design study “Environmental Strategy Assessment ” was approved by the Buro Happold Company in 2004. This complex study set basic building parameters and system concepts regarding the energy balance, lighting, acoustics and air flow. In the next design stage, a study considering the capacity of chiller was carried out at the Department of Environmental Engineering, CTU in Prague. The objective of this study was to find an optimal
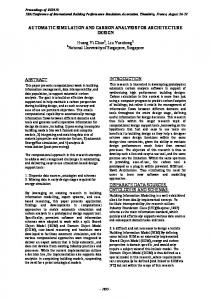
Figure 2:Simplified model of the building
WHOLE BUILDING SIMULATION
The use of thermal storage of concrete ceilings without soffit was anticipated. Computer simulation of the building was carried out in ESP-r software, entered inputs were the detailed building description, internal heat gains and typical weather of a reference year (TRY) for Prague. The model consisted of 7 zones (each floor was one zone + atrium and 5th floor). The complex shape of the building was simplified that way all-basic characteristic important for energy balance (floor area, facades area, window size…) remind the same. The exposed ceilings are made of concrete. The facade is insulated according to the standards and the windows have double glass with external shading. The basic internal gains are 49W/m2 of office area and the common day profile expecting morning, lunchtime and evening reduction of gains is applied. Simulations were Table 1: Selected results of computer simulations and operation alternatives made for 8 operation Max. building Summer cold Cooling alternatives in total. cooling load consumption Temp. Night capacity The differences were in [°C] vent. limit No. Name kW MWh the set value of desired inside temperature (24 1 Always 24 24 NO NO 2 851 100% 1 599 100% or 26 °C), energy saving mode after 2 Always 26 26 NO NO 2 543 89% 1 181 74% working hours, and 6 Limited 24 24 NO 80% 2 319 80% 1 592 100% chiller capacity and Night utilization of night 7 + Limited 24 YES 80% 2 317 80% 1 222 76% ventilation (Tab. 1).
- 741 -
Results Computer simulation showed that with an appropriate control strategy the capacity of cold source for the building could be 20 % lower than in the original project, (which can be considered as a standard dimensioning in common design practice). Adjustment of control system for air temperature of 24 °C is assumed and in case of peak loads the air temperature will raise a maximum of 2 K (Figure 5). The temperature limit of 26 °C will not be exceeded due to the accumulation ability of the building. The pilot project proved the positive influence of night cooling, which will significantly affect the cold consumption, but it has to be verified if this saving won’t be offset by higher electricity consumption of fans. Based on the presented simulation results the designers decide to decrease the capacity of chillers. It leads to significant decreasing of the system costs.
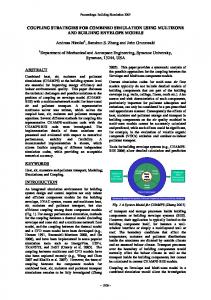
ATRIUM SIMULATION The preliminary design recommended the external adjustable shading for big atrium roofs. During the final design the concept was criticized. The big
The flow pattern in the building is based on the mechanical system supplying conditioned air to the offices and big part of air is extracted via atriums. Therefore relatively high flow rate of conditioned air pass through atrium from each floor and is extracted under the roof (28 m3/s). This was modeled using the flow network. Simulations were made for 4 glazing/shading variants: S1 - glazing g=0.4 + external shading (original) S2 - glazing g=0.4 no shading S3 - glazing g=0.4 + internal blind S4 – selective glazing g=0.3, no shading In view of the previous energetic simulations of the whole building the atrium simulations were done for the variant V1 when the maximum inside office temperature in summer is 24°C Both the variants have been simulated during a period from May 1 to September 15. Two weeks (from July 12 to July 27) have been selected as the extreme period for presentation of the results. Results The result of simulation are the indoor air temperatures and thermal comfort based on air and surface temperatures. The most important are the conditions in the corridor in 5th floor, which is part of the atrium. The number of working hours for Table 2: Number of working hours Variant PMV From To V1_S1 V1_S2 V1_S3 V1_S4 -1 0 1 2
-1 0 1 2 T max
87 1134 407 0 0 26
78 862 463 221 4 28
84 844 442 244 14 30
82 931 470 145 0 28
selected PMV ranges and maximum air temperatures in 5th floor for all variants is presented in the Table 2. Figure 3:The atrium model with shading parts. movable parts of shading covering considerable part of the roof even in the open position and maintenance of large horizontal movable parts are very difficult. Therefore the detailed atrium computer simulation was done to optimize roof glazing (shading) on relation to internal thermal comfort especially in the 5th floor corridors. The same environment ESP-r was used for energy balance of the selected atrium. The model consisted of 5 zones (each floor was one zone) divided by fictive horizontal surface (Figure 3).
Results of the this stage of the energetic balance simulation solutions for the atria glazing in the building have shown that utilization of the glazing „Stopray Safir g=0,4“ may be evaluated as satisfactory. Conclusions The air temperatures and mean radiant temperatures in the corridors on the fifth above-ground floor are rather higher than for the original variant with external shielding, however, in view of that it involves a corridor the temperatures up to 280C may be considered satisfactory.
- 742 -
1000
Chiller - FC
900
Chiller - IT
Chiller - VZT
800 700 600 500 400 300 200 100
Figure 4. Measured electricity consumption profile. The percentage of occupants dissatisfied as a result of draught is an overall indicator of thermal comfort at a working place. When the draft risk (DR) value is below 20 %, the working place is suitable. Average values of the DR measured at particular working places did not exceed 10 %, so the working places are classifiable in A category as fully complying with CSN EN 7730. In the CSOB building, electric meters for all chillers were installed and connected to the control system. Values from sources of cold for central ventilating units, sources for FCUs and partly sources of cold for air conditioning of computer rooms (IT) are used for analyses.
- 743 -
20.8.
19.8.
18.8.
17.8.
16.8.
15.8.
0 14.8.
As described above, this project deals with a very large building, in which the majority of offices, corridors and other rooms are connected to each other without the possibility of being separeted. Individual temperature adjustment is therefore very limited and uniform temperature is anticipated for the whole building. This leads to strict requirements on its optimal value. Temperature in open space offices is measured by a control system with 187 points (1st - 4th Floor). In the experimental phase from May to October 2007, values were measured in 5-minute intervals. The analysis of these measurements shows that temperatures are quite uniform, with the minimum at 22 °C and maximum at 26 °C in most of the rooms for the experimental period. The whole building has a slight vertical temperature gradient, approximately 0,5 K between 1st and 4th Floor. Control and choice of the most suitable mode is based on values of two reference temperature sensors located on the 3rd Floor. Analyses of measured data proved that the sensors were chosen appropriately and that they showed good agreement with the average temperature of the whole building. During the optimization of the control system, based on reactions of occupants an optimal profile of inside air temperature and corresponding adjustment of the regulation strategy was sought. This resulted in a temperature of 23 ± 1 °C in the morning (after the night cooling with fresh air from exterior), during the day the temperature rises gradually, and in the afternoon it is set to 26 ± 0.2 °C. Automatic temperature adjustment according to the outside air temperature based on an/the adaptive model of thermal comfort is being prepared. In the experimental phase the evaluation of thermal comfort was based on the complaints of employees, which were discovered through individual interviews. It was verified that a lot of complaints against thermal comfort and draught are strongly affected by psychological aspects, both objective
13.8.
MEASUREMENTS
(feeling draught in an open space office) and subjective (dissatisfaction with working in an open space office). These psychological aspects are also significantly influenced by the fact that most of the employees were moved into the new building from offices where they had been working for a long time. So, their dissatisfaction with the new environment may have caused the feeling of thermal discomfort. To verify the complaints, a detailed control measurement of thermal comfort was carried out at 8 working places. Values of air temperature, relative humidity and mean radiant temperature were measured. In addition detailed data was gathered of temperature, air flow velocity and turbulence intensity for sitting persons (in compliance with CSN ISO 7730). Measured values of air temperatures in higher levels, i.e. at working places 1 and 2 exceeded the upper limit of 25,3 °C, while at working place 3 they fell under the lower limit of 23,7 °C. At working places 1 and 2 the air temperature exceeded the temperatures required by the control system. Nevertheless the employees evaluated it as absolutely satisfactory. Average air flow velocities from particular measurements varied between 0,1 and 0,2 m/s, at working place 2 they were below the limit of 0,1 m/s, so that conditions at working places comply with Czech statutory order No. 178/2001 Sb., according to No. 523/2002 Sb. and 441/2004 Sb.
Electricity consuption [kWh]
This evaluation is based on the zone energy simulation when the mean value of the entire fifth above-ground floor is treated. Upon the convenient layout of the air-conditioned supply and the fitting of internal shielding features one may expect considerable better conditions in those parts of the fifth above-ground floor in which people will move. Application of the quality selective glazing without any external shielding may be recommended, above all, in a combination with the internal oblique roller blinds above the areas where persons move. Based on the presented simulation results the designers decide to use quality selective gazing without movable external shading for 3 building atrium. It leads to significant decreasing of the building costs.
CONFIRMATION OF SIMULATION BASED DESIGN CHANGES Two major modifications were done in the late design stage based on the computer simulation results. The chiller capacity was decreased and selective glazing was used instead of external movable shading for atrium roofs. In the experimental phase the internal temperature was set to free float between 23 and 26 °C, it is close to operation recomendet in the whole building computer simulation. In the evening the building was cooled with outside air. Night cooling with outside air was operated to maintain the required temperature difference of t = 4 K. During the installation of chillers for FCUs and ventilation, the results of simulations were taken into account, leading to the final cooling capacities being smaller than the original values. According to the results of computer simulation, the cooling capacity needed is 2 780 kW (office areas only). This led to a decrease in capacity of the originally designed cooling system from 5 419 kW to 5 017 kW. Measurements in 2007 confirmed space cooling in only required 65 % of the installed capacity, which sums up to 3 276 kW. The temperature measurements and the thermal comfort investigation approve the environment in the 5th floor of atrium was within acceptable limits even in the summer peak climate. Both design modifications based on the computer simulation results were confirmed by measurements.
CONCLUSION The computer simulations provide valuable information for the building and HVAC system design optimization. Both design modifications, decreasing the capacity of the chiller and using selective glazing instead of external movable shading for atrium roofs, were confirmed during first year monitoring. During the test operation in 2007, verification of ventilation and air conditioning systems as well as optimization of their parameters were carried out. Following the measurements and optimization process, building and system operation modes were defined maintain its integrated performance to comply with the set comfort requirements.. In comparison with the original project, not only were the scheduling of units changed, but also maximal air volumes reduced. Maximal utilization of cooling units in the summer, 2007 period was 65 %. The decision of the investor to decrease the installed cooling capacity against the original project values could be confirmed.
During the whole process, from the first concepts to construction completion and optimization during the test operation, the role of the investor expert consultant proved to be very important. For buildings with ventilation and air conditioning systems, an expert consultant to investors should be considered to maintain the continuity of concepts and knowledge transfer during all stages of the project and the optimization of the building operation.
ACKNOWLEDGEMENT This research was supported by a grant of Czech Ministry of Education no. MSM6840770011.
REFERENCES SN EN ISO 7730, SN EN ISO 7726, Ergonomics of the thermal environment., European standrads, eský normaliza ní institut, 2006 Clarke, J.A. (1985) Energy simulation in building design, Adam Hilger Ltd, Bristol (UK). ,ISBN 085274-797-7. Fanger, P.O.; Fortun, J. (2002) Extension of the PMV model to non-air-conditioned buildings in warm climates, Energy and Buildings 34, p. 533-536, www.elsevier.com Hopfe, C.J.; Struck, C; Harputlugil, G.U.; Hensen, J. (2006) Computational Simulation Tools for Building Services Design- Professional’s Practice and Wishes.. 17. Conference Airconditioning and Ventilation 2006, Prague, pp. 297-302. Lain, M.( 2008): Low-energy Cooling of Buildings [Ph.D. thesis] CTU in Prague, 2008. 176 p. (in Czech). Lain, M. - Ivanova, M. - Zmrhal, V. - Zemli ka, J. (2008): Airconditioning of Extensive Office Building Optimalization In: 18. Konference Klimatizace a v trání 2008. Praha, p. 299-306. ISBN 978-80-02-01978-7. (in Czech). Lain, M.; Drkal. F.; Hensen, J.; Zmrhal, V., (2005), Energy simulations of the building in Prague 5 – I. + II + III., Research report, Department of Environmental Engineering, Mech Eng, Faculty, CTU in Prague. (in Czech).
- 744 -
1NP t
2NP t
3NP t
4NP t
5NP t
Atrium t
Outside
34
Air temperature [°C]
32 30 28 26 24 22 20
12.7
13.7
14.7
15.7
16.7
17.7
18.7
Figure 5. Air temperature profiles in each floor for chosen week and variant No 7.
- 745 -
19.7