Hindawi Publishing Corporation Computational and Mathematical Methods in Medicine Volume 2016, Article ID 3572705, 9 pages http://dx.doi.org/10.1155/2016/3572705
Research Article Cancer Feature Selection and Classification Using a Binary Quantum-Behaved Particle Swarm Optimization and Support Vector Machine Maolong Xi,1 Jun Sun,2 Li Liu,3 Fangyun Fan,2 and Xiaojun Wu2 1
Department of Control Technology, Wuxi Institute of Technology, Wuxi, Jiangsu 214121, China Department of Computer Science, Jiangnan University, Wuxi, Jiangsu 214122, China 3 Affiliated Hospital of Jiangnan University, Wuxi, Jiangsu 214062, China 2
Correspondence should be addressed to Maolong Xi; wx
[email protected] Received 28 January 2016; Accepted 27 July 2016 Academic Editor: Yuhai Zhao Copyright © 2016 Maolong Xi et al. This is an open access article distributed under the Creative Commons Attribution License, which permits unrestricted use, distribution, and reproduction in any medium, provided the original work is properly cited. This paper focuses on the feature gene selection for cancer classification, which employs an optimization algorithm to select a subset of the genes. We propose a binary quantum-behaved particle swarm optimization (BQPSO) for cancer feature gene selection, coupling support vector machine (SVM) for cancer classification. First, the proposed BQPSO algorithm is described, which is a discretized version of original QPSO for binary 0-1 optimization problems. Then, we present the principle and procedure for cancer feature gene selection and cancer classification based on BQPSO and SVM with leave-one-out cross validation (LOOCV). Finally, the BQPSO coupling SVM (BQPSO/SVM), binary PSO coupling SVM (BPSO/SVM), and genetic algorithm coupling SVM (GA/SVM) are tested for feature gene selection and cancer classification on five microarray data sets, namely, Leukemia, Prostate, Colon, Lung, and Lymphoma. The experimental results show that BQPSO/SVM has significant advantages in accuracy, robustness, and the number of feature genes selected compared with the other two algorithms.
1. Introduction Nowadays, cancer has been one of the most common lethal factors for human beings. Missed and mistaken diagnosis sometimes makes people lose the best chance for appropriate treatments. Therefore, more auxiliary measurements are needed to promote the accuracy of cancer diagnosis and clinical test combined with medical ways [1–4]. With the rapid development of information sciences and molecular biological sciences, gene microarray technology brings people large amount of high-throughput gene profiles which are widely used in cancer diagnosis, clinical inspection, and other aspects. However, microarray expression data are highly redundant and noisy, and most genes are uninformative with respect to studied classes, as only a fraction of genes may present distinct profiles for different classes of samples. As such, effective methods of selecting feature genes for cancer are critically necessary. These methods should be able to
robustly identify a subset of informative genes embedded out of a large data set which is contaminated with high dimensional noise. It was Golub et al. who first employed gene expression data for cancer classification [5]. They proposed to use gene expression data of acute leukemia for cancer classification by adopting “SNR” index to calibrate the contribution of genes to the cancer classification and by using a weighted voting mechanism to distinguish cancer types [5]. This study demonstrated that the use of gene expression data to determine cancer types for the auxiliary medical diagnosis is an effective measure. Afterwards, an increasing number of researchers in the fields of biology and information sciences have proposed many effective feature gene selection methods, so that the research in this discipline is becoming one of the hotspots in bioinformatics. Currently, there are two categories of the methods of obtaining feature genes for cancer classification based on gene
2 expression data, namely, feature transformation methods and feature selection methods. By definition, feature transformation refers to a way of transforming the original feature attributes into a new set of features that represent the original features to the greatest extent but reduce the dimension as much as possible in order to achieve the purpose of dimension reduction. This means that the new features are low-dimensional features with similar classification abilities. Feature transformation methods for cancer classification by using gene expression data include principal component analysis (PCA) [6], kernel PCA [7], independent component analysis (ICA) values [8], locally linear embedding (LLE) [9], partial least squares (PLS) [10], the maximum margin criterion (MMC) [11], and linear discriminant analysis (LDA) [12]. Conde et al. [13, 14] proposed a feature transform method based on clustering. This approach uses self-organizing tree algorithm to carry out gene clustering and calculates the average gene expression level for each category, which is then accepted as a new feature to establish the cancer classification model. Kan et al. [15] employed PCA to make transformation of the gene expression data of children small round blue cell tumors and then used artificial neural network for classification. Feature transformation methods can indeed reduce the dimension for gene expression data and can eliminate the “curse of dimensionality” phenomenon due to large number redundant genes so that they can help to establish effective cancer classification models. However, the new features obtained by feature transform property no longer have the original biological meaning; that is, the methods destroy the biological information of the original gene expression data, which makes it impossible to determine the target genes associated with the cancer. For this reason, feature gene selection methods have attracted more attention. The feature gene selection uses an optimization algorithm to select a subset of the genes, which has the most classification information, from the original gene microarray data. The most commonly used feature gene selection methods can be divided in to filter, wrapper, and embedded ones. Filter algorithm is independent of the subsequent learning algorithm but uses some criteria for scoring gene subsets, which measure the contribution of the genes to classification. Such methods generally use SNR [5], 𝑡 test [16], the correlation coefficient [17], mutual information [18], relief [19], information gain [20], or Fisher discrimination [21]. Obviously, filter methods have advantages such as simplicity, fast calculation, and independence of classification algorithms. However, they evaluate a single gene with some criteria but ignore the correlation between genes, which resulted in a large amount of redundant information contained in candidate genes. Different from filter methods, wrapper methods combine gene selection and classification method and use training accuracy of the learning algorithm to assess the subset of features to guide gene selection. Such methods include the sequential random search heuristics [22], random forest method [23], and PKLR [24]. In the cancer feature gene selection, a typical wrapper feature selection method combines support vector machine (SVM) and a recursive feature selection method [25]. In this method, support vector
Computational and Mathematical Methods in Medicine machines are used to classify the data set, then each gene is excluded in turn, and the performance change of the SVM after exclusion of the gene is calculated, and afterwards, the gene with the least absolute value of the association weight is removed from the training set until the training set is empty. The gene sets deleted together in the last step are the optimal subset. Li et al. [26] adopted genetic algorithm (GA) to select feature genes of cancer. Zhang et al. [27] coupled a binary particle swarm optimization (BPSO) and the SVM for classification of Colon data set. Embedded methods are extension of wrapper approaches and undertake feature selection in the process of classifier training, without dividing the data set into a training set and a validation set. Typical embedded algorithms include decision tree [28] and artificial neural networks [29]. In this work, we propose a new method, which couples a binary quantum-behaved particle swarm optimization with SVM approach, to select feature gene subset from cancer microarray data. In order to prove the advantages of BQPSO/SVM, we also implement two other algorithms, BPSO/SVM and GA/SVM. The BPSO and GA used in this work are both the original version. These two algorithms or improved ones were used in this case by other scholars early in [30–32]. All these three approaches are experimentally assessed on five well-known cancer data sets (Leukemia, Colon, Prostate, Lung, and Lymphoma). This paper is structured as follows. In Section 2, we review the BQPSO algorithm, and in Section 3 the SVM technique is described and our BQPSO/SVM method is proposed. In Section 4, the five microarray data sets used in this work are described. Experimental results are presented in Section 5, including biological descriptions of several obtained genes. Finally, the paper is concluded in Section 6.
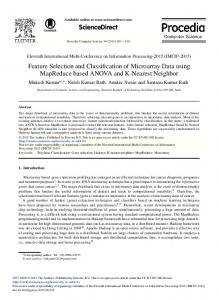
2. Binary Encoded Quantum-Behaved Particle Swarm Optimization (BQPSO) PSO algorithm is a population-based evolutionary search technique, which was firstly proposed in [33]. Social behavior of animals such as bird flocking and fish schooling and swarm theory is the underlying motivation for the development of PSO. Inspired by the quantum theory, Sun et al. [34] developed a novel variant of PSO called Quantum-behaved Particle Swarm Optimization (QPSO), where a strategy based on a quantum 𝛿 potential well is employed to sample around the personal best points and then introduced the mean best position into the algorithm [35–37]. Based on our previous work in [38], in this paper, we further proposed a discrete binary version of QPSO (BQPSO) as a search algorithm coupling SVM for gene selection based on cancer gene expression data. In the proposed BQPSO, the position of the particle is represented as a binary string. For instance, in Figure 1 𝑋1 (1011001010) is the first particle and 𝑋2 (0010010110) is the second one; they all have two substrings (two decision variables), and the distance is defined as the Hamming distance between two binary strings; namely, (1) 𝑋1 − 𝑋2 = 𝑑𝐻 (𝑋1 , 𝑋2 ) ,
Computational and Mathematical Methods in Medicine X1
X11 1
0
1
1
0
0
0
1
X12
0
1
X2
X21 0
0
3
0
1
0
1
0
X22 1
0
1
Figure 1: Binary coding of particle’s position.
where 𝑑𝐻(⋅) is the function to get Hamming distance between 𝑋1 and 𝑋2 , which is the count of bits different in the two strings; the distance is seven in Figure 1. In the BQPSO, the dimension is defined as the number of decision variables, so that a particle can have more than one decision variable. For example, particle 𝑖 is represented as 𝑋𝑖 = (𝑋𝑖1 , 𝑋𝑖2 , . . . , 𝑋𝑖𝐷), and it has 𝐷 decision variables, and 𝑋𝑖𝑑 refers to the 𝑑th substring (𝑑th decision variable) of the position of the 𝑖th particle. Given that the lengths of 𝑋𝑖𝑑 and 𝑋𝑖 are 𝑙𝑑 and 𝑙, respectively, then we can get equation as follows: 𝑑
𝑙 = ∑𝑙𝑑 , 𝑑 = 1, 2, . . . , 𝐷.
(2)
Get mbest(pbest) for 𝑗 = 1 to 𝑙 (the length of binary string) sum = 0; for each particle i sum = sum + pbest[𝑖][𝑗]; endfor avg = sum/𝑀; if avg > 0.5 mbest[𝑗] = 1; endif if avg < 0.5 mbest[𝑗] = 0; endif if avg = 0.5 if rand() < 0.5 mbest[𝑗] = 0; else mbest[𝑗] = 1; endif endif endfor Return mbest Pseudocode 1: Pseudocode for obtaining mbest.
obtained by the mutation of 𝑃𝑖 with the probability computed by 𝑏 { { {𝑙 , 𝑃𝑟 = { 𝑑 { {1, {
𝑖=1
In the BQPSO, the mean best (𝑚𝑏𝑒𝑠𝑡) position of all particles is determined by the states of the bits of all particles’ 𝑝𝑏𝑒𝑠𝑡. In detail, for 𝑗th bit of the 𝑚𝑏𝑒𝑠𝑡, if 1 appears more often than 0 at the 𝑗th bit of all 𝑝𝑏𝑒𝑠𝑡, the 𝑗th bit of 𝑚𝑏𝑒𝑠𝑡 will be 1; otherwise the bit will be 0. However, if 1 and 0 have the same frequency of occurrence, the 𝑗th bit of 𝑚𝑏𝑒𝑠𝑡 will be set randomly to be 1 or 0, with probability 0.5 for either state. The function for obtaining 𝑚𝑏𝑒𝑠𝑡 is called 𝑚𝑏𝑒𝑠𝑡 = Get 𝑚𝑏𝑒𝑠𝑡 (𝑝𝑏𝑒𝑠𝑡). The pseudocode of the function for obtaining 𝑚𝑏𝑒𝑠𝑡 is given in Pseudocode 1. 𝑃𝑖 is the coordinate of local attractor for particle 𝑖. In the continuous version of QPSO, the coordinate 𝑃𝑖𝑑 of 𝑃𝑖 lies between 𝑝𝑏𝑒𝑠𝑡𝑖𝑑 and 𝑔𝑏𝑒𝑠𝑡𝑑 . In the BQPSO, the point 𝑃𝑖 is generated through one-point or multipoint crossover operation of 𝑝𝑏𝑒𝑠𝑡𝑖 and 𝑔𝑏𝑒𝑠𝑡 like that used in genetic algorithm (GA), and this definitely make 𝑃𝑖 lay between 𝑝𝑏𝑒𝑠𝑡𝑖𝑑 and 𝑔𝑏𝑒𝑠𝑡𝑑 as well. The function getting 𝑚𝑏𝑒𝑠𝑡 in BQPSO is called 𝑃𝑖 = Get 𝑃 (𝑝𝑏𝑒𝑠𝑡𝑖 , 𝑔𝑏𝑒𝑠𝑡). Update equation of the particle position in the original QPSO is given by 1 𝑋𝑖𝑑 − 𝑃𝑖𝑑 = 𝛼 𝑚𝑏𝑒𝑠𝑡𝑑 − 𝑋𝑖𝑑 ln ( ) , 𝜇 = rand () . (3) 𝜇 In the BQPSO, (4) can be written again as follows: 𝑑𝐻 (𝑋𝑖𝑑 , 𝑃𝑖𝑑 ) = ⌈𝑏⌉ ,
(4)
where 1 𝑏 = 𝛼 ∗ 𝑑𝐻 (𝑋𝑖𝑑 , 𝑚𝑏𝑒𝑠𝑡𝑑 ) ∗ ln ( ) , 𝜇
(5)
Because 𝑑𝐻(⋅) is Hamming distance, 𝑏 must be an integer, which is the reason for the use of function ⌈⋅⌉. New string 𝑋𝑖 is
𝑏 > 1. 𝑙𝑑
(6)
In [35], here 𝑙𝑑 is the length of substring 𝑋𝑖𝑑 . Function getting 𝑋𝑖𝑑 is denoted as 𝑋𝑖𝑑 = Transf (𝑃𝑖𝑑 , 𝑃𝑟 ). The transformation of Transf (𝑃𝑖𝑑 , 𝑃𝑟 ) is described in Pseudocode 2. The BQPSO can be summarized as Get 𝑚𝑏𝑒𝑠𝑡 (𝑝𝑏𝑒𝑠𝑡), Get 𝑃 (𝑝𝑏𝑒𝑠𝑡𝑖 , 𝑔𝑏𝑒𝑠𝑡), and Transf (𝑃𝑖𝑑 , 𝑃𝑟 ).
3. Gene Selection and Classification by BQPSO/SVM 3.1. The SVM Classifier. Support vector machine proposed in [39] is a technique derived from statistical learning theory. It is widely used to classify points by assigning them to one of two disjoint half spaces [40, 41]. That is to say SVM carries out mainly a 2-class classification. For linearly separable data, SVM gets the hyperplane which maximizes the margin between the training samples and the class boundary. For nonlinearly separable cases, samples are mapped to a high dimensional space. In this space, such a separating hyperplane can be found. The assignment is conducted by way of a mechanism called the kernel function. Theoretically, SVM is able to correctly classify any linearly separable data. Consider the data with two classes, which can be expressed as (𝑥𝑖 , 𝑦𝑖 ) ,
𝜇 = rand () .
if
𝑖 = 1, 2, . . . , 𝑙, 𝑥 ∈ 𝑅𝑛 , 𝑦 ∈ {±1} ,
(7)
and then the hyperplane that separated the two classes of the data is given by (𝑤 ⋅ 𝑥) + 𝑏 = 0.
(8)
4
Computational and Mathematical Methods in Medicine and the optimal classification function is
Transf(𝑃𝑖𝑑 , 𝑃𝑟 ) for each bit in the substring 𝑃𝑖𝑑 ; if rand() < 𝑃𝑟 if the state of the bit is 1 Set its state to 0; else set its sate to 1; endif endif endfor 𝑋𝑖𝑑 = 𝑃𝑖𝑑 ; Return 𝑋𝑖𝑑
𝑓 (𝑥) = sgn {(𝑤∗ ⋅ 𝑥) + 𝑏∗ } (15) } { 𝑙 = sgn {( ∑ 𝑎𝑗∗ 𝑦𝑗 (𝑥𝑗 ⋅ 𝑥𝑖 )) + 𝑏∗ } , 𝑥 ∈ 𝑅𝑛 . } { 𝑗=1
Pseudocode 2: Pseudocode of the transformation.
In order to guarantee that the data can be correctly classified and the distance between the classes is as large as possible, the hyperplane must satisfy 𝑦𝑖 [(𝑤 ⋅ 𝑥𝑖 ) + 𝑏] ≥ 1,
𝑖 = 1, 2, . . . , 𝑙,
(9)
by which the distance is obtained as 2/‖𝑤‖ so that the problem of constructing the hyperplane is converted to the following optimization problem: min 𝜙 (𝑤) =
1 1 ‖𝑤‖2 = (𝑤 ⋅ 𝑤) 2 2
(10)
with (9) being the constraint. By introducing the following Lagrange function to solve problem (10): 𝐿 (𝑤, 𝑏, 𝑎) =
1 ‖𝑤‖ − 𝑎 (𝑦 ((𝑤 ⋅ 𝑥) + 𝑏) − 1) , 2
(11)
where 𝑎 > 0 is known as the Lagrange coefficient. Solving the Lagrangian dual of the problem, one obtains a simplified problem: 𝑙
max
𝑄 (𝑎) = ∑ 𝑎𝑗 − 𝑗=1
1 𝑙 𝑙 ∑ ∑ 𝑎 𝑎 𝑦 𝑦 (𝑥 ⋅ 𝑥 ) 2 𝑖=1 𝑗=1 𝑖 𝑗 𝑖 𝑗 𝑖 𝑗 (12)
𝑙
s.t.
∑ 𝑎𝑗 𝑦𝑗 = 0 𝑗 = 1, 2, . . . , 𝑙, 𝑎𝑗 ≥ 0.
𝑗=1
Solving the problem in (12), we can get
3.2. The Proposed BQPSO/SVM Approach. In many bioinformatics problems the number of features is significantly larger than the number of samples. In order to improve the classification or to help to recognize interesting features in noisy environments, tools for reducing the number of features are indispensable. The hybrid BQPSO/SVM approach proposed in the following contributes especially in this sense. First of all, the data should be preprocessed. Normalization of data must be conducted so as to eliminate the impact of the dimensionless on the classification. Then we need to take traditional 𝑡-test on the data, order the genes by 𝑝 value ascending, and get 50 top-ranked genes from all. Afterwards, most of the noisy data have been removed. These 50 genes comprise the whole search space of the BQPSO algorithm for gene selection. For the BQPSO used in this work, the swarm sizes for the BQPSO and BPSO were set to be 20 and the population size for GA was also 20. Each particle has just one decision variable, and thus the dimension of the particle is just one. The length of the particle is 50, so every particle is a binary string with length of 50, and 1 represents that this gene is chosen and 0 is not. Feature gene selection and cancer classification based on hybrid BQPSO/SVM algorithm can be described as the procedure in Pseudocode 3. 3.3. Evaluation Function. Since a particle 𝑋𝑖 is a binary string representing a gene subset in BQPSO/SVM, the evaluation of each particle is executed by the SVM classifier to assess the quality of the represented gene subset. The fitness of a particle 𝑋𝑖 is calculated employing a leave-one-out cross validation (LOOCV) method to calculate the accuracy of SVM trained with this subset. In leave-one-out cross validation, one of all samples is evaluated as test data while the others except this one are used as training data, repeated until all samples have been used as test data. The classification accuracy of LOOCV is the average accuracy of 𝑛 times classifying, if the data set has 𝑛 samples. The evaluation function is described in
𝑇
𝑎∗ = (𝑎1∗ , 𝑎2∗ , . . . , 𝑎𝑙∗ ) , ∗
𝑤 =
fitness (𝑋𝑖 ) = 𝛼 ∗ accuracy + 𝛽 ∗
𝑙
∑ 𝑎𝑗∗ 𝑦𝑗 𝑥𝑗 , 𝑗=1
(13)
𝑙
𝑏∗ = 𝑦𝑖 − ∑ 𝑦𝑗 𝑎𝑗∗ (𝑥𝑗 ⋅ 𝑥𝑖 ) , 𝑗 ∈ {𝑗 | 𝑎𝑗∗ ≻ 0} , 𝑗=1
by which the hyperplane is obtained as (𝑤∗ ⋅ 𝑥) + 𝑏∗ = 0
(14)
50 , feature number
(16)
where 𝛼 and 𝛽 are weight values and set to 0.6 and 0.4, respectively, for the purpose of controlling that the accuracy value takes precedence over the subset size, since high accuracy is preferred when leading the search process. The target here consists of maximizing the accuracy and minimizing the number of genes (feature number). For convenience (only maximum of fitness), the second factor is presented as 50/feature number.
Computational and Mathematical Methods in Medicine
5
Processing of data set; Initialize the current positions and the pbest positions of all particles which are binary bits with each representing whether the corresponding gene is selected or not; do Determine the mean best position among the particles by mbest = Get mbest(pbest), select a suitable value for 𝛽; for 𝑖 = 1 to population size 𝑀 Call the LIBSVM tool box to construct the SVM classifier and get the classification accuracy for the data; With the classification accuracy and the number of selected genes (i.e. the number of features given by the number of bits with value 1), evaluate the objective function value 𝑓(𝑋𝑖 ) according to Section 3.3; Update 𝑃𝑖 , and 𝑃𝑔 , it means if 𝑓(𝑋𝑖 ) < 𝑓(𝑃𝑖 ) then 𝑃𝑖 = 𝑋𝑖 ; and 𝑃𝑔 = arg min𝑃𝑖 𝑓(𝑃𝑖 ), 1 ≤ 𝑖 ≤ 𝑀; then get a stochastic position by 𝑝𝑖 = Get P (𝑝𝑏𝑒𝑠𝑡𝑖 , 𝑔best) for 𝑗 = 1 to dimensionality 𝑁 Compute the mutation probability 𝑃𝑟 ; Generate the new substring 𝑋𝑖𝑑 by 𝑋𝑖𝑑 = Transf(𝑃𝑖𝑑 , 𝑃𝑟 ); and get the new position 𝑋𝑖 by combining all new substring 𝑋𝑖𝑑 (𝑑 = 1, 2, . . . , 𝐷) endfor endfor until termination criterion is met; Output the best solution which have been found (𝑔best) Pseudocode 3: The psudocode the BPSO/SVM.
4. The Data Sets
Table 1: Description for the test databases.
There are several DNA microarray data sets from published cancer gene expression studies. Five of them were used in this paper. They are Leukemia data set, Prostate data set, Colon data set, Lung data set, and Lymphoma data set. All of them were taken from the BRB-ArrayTools in [42] with URL http://linus.nci.nih.gov/∼brb/DataArchive New.html. More details of these five data sets are showed in Tables 1 and 2. The value in parenthesis in Table 3 is the number of examples of class 1 or class 2 involved in that data set.
Number Name of data set 1 Leukemia 2 Prostate 3 Colon 4 Lung 5 Lymphoma
5. Experimental Results and Performance Comparison
Number Name of data set
BQPSO/SVM approach was implemented on MATLAB, along with BPSO/SVM and GA/SVM. The SVM classifier used in these three approaches is based on the LIBSVM library in [43]. For the SVM configuration, since we were considering the performance of the search algorithm in the work, rather than the influence of parameters in SVM to classification, we used the default parameters of LIBSVM. And the default kernel function was configured as radial basis function. The fitness function in this work is the classification accuracy of leave-one-out cross validation (LOOCV). All experiments were carried out using a PC with Windows OS and a Pentium Dual-Core 2.60 GHz CPU, with 2 G of RAM. BQPSO/SVM, BPSO/SVM, and GA/SVM algorithms on five cancer related microarray data sets were independent executed 25 times over each data set, in order to have statistically meaningful conclusions as these three algorithms are stochastic search methods.
Number of examples
Number of genes
Classes
72 102 62 181 77
7129 12600 2000 12533 7129
2 2 2 2 2
Table 2: Description for the test databases.
1 2 3 4 5
Leukemia Prostate Colon Lung Lymphoma
Class 1 (quantity)
Class 2 (quantity)
AML (25) N1 (50) N3 (22) MPM5 (31) DLBCL7 (58)
ALL (47) PC2 (52) CC4 (40) ADCA6 (150) FL8 (19)
1: normal, 2: prostate cancer, 3: normal, 4: colon cancer, 5: malignant pleural mesothelioma, 6: adenocarcinoma, 7: diffuse large B-cell lymphoma, and 8: follicular lymphoma.
5.1. Parameter Settings. The parameters used in BQPSO, BPSO, and GA algorithms are shown in Table 3. These parameters were selected after several test evaluations of each algorithm and data set instance until reaching the best configuration in terms of the overall quality of solutions. 5.2. Discussion and Analysis. Depending on the results of the experiments, we made analysis of results focusing on
6
Computational and Mathematical Methods in Medicine 30
BQPSO
25
Swarm size Iteration Dimension of particle 𝛽
20 100 1 1 BPSO
Swarm size Iteration Maximum of velocity (𝑤, 𝑐1, 𝑐2)
20 100 6 (0.5, 2, 2)
Number of genes
Table 3: BQPSO, BPSO, and GA parameters for gene subset selection and classification.
20 15 10 5
GA Swarm size Iteration Probability of crossover Probability of mutation
20 100 0.9 0.04
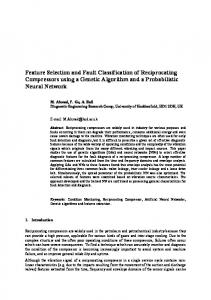
the performance and robustness, as well as the quality of the obtained solutions providing a biological description of most significant ones. We conducted the experiments for BPSO/SVM and GA/SVM in order to demonstrate the advantage of the proposed BQPSO/SVM without any other factors affecting, since in our work all these three algorithms are operated in exactly the same hardware and software environment and with the same data sets and parameters. 5.2.1. Performance Analysis. Next, we compare BQPSO/SVM with BPSO/SVM and GA/SVM. Since these three algorithms are running in the same environment, parameters, and data sets, the results are absolutely comparable. Table 4 lists the highest LOOCV accuracy in 25 independent executions of each method for each data set. The mean columns contain the average of the LOOCV accuracy obtained from 25 independent executions. The performance comparison shows that, compared to BPSO/SVM and GA/SVM, BQPSO/SVM has an obvious advantage. In terms of the correct rate, the search capability of BQPSO/SVM is stronger than the other two competitors. The purpose of feature selection in our work is to find small subsets with high classification accuracy. In Figure 2, the number of genes is the mean size of subsets from 25 executions. Obviously, the proposed BQPSO/SVM provided smaller subsets of genes than the other two methods. 5.2.2. Algorithm Robustness. Besides the quality of the algorithm, its ability to generate similar or identical results when executed several times is also important. One of the most important norms in assessing any proposed algorithm is robustness. It is particularly important for metaheuristics which are employed in this work. The standard deviation (std. dev.) in Table 5 denotes the standard deviation of accuracy from 25 independent executions. As it can be seen from the standard deviation, the robustness of the proposed algorithm is significantly better than GA/SVM. Compared
0
Leukemia
Prostate
Colon
Lung
Lymphoma
Datasets BQPSO/SVM BPSO/SVM GA/SVM
Figure 2: The average number of genes selected by BQPSO/SVM, BPSO/SVM, and GA/SVM, respectively.
with BPSO/SVM, our proposed algorithm obtained smaller standard deviation with Prostate data set and Colon data set but found much better solutions which led to a larger standard deviation. Overall, from Table 5, it is shown that BQPSO/SVM has an obvious advantage over the other two approaches in terms of robustness. 5.2.3. Brief Biological Analysis of Selected Genes. Finally, the best subsets of genes were found for each data set. We add up all subsets having the highest accuracy and list the selected genes. For Colon data set, the top 5 genes with the highest selection frequency of each microarray data are presented in Table 6. (i) Among the genes listed in Table 5, two of them were also selected by [44]. The first gene is uroguanylin precursor Z50753. It was shown that a reduction of uroguanylin might be an indication of colon tumors in [45, 46] which reported that treatment with uroguanylin has a positive therapeutic significance to the reduction in precancerous colon ploys. (ii) The second selected gene of colon data set is R87126 (myosin heavy chain, nonmuscle). The isoform B of R87126 serves as a tumor suppressor and is well known as a component of the cytoskeletal network [47].
6. Conclusion In this paper, a hybrid technique for gene selection and classification of high dimensional DNA Microarray data was presented and compared. This technique is based on a metaheuristic algorithm BQPSO used for feature selection
Computational and Mathematical Methods in Medicine
7
Table 4: Comparison of accuracy with the proposed algorithm, BPSO/SVM, and GA/SVM. BQPSO/SVM
Data set
Best 100 100 93.55 100 100
Leukemia Prostate Colon Lung Lymphoma
BPSO/SVM Mean 100 99.25 92.52 99.96 99.79
Best 100 99.02 91.94 100 100
GA/SVM Mean 100 99.02 91.94 99.96 99.74
Best 100 98.04 91.94 100 98.70
Mean 99.61 96.00 88.65 99.87 98.18
Table 5: Comparison in terms of statistical results of BQPSO/SVM, BPSO/SVM, and GA/SVM. Data set Leukemia Prostate Colon Lung Lymphoma
Best 100 100 93.55 100 100
BQPSO/SVM Std. dev. 0 0.43 0.79 0.15 0.49
Best 100 99.02 91.94 100 100
BPSO/SVM Std. dev. 0 0 0 0.15 0.53
GA/SVM Best 100 98.04 91.94 100 98.70
Std. dev. 0.64 1.20 1.89 0.24 0.75
Table 6: Top 5 genes with the highest selection frequency of colon data set. Data set
Colon
Accession number Z50753 R87126 X63629 M76378 X53586
using the SVM classifier to identify potentially good gene subsets and is compared with the BPSO and GA. In addition, genes selected are validated by an accurate leave-one-out cross validation method to improve the actual classification. All three approaches were experimentally assessed on five well-known cancer data sets. Results of 100% classification rate and less than average 11 genes are obtained in most of our executions. The use of preprocessing method has shown a great influence on the performance of proposed algorithm, since it introduces an early set of acceptable solutions in their evolution process. Continuing the line of this work, we are interested in optimization of BQPSO/SVM in order to discover new and better subsets of genes using specific Microarray data sets.
Competing Interests The authors declare that they have no financial and personal relationships with other people or organizations that can inappropriately influence their work; there is no professional or other personal interest of any nature or kind in any product, service, and/or company that could be construed as influencing the position presented in, or the review of, this paper.
Acknowledgments The research work was supported by the National Natural Science Foundation of China (Projects nos. 61373055
Gene description H. sapiens mRNA for GCAP-II/uroguanylin precursor Myosin heavy chain, nonmuscle (Gallus gallus) H. sapiens mRNA for p cadherin Human cysteine-rich protein (CRP) gene, exons 5 and 6 Human mRNA for integrin alpha 6
and 61300150), Natural Science Foundation for College and Universities in Jiangsu Province (Project no. 16KJB520051), and the Qing Lan Project of Jiangsu and Wuxi Institute of Technology.
References [1] A. C. Pease, D. Solas, E. J. Sullivan, M. T. Cronin, C. P. Holmes, and S. P. A. Fodor, “Light-generated oligonucleotide arrays for rapid DNA sequence analysis,” Proceedings of the National Academy of Sciences of the United States of America, vol. 91, no. 11, pp. 5022–5026, 1994. [2] Y. Zhao, G. Wang, X. Zhang, J. X. Yu, and Z. Wang, “Learning phenotype structure using sequence model,” IEEE Transactions on Knowledge and Data Engineering, vol. 26, no. 3, pp. 667–681, 2014. [3] Y. Zhao, G. Wang, Y. Li, and Z. Wang, “Finding novel diagnostic gene patterns based on interesting non-redundant contrast sequence rules,” in Proceedings of the 11th IEEE International Conference on Data Mining (ICDM ’11), pp. 972–981, IEEE, Vancouver, Canada, December 2011. [4] Y. Zhao, J. X. Yu, G. Wang, L. Chen, B. Wang, and G. Yu, “Maximal subspace co-regulated gene clustering,” IEEE Transactions on Knowledge and Data Engineering, vol. 20, no. 1, pp. 83–98, 2008. [5] T. R. Golub, D. K. Slonim, P. Tamayo et al., “Molecular classification of cancer: class discovery and class prediction by gene expression monitoring,” Science, vol. 286, no. 5439, pp. 531–537, 1999.
8 [6] H. Abdi and L. J. Williams, “Principal component analysis,” Wiley Interdisciplinary Reviews: Computational Statistics, vol. 2, no. 4, pp. 433–459, 2010. [7] Z. Liu, D. Chen, and H. Bensmail, “Gene expression data classification with kernel principal component analysis,” Journal of Biomedicine and Biotechnology, vol. 2005, no. 2, pp. 155–159, 2005. [8] C.-H. Zheng, D.-S. Huang, X.-Z. Kong, and X.-M. Zhao, “Gene expression data classification using consensus independent component analysis,” Genomics, Proteomics and Bioinformatics, vol. 6, no. 2, pp. 74–82, 2008. [9] S. Chao and C. Lihui, “Feature dimension reduction for microarray data analysis using locally linear embedding,” in Proceedings of the 3rd Asia-Pacific Bioinformatics Conference, Singapore, January 2005. [10] D. V. Nguyen and D. M. Rocke, “Tumor classification by partial least squares using microarray gene expression data,” Bioinformatics, vol. 18, no. 1, pp. 39–50, 2002. [11] S. Zhang and R. Jing, “Dimension reduction based on modified maximum margin criterion for tumor classification,” in Proceedings of the 4th International Conference on Information and Computing (ICIC ’11), pp. 552–554, Phuket Island, China, April 2011. [12] Y. Guo, T. Hastie, and R. Tibshirani, “Regularized linear discriminant analysis and its application in microarrays,” Biostatistics, vol. 8, no. 1, pp. 86–100, 2007. [13] L. Conde, A. Mateos, J. Herrero, and J. Dopazo, “Unsupervised reduction of the dimensionality followed by supervised learning with a perceptron improves the classification of conditions in DNA microarray gene expression data,” in Proceedings of the 12th IEEE Workshop on Neural Networks for Signal Processing (NNSP ’02), pp. 77–86, Martigny, Switzerland, 2002. [14] A. Mateos, J. Herrero, J. Tamames et al., “Supervised neural networks for clustering conditions in DNA array data after reducing noise by clustering gene expression profiles,” in Methods of Microarray Data Analysis II, pp. 91–103, Springer, Berlin, Germany, 2002. [15] T. Kan, Y. Shimada, F. Sato et al., “Gene expression profiling in human esophageal cancers using cDNA microarray,” Biochemical and Biophysical Research Communications, vol. 286, no. 4, pp. 792–801, 2001. [16] P. Jafari and F. Azuaje, “An assessment of recently published gene expression data analyses: reporting experimental design and statistical factors,” BMC Medical Informatics and Decision Making, vol. 6, no. 1, article 27, 2006. [17] M. A. Hall, Correlation-Based Feature Selection for Machine Learning, The University of Waikato, Hamilton, New Zealand, 1999. [18] Y. Wang, I. V. Tetko, M. A. Hall et al., “Gene selection from microarray data for cancer classification—a machine learning approach,” Computational Biology and Chemistry, vol. 29, no. 1, pp. 37–46, 2005. [19] J. Zhang, S. Liu, and Y. Wang, “Gene association study with SVM, MLP and cross-validation for the diagnosis of diseases,” Progress in Natural Science, vol. 18, no. 6, pp. 741–750, 2008. [20] Y.-X. Li, Q.-J. Liu, and X.-G. Ruan, “A method for extracting knowledge from tumor gene expression data,” Acta Electronica Sinica, vol. 32, no. 9, pp. 1479–1482, 2004. [21] Y. Lai, B. Wu, L. Chen, and H. Zhao, “A statistical metho for identifying differential gene-gene co-expression patterns,” Bioinformatics, vol. 20, no. 17, pp. 3146–3155, 2004.
Computational and Mathematical Methods in Medicine [22] I. Guyon and A. Elisseeff, “An introduction to variable and feature selection,” The Journal of Machine Learning Research, vol. 3, no. 11, pp. 57–82, 2003. [23] R. D´ıaz-Uriarte and S. A. de Andr´es, “Gene selection and classification of microarray data using random forest,” BMC Bioinformatics, vol. 7, no. 1, article 3, 2006. [24] J. Zhu and T. Hastie, “Classification of gene microarrays by penalized logistic regression,” Biostatistics, vol. 5, no. 3, pp. 427– 443, 2004. [25] I. Guyon, J. Weston, S. Barnhill, and V. Vapnik, “Gene selection for cancer classification using support vector machines,” Machine Learning, vol. 46, no. 1–3, pp. 389–422, 2002. [26] L. Li, T. A. Darden, C. R. Weinberg, A. J. Levine, and L. G. Pedersen, “Gene assessment and sample classification for gene expression data using a genetic algorithm/k-nearest neighbor method,” Combinatorial Chemistry and High Throughput Screening, vol. 4, no. 8, pp. 727–739, 2001. [27] H. Zhang, X. Song, and H. Wang, “Feature gene selection based on binary particle swarm optimization and support vector machine,” Computers and Applied Chemistry, vol. 24, no. 9, pp. 1159–1162, 2007. [28] L.-Y. Du, “Analysis of decision tree algorithm based on data mining,” Journal of Jilin Institute of Architecture & Civil Engineering, no. 5, pp. 48–50, 2014. [29] B. Liu, Q. Cui, T. Jiang, and S. Ma, “A combinational feature selection and ensemble neural network method for classification of gene expression data,” BMC Bioinformatics, vol. 5, article 136, 2004. [30] H. Liu and H. Motoda, Feature Extraction, Construction and Selection: A Data Mining Perspective, Springer, New York, NY, USA, 1998. [31] E. Alba, J. Garc´ıa-Nieto, L. Jourdan, and E.-G. Talbi, “Gene selection in cancer classification using PSO/SVM and GA/SVM hybrid algorithms,” in Proceedings of the IEEE Congress on Evolutionary Computation (CEC ’07), pp. 284–290, IEEE, Singapore, September 2007. [32] E. B. Huerta, B. Duval, and J.-K. Hao, “A hybrid GA/SVM approach for gene selection and classification of microarray data,” in Applications of Evolutionary Computing, vol. 3907 of Lecture Notes in Computer Science, pp. 34–44, Springer, Berlin, Germany, 2006. [33] J. Kennedy and R. Eberhart, “Particle swarm optimization,” in Proceedings of the 1995 IEEE International Conference on Neural Networks, pp. 1942–1948, December 1995. [34] J. Sun, B. Feng, and W. Xu, “Particle swarm optimization with particles having quantum behavior,” in Proceedings of the Congress on Evolutionary Computation (CEC ’04), pp. 325–331, June 2004. [35] J. Sun, W. Xu, and B. Feng, “A global search strategy of Quantum-behaved Particle Swarm Optimization,” in Proceedings of the IEEE Conference on Cybernetics and Intelligent Systems, vol. 1, pp. 111–116, Singapore, December 2004. [36] J. Sun, W. Fang, X. Wu, V. Palade, and W. Xu, “Quantumbehaved particle swarm optimization: analysis of individual particle behavior and parameter selection,” Evolutionary Computation, vol. 20, no. 3, pp. 349–393, 2012. [37] J. Sun, X. Wu, V. Palade, W. Fang, C.-H. Lai, and W. Xu, “Convergence analysis and improvements of quantum-behaved particle swarm optimization,” Information Sciences, vol. 193, pp. 81–103, 2012.
Computational and Mathematical Methods in Medicine [38] M. L. Xi, J. Sun, and Y. Wu, “Quantum-behaved particle swarm optimization with binary encoding,” Control and Decision, vol. 25, no. 1, pp. 99–104, 2010. [39] C. Cortes and V. Vapnik, “Support-vector networks,” Machine Learning, vol. 20, no. 3, pp. 273–297, 1995. [40] B. Gu, V. S. Sheng, Z. Wang, D. Ho, S. Osman, and S. Li, “Incremental learning for ]-Support Vector Regression,” Neural Networks, vol. 67, pp. 140–150, 2015. [41] B. Gu and V. S. Sheng, “A robust regularization path algorithm for ]-support vector classification,” IEEE Transactions on Neural Networks and Learning Systems, 2016. [42] B. Efron, T. Hastie, I. Johnstone, and R. Tibshirani, “Least angle regression,” The Annals of Statistics, vol. 32, no. 2, pp. 407–499, 2004. [43] C.-C. Chang and C.-J. Lin, “LIBSVM: a Library for support vector machines,” ACM Transactions on Intelligent Systems and Technology (TIST), vol. 2, no. 3, article 27, 2011. [44] A.-J. Yang and X.-Y. Song, “Bayesian variable selection for disease classification using gene expression data,” Bioinformatics, vol. 26, no. 2, pp. 215–222, 2010. [45] D. A. Notterman, U. Alon, A. J. Sierk, and A. J. Levine, “Transcriptional gene expression profiles of colorectal adenoma, adenocarcinoma, and normal tissue examined by oligonucleotide arrays,” Cancer Research, vol. 61, no. 7, pp. 3124–3130, 2001. [46] K. Shailubhai, H. H. Yu, K. Karunanandaa et al., “Uroguanylin treatment suppresses polyp formation in the Apc(Min/+) mouse and induces apoptosis in human colon adenocarcinoma cells via cyclic GMP,” Cancer Research, vol. 60, no. 18, pp. 5151– 5157, 2000. [47] J. W. P. Yam, K. W. Chan, and W.-L. W. Hsiao, “Suppression of the tumorigenicity of mutant p53-transformed rat embryo fibroblasts through expression of a newly cloned rat nonmuscle myosin heavy chain-B,” Oncogene, vol. 20, no. 1, pp. 58–68, 2001.
9
MEDIATORS of
INFLAMMATION
The Scientific World Journal Hindawi Publishing Corporation http://www.hindawi.com
Volume 2014
Gastroenterology Research and Practice Hindawi Publishing Corporation http://www.hindawi.com
Volume 2014
Journal of
Hindawi Publishing Corporation http://www.hindawi.com
Diabetes Research Volume 2014
Hindawi Publishing Corporation http://www.hindawi.com
Volume 2014
Hindawi Publishing Corporation http://www.hindawi.com
Volume 2014
International Journal of
Journal of
Endocrinology
Immunology Research Hindawi Publishing Corporation http://www.hindawi.com
Disease Markers
Hindawi Publishing Corporation http://www.hindawi.com
Volume 2014
Volume 2014
Submit your manuscripts at http://www.hindawi.com BioMed Research International
PPAR Research Hindawi Publishing Corporation http://www.hindawi.com
Hindawi Publishing Corporation http://www.hindawi.com
Volume 2014
Volume 2014
Journal of
Obesity
Journal of
Ophthalmology Hindawi Publishing Corporation http://www.hindawi.com
Volume 2014
Evidence-Based Complementary and Alternative Medicine
Stem Cells International Hindawi Publishing Corporation http://www.hindawi.com
Volume 2014
Hindawi Publishing Corporation http://www.hindawi.com
Volume 2014
Journal of
Oncology Hindawi Publishing Corporation http://www.hindawi.com
Volume 2014
Hindawi Publishing Corporation http://www.hindawi.com
Volume 2014
Parkinson’s Disease
Computational and Mathematical Methods in Medicine Hindawi Publishing Corporation http://www.hindawi.com
Volume 2014
AIDS
Behavioural Neurology Hindawi Publishing Corporation http://www.hindawi.com
Research and Treatment Volume 2014
Hindawi Publishing Corporation http://www.hindawi.com
Volume 2014
Hindawi Publishing Corporation http://www.hindawi.com
Volume 2014
Oxidative Medicine and Cellular Longevity Hindawi Publishing Corporation http://www.hindawi.com
Volume 2014