Plant Ecology 170: 15–27, 2004. © 2004 Kluwer Academic Publishers. Printed in the Netherlands.
15
Causes of spatial patterns of dead trees in forest fragments in Illinois Y. Lin*, Melissa L. Hulting and Carol K. Augspurger Department of Plant Biology, University of Illinois, Urbana, IL 61801, USA; *Author for correspondence (phone: 217-333-1298; fax: 217-244-7246; e-mail:
[email protected]) Received 11 June 2001; accepted in revised form 27 July 2003
Key words: Domino effects, Edge effects, Forest fragmentation, Mortality rate, Tree mortality, Windstorms
Abstract Natural disturbances introduce spatial heterogeneity into forests by causing non-random mortality of trees. We examined whether wind was the primary cause of spatial patterns of dead trees at fragment- and individual treelevels in three fragments of temperate deciduous forests in Illinois, USA. Dead trees and wind-caused types of mortality were expected to be higher at forest edges, on windward aspects, in poorly-drained soils, and adjacent to existing canopy gaps. The extent of wind-related mortality was determined by comparing spatial and temporal patterns of dead trees, as well as characteristics of trees downed by single windstorms versus all dead trees. At the fragment-level, we used randomly located quadrats of 25 ⫻ 25 m to sample edge and interior areas of Trelease Woods, Brownfield Woods, and Hart Woods in 1995-1996 and again in 1999-2000. We noted type of mortality 共standing dead, snapped-off, or uprooted trees兲, and measured DBH 共 ⱖ 10 cm兲 and direction of fall of each dead tree. The same measures were made for trees felled by two single storms in 1994. At the individual treelevel, domino effects were evaluated by comparing openness surrounding target treefalls vs. an equal sample size of living trees. The study provided limited evidence that wind caused spatial patterns of dead trees. Instead, spatial patterns of dead trees in the fragments accumulated from domino effects at the individual tree-level in two of the three fragments. Dead trees were more associated with preexisting gaps. Contrary to our predictions at the fragment-level, the frequency of dead trees was not greater at edges, on windward aspects, or in poorly drained soils. This study demonstrated the complexity of spatial patterns of dead trees in forest fragments. The significant domino effects indicated that the occurrence of dead trees was not random, but determined by previous disturbances.
Introduction Natural disturbances introduce spatial heterogeneity into forests by causing non-random mortality of trees 共Harmon et al. 1986; Everham and Brokaw 1996兲. Over time, the spatial patterns of dead trees that accumulated from multiple disturbances reflect to some extent the spatial heterogeneity of disturbances 共Muller and Liu 1991; Rebertus et al. 1997兲. The linkage between spatial patterns of dead trees and disturbances should be especially strong if a forest ecosystem is dominated by a single type of disturbance 共Rebertus et al. 1997兲. In such a forest, spatial
patterns of dead trees may be caused largely by the spatial heterogeneity of the primary disturbance agent. Windstorms may be the main cause of spatial patterns of dead trees in deciduous forests in the U.S.A., where small-scale disturbances, caused by the death of a single or multiple trees, are dominant 共Runkle 1985; Runkle 1990; Oliver and Larson 1996兲. Windstorms, disease, lightning, and senescence have been attributed as disturbance agents in these forests 共Runkle 1985; McCune et al. 1988兲. The role of windstorms may be particularly important in forest fragments of deciduous forests. Fragmentation in-
16 duces complex wind profiles near forest edges and increases turbulence and wind speed 共McNaughton 1989; Kruijt et al. 1995兲. As a result, wind may cause a relatively high proportion of tree mortality in a forest fragment, thus determining its spatial patterns of dead trees. Identifying spatial patterns of wind mortality is difficult, because such mortality results from complex interactions between wind characteristics and various biotic and abiotic factors 共Everham and Brokaw 1996; Ruel 2000; Kramer et al. 2001兲. Furthermore, windstorms operate at multiple spatial and temporal scales 共Attiwill 1994; Ulanova 2000兲. As a result, spatial patterns of tree mortality caused by wind are difficult to characterize and predict without taking into consideration multiple factors and scales. Studies of episodic storms provide a direct link between wind and tree death. Their contribution to overall spatial patterns of dead trees can be evaluated by comparing tree mortality caused by independent windstorms versus overall patterns 共Rebertus et al. 1997兲. If windstorms are primarily responsible for spatial patterns, the overall patterns represent an accumulation from multiple episodic storms. Similar patterns are expected from single storms and overall, especially if winds come from a prevailing direction. Spatial patterns of dead trees cannot be divorced from temporal patterns of tree mortality, which are also complex. Multiple censuses in permanent plots document overall rates of tree mortality 共Sheil and May 1996; Laurance et al. 1998兲, but they do not evaluate the relative importance of episodic disturbances, unless annual censuses occur over a long time. The influence of episodic storms can be estimated by comparing the magnitude of tree mortality caused by single windstorms versus annual mortality rates arising from multiple causes. Given this spatial and temporal complexity of wind damage, studies must simultaneously appraise tree mortality at multiple levels of space and time 共Ruel 2000兲. In this study of forest fragments, we took an integrated approach to determine whether wind causes spatial patterns of dead trees at both fragmentand individual tree-levels. We also compared mortality overall vs. from episodic windstorms. Spatial patterns of wind-caused mortality at the fragment-level may arise because complex wind patterns are generated as wind interacts with topography, trees in different soil types, and forest fragment edges. For example, wind damage is greater on windward slopes 共Everham and Brokaw 1996; Kramer et al.
2001兲 and in moist soils where root support is weaker 共Brokaw 1985; Mayer 1989兲. The evidence for greater wind damage at forest fragment edges is mixed. Some studies show greater mortality 共Bierregaard et al. 1992; Laurance et al. 1998兲 and density of dead trees 共Williams-Linera 1990兲 at forest edges. Other studies document that tree fall density 共Laurance 1997兲 and canopy cover 共Turton and Freiburger 1997兲 are not greater near edges. Confounding factors, such as topography 共Laurance 1997兲 and history of the fragments 共Murcia 1995兲, may be responsible for these inconsistent findings. Spatial patterns of wind-caused mortality at the individual tree-level may be generated because wind interacts with existing gaps. The combination of increased wind turbulence in existing gaps and the greater exposure of trees to wind may result in a higher mortality rate of border trees, thus generating ‘domino’ effects 共Spurgel 1976; Foster and Reiners 1986兲. They cause non-random patterns of tree death, and are influenced by the distribution of existing gaps 共Hubbell and Foster 1986; Tanaka and Nakashizuka 1997兲. Ultimately, they may be a consequence of the forest’s disturbance history 共Everham and Brokaw 1996兲. The study’s objective was to determine whether wind is the primary cause of spatial patterns of dead trees in three fragments of temperate deciduous forest. Spatial patterns of dead trees and their type of mortality were expected to reflect wind heterogeneity generated as wind interacts with forest edge and aspect, soil drainage, and existing canopy gaps. The spatial patterns of dead trees were examined separately at fragment- and individual tree-levels. Fragment-level predictions were: 1兲 More dead trees and wind-related damage 共snapped-off and uprooted trees兲 occur at forest edges, especially on windward aspects, because trees have greater exposure to strong winds at edges than in the forest interior 共Bierregaard et al. 1992; Laurance et al. 1998兲, and 2兲 More uprooted trees occur in poorly-drained soils because trees with weak root support are more vulnerable to wind 共Brokaw 1985; Mayer 1989兲. The individual tree-level prediction was that domino effects occur, i.e., trees are more likely to fall adjacent to existing gaps than is a random tree in a forest. This phenomenon results in a more open area surrounding a recent dead tree than a living tree. Domino effects occur because asymmetric crowns of trees adjacent to gaps and their greater exposure to complex winds make them vulnerable to windthrow
17 Table 1. Description of forest type, stand characteristics, fragment size, soil types, topography, and land-use history of the three study sites.
a
Forest type Fragment size Three most dominant speciesb
Basal area 共m2 / ha兲 Density 共stems / ha兲 Canopy Height c 共m兲 Major soil types d Drainage classesd
Maximum topographic relief 共m兲 Land-use history
Trelease Woods
Brownfield Woods
Hart Woods
Mesic upland forest 24 ha Sugar maple 共55.7兲e Hackberry 共22.3兲 Slippery elm 共19.3兲 28.1e 579 e 25–30 Drummer silt clay loam 共M兲 Flanagan silt loam 共M兲 Poorly drained Somewhat poorly drained Moderately well drained
Mesic upland forest 24 ha Sugar maple 共100.0兲 f Red oak 共21.6兲 Ohio buckeye 共14.1兲 33.7 f 422 f 25–30 Xenia silt loam 共AL兲 Russell silt loam 共AL兲 Poorly drained Somewhat poorly drained Moderately well drained Well drained 9 Selective logging, minor road, grazing, public use until 1935 f,
Dry-mesic upland forest 14 ha White oak 共98.1兲 h Black oak 共57.4兲 Slippery elm 共11.9兲 N/A N/A 20-25 Martinsville silt loam 共AL兲 Ambraw silty clay loam 共M兲 Poorly drained Somewhat poorly drained Moderately well drained Well drained 9 Heavily logged between i 1867-1876
6 Never clear-cut, little grazing or public usec
g
a Iverson et al. 1989; bNumber in parentheses ⫽ importance value based on relative density and relative dominance; cS. Buck, personal communication; dAll soil data are from Mount 共1982兲共AL: Alfisol, M: Mollisol兲; ePelz and Rolfe 共1977兲, DBH ⱖ 6.6 cm; fEdgington 1991, DBH ⱖ 6.4 cm; gLeffler 1991; hRoot et al. 1971; iCounty maps in 1867 and 1876.
共Foster and Reiners 1986; Young and Hubbell 1991; Young and Perkocha 1994兲. These individual treelevel deaths may obscure or reinforce patterns at the fragment-level. Therefore, we also determined whether trees involved in domino effects demonstrated spatial patterns associated with edge, aspect, or soil drainage. Finally, the extent of wind-related mortality was determined by comparing 1兲 spatial patterns and characteristics 共type of mortality, DBH, and directionality兲 of trees downed by single windstorms versus all dead trees, and 2兲 temporal patterns of annual mortality versus mortality from single windstorms.
Methods Study sites and study species This study was conducted in three forest fragments in Champaign County, Illinois, USA. 共40°09' N, 88°10' W兲共Table 1兲. Trelease Woods and Brownfield Woods are old-growth remnants of a large presettlement forest known as “The Big Grove”, and are located 5 km northeast of Urbana. Hart Woods is a remnant of a separate presettlement forest along the Sangamon River, and is 15 km northwest of the other two fragments. Soils of the fragments are either Mollisols or Alfisols 共Table 1兲. The major canopy species in Tre-
lease Woods and Brownfield Woods is Acer saccharum Marsh. 共sugar maple兲 共Pelz and Rolfe 1977; Edgington 1991兲. Hart Woods is dominated by Quercus alba L. 共white oak兲 and Quercus velutina Lam. 共black oak兲 共Root et al. 1971兲. Nomenclature is based upon Mohlenbrock 共1986兲. The average annual temperature 共1961-1990兲 is 10.9 °C at the Champaign weather station 共Illinois Water Survey data兲. January is the coldest month 共-4.6 °C兲 and July is the hottest month 共23.9 °C兲. Average annual precipitation is 101 cm with a maximum monthly mean in July and a minimum in January. Average daily wind speed was 2.7 m/s during this study 共1994-2000兲. Daily maximum wind gusts ranged from 0.3 to 24.5 m/s from 1994-2000. The minimum wind gusts that can damage individual or small groups of trees is estimated between 22-25 m/s 共Savill 1983; Webb 1989兲. Of the three records exceeding 22 m/s, severe damage occurred only from the storm of November 21, 1994 in Trelease Woods. The fragments differ in their land-use history 共Table 1兲. Trelease Woods and Brownfield Woods are old-growth forests and have had no major human disturbances. Large, old oaks, common in Trelease Woods and Brownfield Woods, are lacking in Hart Woods. It is considered a secondary forest, judging from the even size distribution of oak trees in the fragment.
18 Fragmentation of these three forests occurred in the late 19th century. The current size and shape of the forest fragments were established by 1918. All fragments have well-defined edges maintained by mowing. Trelease Woods and Brownfield Woods are quadrangles with sides oriented to E, N, S, W, and are surrounded by roads, agricultural fields, and human residencies. Hart Woods is surrounded by roads and human structures on the east and north sides and is adjacent to a flood plain forest and a river on the south and west sides, respectively. Dutch elm disease in the 1950s killed many American elms 共Ulmus americana L.兲 and slippery elms 共Ulmus rubra Muhl.兲, two important components of all study sites at the time 共Boggess 1964; Root et al. 1971; Pelz and Rolfe 1977; Edgington 1991兲. Abundant dead American elm trees were noted in Trelease Woods in a survey in the 1960s 共Boggess 1964兲. The dead trees created by this epidemic had disappeared by 2000 共Y. Lin, personal observation兲. Most American elm occurred in the flood plain in Hart Woods, 共Root et al. 1971兲, an area not included in this study. Fragment-level: edge, aspect, and soil effects Dead trees were first sampled in Trelease Woods in 1995 and in Brownfield Woods and Hart Woods in 1996. We resampled in December 1999 – January 2000 for new trees dying after the first survey. Each fragment was divided into interior and edge 共within 100 m of edges兲 areas. Twenty quadrats 共25 ⫻ 25 m兲 were randomly established in each of these two areas in Trelease Woods and Brownfield Woods. Ten quadrats were randomly established in both interior and edge areas in the upland portion 共above 210 m兲 of Hart Woods. Edge quadrats in Hart Woods were located within 100 m of the north and east sides; interior quadrats were greater than 100 m from the north and east edges, and at least 50 m interior to the transition zone and slope leading to the flood plain forest. In limiting the edge area to 100 m, the narrower E-W dimension of 400 m in each fragment was taken into consideration. Prior studies have shown that wind damage can be elevated up to 100 m 共Laurance et al. 1998兲 or ⬎ 100 m 共Chen et al. 1992兲 from the edge. We delineated all edges as 100 m, resulting in 200 m as the E-W width and 400 m as the N-S length of the interior area for Trelease Woods and Brownfield Woods. The validity of the 100 m decision was tested by determining whether frequency of dead trees dif-
fered among the four 25 m intervals 共0-25, 25-50, 50-75, 75-100 m兲 of each 100 m edge. The frequency of dead trees did not differ among those four distances in edge areas in any fragment, when analyzed either for all trees 共Trelease Woods: x2 ⫽ 0.43, df ⫽ 3, P ⫽ 0.93; Brownfield Woods: x2⫽ 7.57, df ⫽ 3, P ⫽ 0.06; Hart Woods: x2⫽ 5.38, df ⫽ 2, P ⫽ 0.07兲 or only canopy trees 共Trelease Woods: x2⫽ 2.91, df ⫽ 3, P ⫽ 0.41; Brownfield Woods: x2⫽ 0.36, df ⫽ 3, P ⫽ 0.95; Hart Woods: x2⫽ 3.5, df ⫽ 2, P ⫽ 0.17兲. The sampling effort 共number of quadrats兲 did not differ significantly among the four distances in the edge area 共Trelease Woods: x2⫽ 2.0, df ⫽ 3, P ⫽ 0.57; Brownfield Woods: x2⫽ 2.8, df ⫽ 3, P ⫽ 0.42; Hart Woods: x2⫽ 4.4, df ⫽ 3, P ⫽ 0.22兲. Basal area of living trees per 50 ⫻ 50 m quadrat did not differ significantly between edge vs. interior areas in Trelease Woods or Brownfield Woods 共Trelease Woods: t ⫽ 1.46, df ⫽ 92, P ⫽ 0.15; Brownfield Woods: t ⫽ 1.29, df ⫽ 93, P ⫽ 0.20兲, but edge plots had a higher density of living trees in both fragments 共Trelease Woods: t ⫽ 3.93, df ⫽ 92, P ⫽ 0.02; Brownfield Woods: t ⫽ 4.38, df ⫽ 93, P ⬍ 0.0001兲 共J. Edgington, unpublished data兲. Comparable data for Hart Woods were not available. Topographic relief was so limited in all three fragments that slope was not a relevant variable in this study. Each edge quadrat was categorized into one of four aspects 共N, E, S, W兲 based on the nearest aspect of a given quadrat. The sampling effort 共number of quadrats兲 did not differ among aspects in any fragment 共Trelease Woods: x2⫽ 0.4, df ⫽ 3, P ⫽ 0.94; Brownfield Woods: x2⫽ 1.2, df ⫽ 3, P ⫽ 0.75; Hart Woods: x2 ⬍ 0.01, df ⫽ 1, P ⬎ 0.99兲. Soil drainage classification was obtained from soil surveys made by the USDA 共Mount 1982兲, which recognizes seven soil drainage classes. The study fragments included 3-4 of the seven classes 共Table 1兲. The fragments do not contain extreme classes of drainage. Mortality patterns of dead trees All dead trees with diameter at breast height 共DBH兲 ⱖ 10 cm and rooted inside quadrats were sampled and mapped. These trees accumulated over an unknown time period. Type of mortality, DBH, direction of fallen bole, and cause of fall 共primary trees felled independently or secondary trees felled by a falling adjacent tree兲 were determined for each dead tree. We measured DBH at 1.4 m from the ground;
19 for snapped-off trees, 1.4 m was either in the remaining stump or the snapped-off portion, depending on the height of the snap. The minimum size for canopy trees was set at 33 cm DBH for two reasons. First, the comparative dataset that we used for living tree 共see below兲 set ⱖ 33 cm as the size of canopy trees 共J. Edgington, unpublished data兲. Second, field observations confirmed that trees of this size created canopy gaps when they fell 共Y. Lin, personal observation兲. Trees with fully collapsed boles were not included in the study. Species of most dead trees was unidentifiable because most dead trees were highly decomposed. Three types of mortality were recognized: uprooted, standing dead, and snapped-off. Uprooted trees have the root ball pulled up and exposed during their fall. Standing dead trees 共snags兲 have upright boles with progressive loss of branches. Snapped-off trees have a break in their bole usually ⬍ 10 m above ground, and all woody parts above the break fall to the ground. Some standing dead trees during the first survey had uprooted or snapped-off by the second survey. Their type in the first survey was used.
among the three fragments 共F ⫽1.81, df ⫽ 2,149, P ⫽ 0.17兲. Six zones were used based on the following geometric argument. We assumed equal distances between the target tree and each surrounding tree and equal radii of crowns of all canopy trees. The target tree would form an equilateral triangle with the center of each pair of surrounding trees. Given the triangle’s 60° angles, six triangles 共and hence six trees兲 fit in the 360° surrounding the central tree. The status of the closest canopy tree in each of the six zones was placed into one of the following three mutually exclusive categories: 1兲 alive, 2兲 none, 3兲 died. A zone with no living canopy tree, i.e., categories 2-3, was defined as an “open zone”. For comparison, the same methodology was applied to an equal sample size of living canopy trees. These trees were chosen based on the wandering quarter method with a minimum distance of 25 m between trees 共Catana 1963兲. Random starting points were chosen at two north and two south edges in each fragment. Thus, the area sampled for living trees and target trees was approximately the same. Characteristics and spatial patterns of storm trees
Individual tree-level: domino effect We evaluated domino effects by examining the association between a newly fallen tree and its proximity to a gap. The quadrat data could not be used because dates of treefalls and the preexisting status of trees surrounding a treefall were unknown. Instead, we used an existing dataset from the Treefall Monitoring Program 共TMP兲 that included treefalls occurring from 1994-2000 in all fragments 共S. Buck, unpublished data兲. Each treefall was mapped, tagged, and identified to species in each forest fragment. No standing dead trees were included in this dataset. We selected treefalls from the TMP dataset that had DBH ⱖ 33 cm and fell independently 共not knocked down by another falling tree兲. This subset of the TMP dataset was designated as “target trees”. Domino effects were evaluated by characterizing the area surrounding each target tree in February – March 2000. An area of 20 m radius surrounding each target tree was divided into six pie-shaped zones 共per 60 degrees in compass reading兲. The use of 20 m as the boundary of this area around a target tree was based upon the 90th percentile 共19.6 m兲 of the distribution of distances between 152 pairs of randomly chosen canopy trees in the three fragments. Mean distance between trees did not differ significantly
We examined characteristics 共mortality type, DBH, and directionality兲 and spatial patterns of trees downed by single storms. Trees felled by two isolated windstorms were included in the TMP dataset and were designated as “storm trees”. A storm on November 21, 1994 in Trelease Woods felled 31 trees. The maximum wind gust on November 21, 1994 was 22.8 m/s; it ranked as the second highest wind gust during 1994-2000. Also, a storm on an unknown date in August, 1994 felled 25 trees in the upland portion in Hart Woods. The same variables were measured for storm trees as for dead trees in the quadrats. The storm trees were analyzed separately from the quadrat analyses. Almost all storm trees were not in the quadrats. Temporal patterns of tree mortality: annual-level versus single storm events From the resampling of the original quadrats in each fragment in December 1999 – January 2000, annual mortality rate, , was calculated as follows 共Sheil et al. 1995兲: ⫽ 共loge N0 – log e N1兲 / t N0 ⫽ mean number of living trees per hectare in 1995 共trees / ha兲
20 N1 ⫽ mean number of living trees per hectare in 1999 or 2000 共trees / ha兲 N1 ⫽ 关N0 – mean number of trees per hectare that died between two surveys 共trees / ha兲兴 t ⫽ interval between two surveys 共yr兲 values are estimates because the number of living trees for each quadrat was derived from a complete census in 1995 共trees ⱖ 17.8 cm DBH兲 in Trelease Woods and Brownfield Woods 共J. Edgington, unpublished data兲, rather than specific counts in each quadrat. In addition, number of tree deaths caused by the above single storm in Trelease Woods as a percentage of number of living trees was calculated. No data on living trees were available for Hart Woods. Data analysis We tested whether number of dead trees per quadrat was predicted by fragment, location 共edge versus interior兲, soil drainage, and mean DBH of dead trees in a quadrat. Square root transformation of number of dead trees per quadrat was necessary to meet the assumptions of random and normal residuals of linear models. A general linear model was run by Proc GLM in SAS 共SAS 1993兲. None of the variables or interactions between variable was significant in the full model. Therefore, effects of individual variables were examined separately by tests of goodness-of-fit and two-way contingency tables. We examined separately whether more dead trees were associated with edges, windward aspects, or poorly drained soils. Tests of goodness-of-fit were used to compare total frequency of all dead trees 共 ⱖ 10 cm DBH兲 and canopy trees only 共 ⱖ 33 cm DBH兲 between edge versus interior areas, and among aspects, and soil drainage classes. Only edge quadrats were included in the aspect analysis. In the soil analysis, expected values of dead trees in each drainage class were based upon their proportional area in the sampling quadrats in each fragment. Dead trees located in somewhat poorly drained and poorly drained soils in Hart Woods were combined because of small sample size. The same analyses were done for target trees and storm trees to evaluate their fragment-level spatial patterns. We analyzed whether wind-related types of mortality were more important at edges, on windward aspects, or in poorly drained soils. Two-way contingency tables were used to compare the relative importance of mortality types between edge versus interior areas, among aspects, and among soil drain-
age classes. The significance level was adjusted to P ⫽ 0.002 based upon Bonferroni adjustment for all goodness-of-fit and contingency tests 共SAS 1993兲. We compared characteristics 共mortality type, DBH, and directionality兲 of storm trees versus all dead trees in quadrats. We extracted al dead trees with DBH ⱖ 25.4 cm from the quadrat data for the DBH comparison, because 25.4 cm DBH was the minimal size used in the TMP dataset. The relative mortality type and DBH were compared by two-way contingency test and t-test, respectively. The randomness of treefall direction was tested by the Rayleigh test 共Batschelet 1981兲; only trees felled independently were included in analyses of directionality. The Rayleigh test generates a circular statistic that is used to determine if a group of observed directions differs significantly from randomness.
Results Fragment-level: edge, aspect, and soil effects Forest fragments differed in density of dead trees. The total number of dead trees in the two surveys was 213 in Trelease Woods, 207 in Brownfield Woods, and 127 in Hart Woods 共Table 2兲. Density of dead trees was 85, 83, and 102 trees / ha, respectively. Most trees in this study were uprooted, fell independently of other trees, and fell in random directions. Overall, uprooting was more common than the other two types of mortality in all fragments 共57% combined for all fragments兲. Eighty-five percent of all snapped-off and uprooted trees fell independently. The direction of trees felled independently of other trees was not significantly different from random in any fragment 共Table 3兲. No spatial patterns were associated with edge, aspect, or soil drainage in any fragment. The frequency of dead trees, when analyzed either for all trees 共DBH ⱖ 10 cm兲 or only canopy trees 共DBH ⱖ 33 cm兲, was not significantly different either between edge versus interior quadrats or among quadrats on different aspects in any fragment 共Table 2, Table 3兲. The relative frequency of mortality types also did not differ significantly between edge versus interior quadrats or among aspects in any fragment 共Table 3兲. The frequency of all dead trees and canopy trees was evenly distributed among soil drainage classes in each fragment 共Table 3兲. When the analysis was restricted to uprooted trees, the frequency of dead trees also did
21 Table 2. The number of dead trees and their relative frequency of mortality types in edge versus interior quadrats and among aspects in the three fragments 共aspect data are from edge quadrats only兲. Site
Location
Sample size
Mortality type
n
nq
Standing dead 共%兲
Snapped-off 共%兲
Uprooted 共%兲
Trelease
Interior Edge North East South West Total
116 97 28 30 17 22 213
20 20 5 6 4 5 40
22 20 14 20 18 32 21
31 28 21 23 47 27 30
47 52 64 57 35 41 49
Brownfield
Interior Edge North East South West Total
90 117 20 31 17 49 207
20 20 4 5 4 7 40
10 18 20 26 12 14 15
27 24 30 26 29 19 25
63 58 50 48 59 67 60
Hart
Interior Edge North East Total
65 62 34 28 127
10 10 5 5 20
11 28 32 21 19
17 19 15 25 18
72 53 53 54 63
n ⫽ sample size of dead trees; nq⫽ number of quadrats.
Table 3. Summary of test statistics for individual variables related to spatial patterns of dead trees in the three fragments. Factor
Dependent Variable
Test Statistic
df
Trelease
Brownfield
Hart
r Varies 0.17 共132兲 0.07 共154兲 0.09 共95兲 Randomnessa,b X2 1 1.69 3.52 0.07 Frequencyc X2 1 7.84 0.32 0.29 Frequency of canopy treesc X2 2 0.39 2.60 6.59 Mortality typed X2 3 1.11 3.93 0.58 Aspect Frequencyc Frequency of canopy treesc X2 3 2.25 2.11 1.14 X2 6 7.20 4.49 1.50 Mortality typed Soil drainage Frequencyc X2 2, 3e 1.07 4.62 0.20 X2 2, 3e 4.02 4.38 0.14 Frequency of canopy treesc X2 2, 3e 1.26 0.99 0.35 Frequency of uprooted treesc a Rayleigh test; 共Batschelet 1981兲; bComputed test statistic; number in parentheses ⫽ sample size 共n兲; cGoodness-of-fit test; dTwo-way contingency Table; edf is 2 for Trelease Woods and Hart Woods, but 3 for Brownfield Woods. No tests were significant after Bonferroni adjustment 共the adjusted ␣ ⫽ 0.002兲. Direction Edge vs. Int.
not differ significantly among soil drainage classes in any fragment 共Table 3兲. Individual tree-level: domino effects Domino effects occurred in two of the three fragments. A dead tree was more likely to occur adjacent to an existing gap than was a random living tree in Trelease Woods and Brownfield Woods. The frequency distributions of number of open zones with
no living canopy trees surrounding target treefalls versus living canopy trees differed significantly in Trelease Woods and Brownfield Woods, but not in Hart Woods 共Kolmogorov-Smirnov test. Trelease Woods: x2⫽ 10.91, df ⫽ 2, P ⫽ 0.009; Brownfield Woods: x2⫽ 13.07, df ⫽ 2, P ⫽ 0.003; Hart Woods: x2⫽ 5.79, df ⫽ 2, P ⫽ 0.11兲. The distributions were shifted toward a greater number of open zones surrounding treefalls compared to the area surrounding living trees in Trelease Woods and Brownfield Woods
22 related to edge, aspect, or soil drainage. The above target trees were evenly distributed between edge versus interior areas 共Trelease Woods: x2⫽ 1.59, df ⫽ 1, P ⫽ 0.21; Brownfield Woods: x2⫽ 1.35, df ⫽ 1, P ⫽ 0.25; Hart Woods: x2⫽ 2.64, df ⫽ 1, P ⫽ 0.10兲, among aspects 共Trelease Woods: x2⫽ 3.19, df ⫽ 3, P ⫽ 0.36; Brownfield Woods: x2⫽ 2.57, df ⫽ 3, P ⫽ 0.46; Hart Woods: x2⫽ 3.56, df ⫽ 1, P ⫽ 0.06兲, and among soil drainage classes 共Trelease Woods: x2⫽ 0.44, df ⫽ 2, P ⫽ 0.80; Brownfield Woods: x2⫽ 2.85, df ⫽ 3, P ⫽ 0.41; Hart Woods: x2⫽ 5.54, df ⫽ 2, P ⫽ 0.06兲. Characteristics of these target trees presumably downed by domino effects were similar to the quadrat dead trees in Trelease Woods and Brownfield Woods. The relative frequency of mortality types did not differ significantly between target trees and quadrat trees in Trelease Woods 共 X2⫽ 0.54, df ⫽ 1, P ⫽ 0.46兲, but significantly more snapped-off trees than expected occurred in Brownfield Woods 共 X2 ⫽ 5.21, df ⫽ 1, P ⫽ 0.02兲. Target trees fell in random directions in both Trelease Woods and Brownfield Woods 共Trelease Woods: r ⫽ 0.19, n ⫽ 48, P ⬎ 0.05; Brownfield Woods: r ⫽ 0.05, n ⫽ 30, P ⬎ 0.05兲. Characteristics and spatial patterns of storm trees
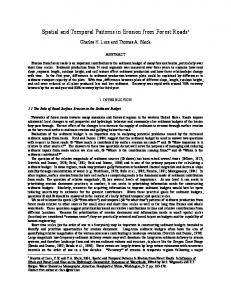
Figure 1. Frequency distributions of number of open zones surrounding target treefalls 共1994-2000兲 versus surrounding an equal number of living canopy trees in Trelease Woods 共n ⫽ 53兲, Brownfield Woods 共n ⫽ 30兲, and Hart Woods 共n ⫽ 28兲. An open zone was defined as a zone without a living canopy tree 共see methods兲.
共Figure 1兲. The average number of open zones surrounding target vs. living trees was 2.83 vs. 1.87 in Trelease Woods, 2.10 vs. 0.97 in Brownfield Woods, and 2.11 vs. 1.29 in Hart Woods. Most open zones 共categories 2-3兲 were occupied by no canopy tree or a dead tree that died prior to the fall of target trees 共87% in Trelease Woods, 97% Brownfield Woods, and 71% in Hart Woods兲. These open zones rarely contained dead trees that fell at the same time as or after the fall of the target trees. The target trees did not reinforce expected fragment-level patterns as they showed no spatial patterns
Storm trees differed from quadrat dead trees in mortality types, being larger, and having directionality. Significantly more snapped-off trees occurred for the storm trees than other dead trees in Hart Woods 共 X2 ⫽ 15.9, df ⫽ 1, P ⬍ 0.0001; Figure 2兲. The relative frequency of mortality type did not differ in Trelease Woods between storm trees and quadrat dead trees 共 X2⫽ 1.74, df ⫽ 1, P ⫽ 0.19; Figure 2兲. The mean DBH of storm trees was significantly greater than the mean DBH of all quadrat trees in both fragments 共Trelease Woods: t ⫽ ⫺ 2.6, df ⫽ 155, P ⫽ 0.01; Hart Woods: t ⫽ ⫺ 4.2, df ⫽ 66, P ⬍ 0.0001; log transformation兲. The mean DBH of storm trees was 61.4 cm and 60.4 cm in Trelease Woods and Hart Woods, respectively. In contrast, the mean DBH of all quadrat dead trees was 47.4 cm in Trelease Woods and 44.9 cm in Hart Woods. A strong directionality of treefall was shown for the storm trees in both fragments in contrast to the random direction of quadrat trees 共Trelease Woods: r ⫽ 0.83, n ⫽ 16, P ⬍ 0.001; Hart Woods: r ⫽ 0.77, n ⫽ 25, P ⬍ 0.001兲 共Figure 3兲. Most storm trees fell toward the N-NE in Trelease Woods and the S-SE in Hart Woods.
23 rates 共兲 were equivalent to 1.7% and 0.9 % of living canopy trees dying per year in Trelease Woods and Brownfield Woods, respectively. The turnover of canopy trees in Trelease Woods and Brownfield Woods was estimated at 59 and 111 years, respectively.
Discussion
Figure 2. Comparison of number of snapped-off versus uprooted trees between all dead trees versus trees that fell in the November 21, 1994 storm in Trelease Woods and the August, 1994 storm in Hart Woods. The area used for storm trees in the analysis is 24 ha in Trelease Woods and 6.8 ha in Hart Woods. The area used for all dead trees is 2.5 ha 共40 quadrats兲 in Trelease Woods and 1.25 ha 共20 quadrats兲 in Hart Woods.
Storm trees were not associated with edges or poorly-drained soils in either fragment, but were more frequent on the windward aspect in Trelease Woods. Storm tree frequency did not differ between edge versus interior areas 共Trelease Woods: x2⫽ 0.79, df ⫽ 1, P ⫽ 0.37; Hart Woods: x2⫽ 3.51, df ⫽ 1, P ⫽ 0.06兲 or among soil drainage classes in either fragment 共Trelease Woods: x2⫽ 4.24, df ⫽ 2, P ⫽ 0.12; Hart Woods: x2⫽ 2.69, df ⫽ 3, P ⫽ 0.26兲. The total frequency of storm trees was significantly different among aspects in Trelease Woods 共 X2⫽7.78, df ⫽ 3, P ⫽ 0.05兲, but not in Hart Woods 共 X2⫽0.60, df ⫽ 1, P ⫽ 0.44兲. Storm trees were more frequent on the windward aspect 共W兲 in Trelease Woods. Temporal patterns of tree mortality: annual-level versus single storm events The isolated storm in Trelease Woods contributed significantly to its annual tree mortality. It caused 0.8% mortality of living canopy trees, a level about one-half of the estimated annual mortality during 1995-2000. Annual mortality was higher in Hart Woods 共5.2 trees/ha/yr兲, considered a fragment of secondary forest, than in the fragments of the two old-growth forests, Trelease Woods 共3.3 trees/ha/yr兲 and Brownfield Woods 共2.4 trees/ha/yr兲. Mortality
The study provided limited evidence that wind caused spatial patterns of dead trees in these three fragments. Wind was apparently not the primary disturbance agent. Instead, spatial patterns of dead trees in the fragments accumulated from domino effects at the individual tree-level in two of the three fragments. Dead trees were more associated with preexisting gaps. Contrary to our predictions at the fragmentlevel, the frequency of dead trees was not greater at edges, on windward aspects, or in poorly drained soils. Both direct and indirect evidence allows evaluation of whether wind caused tree mortality, thus generating spatial patterns of dead trees. First, direct evidence of wind-caused mortality arose from the large number of trees felled by the two isolated windstorms. They contributed about one half of the annual mortality in one fragment. The importance of windstorms as a disturbance agent depends also upon their frequency. The frequency of such windstorms may be too low to generate patterns and/or to swamp patterns generated by other causes. Storms with gusts strong enough to fell trees 共 ⬎ 22-25 m/sec; Savill 1983; Webb 1989兲 have occurred on only five days in the past 12 years 共Illinois Water Survey data兲. Indirect evidence that windstorms may not predominate comes from the finding that quadrat dead trees were significantly different from the storm trees. Specifically, quadrat dead trees showed a random direction of fall, unlike the directional fall of storm trees. The inference is that many trees were felled by multiple causes, and not predominately by wind. In the study region, 77% of the prevailing wind systems are from the WNW-WSW 共Changnon 1981兲. If such winds were to cause much tree mortality, the direction of fall overall should correspond to this prevailing wind direction 共Rebertus et al. 1997兲. Some storms originate from other directions, diluting the prevailing direction, but they are unlikely to come from so many directions as to generate a random distribution of directions. Therefore, it is likely that
24
Figure 3. Circular histograms of the directionality for all dead trees 共open square兲 versus storm trees 共closed square兲 that fell in the November 21, 1994 storm in Trelease Woods and the August, 1994 storm in Hart Woods. Each value on the circular graph represents the midpoint of a 20° angle class 共360° is divided into 18 classes兲. The radius of each value represents the number of dead trees in a given angle class.
many deaths arose from non-wind-related causes, such as disease and senescence. Many oak trees in Trelease Woods and Brownfield Woods are old and dying 共Leffler 1991兲. These causes have been documented in other deciduous forests 共McCune et al. 1988; Runkle 1985兲. Spatial patterns of dead trees in Trelease Woods and Brownfield Woods accumulated mainly from trees falling adjacent to canopy gaps. Thus, the occurrence of dead trees was not random, but determined by previous disturbances. The occurrence of these domino effects in Trelease Woods and Brownfield Woods may be ultimately a consequence of their history of large numbers of relatively synchronous deaths by Dutch elm disease in the 1950s. The lack of domino effects in Hart Woods may arise from its lower density of American elm trees in our upland study area 共Root et al. 1971兲. The extent to which wind caused the domino effects in the two study fragments is not clear. Wind has been attributed as a cause of domino effects 共Foster and Reiners 1986兲, but our study did not provide strong evidence for wind damage. Undoubtedly, some deaths were cause by wind based upon the frequency of snapped-off trees, especially in Brownfield Woods. The random direction of the fallen target trees, however, indicated other causes were also operating. Alternative explanations for domino effects include even-aged clusters of trees dying at nearly the same interval, and a tree’s instability due to an asymmetrical crown arising from extension of lateral branches into existing gaps 共Young and Perkocha 1994兲. Domino effects have been reported in temperate deciduous forests 共Tanaka and Nakashizuka 1997兲, spruce-fir forests 共Spurgel 1976; Foster and Reiners 1986兲, and a tropical forest 共Hubbell and Foster 1986兲. Kubo et al. 共1996兲 modeled spatial patterns of gaps in a forest and concluded that their model could be improved by taking domino effects into consideration. The extent of this phenomenon is in question, however, due to inconsistent results. Mortality rates of trees adjacent to canopy gaps were not greater in some deciduous 共Runkle and Yetter 1987; Runkle 1990兲 and tropical forests 共Van Der Meer and Bongers 1996兲. The fragment-level patterns expected to be generated by wind were not evident. Multiple reasons may explain this lack of patterns. First, wind was apparently not the primary disturbance agent, as discussed above. Second, any pattern generated at the fragmentlevel may have been diluted by deaths caused by
25 domino effects at the individual tree-level. Target trees demonstrated domino effects, but did not show any fragment-level spatial patterns. Third, the lack of fragment-level patterns may be because the three fragments lack extremes in poor soil drainage and have almost no topographic relief. This homogeneity in physical factors would lessen any possibility for wind-generated spatial patterns. The long history of fragmentation of the study sites is not a likely explanation for the lack of fragmentlevel patterns. Theoretically, trees at these old forest edges might have made morphological adjustments to wind that made them less vulnerable to windthrow. Trees exposed to wind generally have a more compact growth form with shorter branches 共Telewski 1995兲 and higher wood density 共Nadkarni et al. 2000兲. This explanation is unlikely in the study fragments, because edge trees have asymmetrical crowns, their trunks lean away from the forest interior, and they have more branches lower on the edge side 共C. Augspurger, unpublished data兲. These adjustments are more likely a response to strong light rather than wind. The lack of edge and aspect effects does not eliminate wind as a factor in causing some tree deaths. The lack of difference in mortality between edge and interior areas may be because of two non-mutually exclusive reasons. First, the small width of the fragments may result in strong penetration of prevailing winds into interior as well as edge areas. Turbulence can be elevated up to ten tree heights from a forest edge 共McNaughton 1989; Kruijt et al. 1995兲. Given canopy heights of 25-30, the 400 m width from W to E of these fragments may be too small to produce significant edge effects. The spatial patterns of tree death caused by the 1994 storm in Trelease Woods are consistent with this estimated penetration distance. Second, the lack of edge effects on tree mortality may be explained by downbursts, rapid downdrafts of wind from single cell thunderstorms 共Fujita 1981, Roberts and Wilson 1989兲. The localized strong wind produced by downbursts would cause severe damage at the below-fragment scale and would not be localized at edges. Comparable data on spatial patterns of dead trees in eastern deciduous forests of U.S.A., especially in the Midwest, are limited. Tree mortality of dead trees has been estimated on a whole fragment basis 共Parker et al. 1985; Runkle 1990兲. Spatial heterogeneity of tree mortality in relation to edge, aspect, and soil drainage has rarely been examined. Most research on
forest fragments in this region has focused on edge effects on species composition 共Ranney et al. 1981; Whitney and Runkle 1981; Brandeis 1988; Brothers 1993兲 and microclimate 共Matlack 1993; Gehlhausen et al. 2000兲. Temporal patterns found in our study are similar to other studies in the overall mortality rate. The range of annual mortality rates 共0.9%-1.7%兲 and turnover times 共59-111 years兲 in this study are within the range found in studies of other temperate deciduous forests, as determined by a variety of methodologies 共Abrell and Jackson 1977; Runkle 1985; Volk and Fahey 1994; McCune et al. 1988; Nakashizuka et al. 1992; McCune and Henckel 1993; Nakashizuka and Iida 1995; Ward et al. 1996兲. Based on 14 stands of eastern deciduous forests in U.S.A., Runkle 共1982兲 found that mortality rate was 0.5-2% per year; turnover time averaged 100 years. Our current estimate for mortality rate in Brownfield Woods of 0.9% per year 共DBH ⱖ 17.8 cm兲 is also similar to the 1.4% per year estimate from 1939-1951 in Brownfield Woods 共DBH ⱖ 7.6 cm兲 共Cortright 1952兲. This study demonstrates the complexity of spatial and temporal patterns of dead trees in forest fragments. Spatial patterns are generated by multiple causes and from multiple spatial and temporal patterns. Treating biological processes in forest fragments as a function of distance to a forest edge 共Murcia 1995兲 or fragment size 共Esseen 1994兲 has proven to be too simplistic. We emphasize two approaches to further understand the mechanisms generating the complexity of spatial patterns of dead tree in forest fragments. First, our data show that an approach using more than one scale can identify causes operating at different spatial scales. Second, a retrospective approach provides one way to evaluate effects of past disturbances on present-day dynamics of forest fragments. The prevalence of domino effects suggests the importance of previous disturbances on current spatial patterns of dead trees. In the future, a multiplescale and retrospective approach will contribute to our understanding of the complexity of tree mortality in forest fragments.
Acknowledgments We thank S. Buck for the information of land-use history and treefall maps of storm trees and target trees used in examination of the domino effect, J. Edgington for unpublished data of DBH of living
26 trees in Trelease Woods and Brownfield Woods, and S. Aref for statistical advance. We also thank J. Dalling, W. J. Platt, K. Robertson, J. Runkle, and three anonymous reviewers for constructive criticism of earlier drafts of the manuscript. This research was supported by grants to Y.L. from the University of Illinois Graduate College and the Illinois Academy of Science.
References Abrell D.B. and Jackson M.T. 1977. A decade of change in an oldgrowth beech-maple forest in Indiana. Am. Midl. Nat. 98: 22– 32. Attiwill P.M. 1994. The disturbance of forest ecosystems: the ecological basis for conservative management. Forest Ecol. Manag. 63: 247–300. Batschelet E. 1981. Circular statistics in biology. Academic Press, London, UK. Bierregaard R.O. Jr., Lovejoy T.E., Kapos V., dos Santos A.A. and Hutchings R.W. 1992. The biological dynamics of tropical rainforest fragments. BioScience 42: 859–866. Boggess W.R. 1964. Trelease Woods, Champaign County, Illinois: woody vegetation and stand composition. Trans. Illinois Acad. Sci. 57: 261–271. Brandeis T.J. 1988. Effects of the long-term isolation and forest fragments on edge vegetation and avifauna. Master’s thesis, University of Illinois, Urbana, Illinois, USA. Brokaw N.V.L. 1985. Treefalls, regrowth, and community structure in tropical forests. pp. 53-69. In: Pickett S.T.A. and White P.S. 共eds兲, The ecology of natural disturbance and patch dynamics. Academic Press, New York, New York, USA. Brothers T.S. 1993. Fragmentation and edge effects in central Indiana old-growth forests. Nat. Areas J. 13: 268–275. Catana A.J. Jr. 1963. The wandering quarter method of estimating population density. Ecology 44: 349–360. Changnon S.A. Jr. 1981. Convective raincells. J. Atmos. Sci. 38: 1793–1797. Chen J., Franklin J.F. and Spies T.A. 1992. Vegetation responses to edge environments in old-growth Douglas-fir forests. Ecol. Appl. 2: 387–396. Cortright D.F. 1952. Twelve years of growth and mortality in Brownfield Woods. Master’s thesis, University of Illinois, Urbana, Illinois, USA. Edgington J.M. 1991. Brownfield Woods, Illinois: present composition and changes in community structure. Trans. Illinois Acad. Sci. 84: 95–112. Esseen P. 1994. Tree mortality patterns after experimental fragmentation of an old-growth conifer forest. Biol. Cons. 68: 19–28. Everham III E.M. and Brokaw N.V.L. 1996. Forest damage and recovery from catastrophic wind. Bot. Rev. 62: 113–185. Foster J.R. and Reiners W.A. 1986. Size distribution and expansion of canopy gaps in a northern Appalachian spruce-fir forest. Vegetatio 68: 109–114. Fujita T.T. 1981. Tornadoes and downbursts in the context of generalized planetary scales. J. Atmos. Sci. 38: 1511–1534.
Gehlhausen S.M., Schwartz M.W. and Augspurger C.K. 2000. Vegetation and microclimatic edge effects in two mixed-mesophytic forest fragments. Plant Ecol. 147: 21–35. Harmon M.E., Franklin J.F., Swanson F.J., Sollins P., Gregory S.V., Lattin J.D., Anderson N.H., Cline S.P., Aumen N.G., Sedell J.R., Lienkaemper G.W., Cromack K. Jr. and Cummins K.W. 1986. Ecology of coarse woody debris in temperate ecosystems. Adv. Ecol. Res. 15: 133–302. Hubbell S.P. and Foster R.B. 1986. Canopy gaps and the dynamics of a neotropical forest. pp. 77-96. In: Crawley M.J. 共ed.兲, Plant Ecology. Blackwell Scientific Publications, Oxford, UK. Iverson L.R., Oliver R.L., Tucker D.P., Risser P.G., Burnett C.D. and Rayburn R.G. 1989. Forest resources of Illinois: an atlas and analysis of spatial and temporal trends. Illinois Natural History Survey, Champaign, Illinois, USA. Kramer M.G., Hansen A.J., Taper M.L. and Kissinger E.J. 2001. Abiotic controls on long-term windthrow disturbance and temperate rain forest dynamics in southeast Alaska. Ecology 82: 2749–2768. Kruijt B., Klaassen W. and Hutjes R.W.A. 1995. Edge effects on diffusivity in the roughness layer over a forest. pp. 60-70. In: Coutts M.P. and Grace J. 共eds兲, Wind and Trees. Cambridge University Press, Cambridge, UK. Kubo T., Iwasa Y. and Furumoto N. 1996. Forest spatial dynamics with gap expansion: total gap area and gap size distribution. J. Theor. Biol. 180: 229–246. Laurance W.F. 1997. Hyper-disturbed parks: edge effects and the ecology of isolated rainforest reserves in tropical Australia. pp. 71-83. In: Laurance W.F. and Bierregaard R.O. Jr. 共eds兲, Tropical forest remnants: ecology, management, and conservation of fragmented communities. University of Chicago Press, Chicago, Illinois, USA. Laurance W.F., Ferreira, L.V., Rankin-de Merona J.M. and Laurance S.G. 1998. Rain forest fragmentation and the dynamics of Amazonian tree communities. Ecology 79: 2032–2040. Leffler S.M. 1991. Changes in the spatial autocorrelation of trees in Brownfield Woods from 1951 to 1988. Master’s thesis, University of Illinois, Urbana, Illinois, USA. Matlack G.R. 1993. Microenvironment variation within and among forest edge sites in the eastern United States. Biol. Cons. 66: 185–194. Mayer H. 1989. Windthrow. Phil. Trans. R. Soc. Lond. B. 324: 267–281. McCune B., Cloonan C.L. and Armentano T.V. 1988. Tree mortality and vegetation dynamics in Hemmer Woods, Indiana. Am. Midl. Nat. 120: 416–431. McCune B. and Henckel C.L. 1993. Tree mortality rates in two contrasting forests in Mammoth Cave National Park. Nat. Areas J. 13: 115–123. McNaughton K.G. 1989. Micrometeorology of shelter belts and forest edges. Phil. Trans. R. Soc. Lond. B. 324: 351–368. Mohlenbrock R.H. 1986. Guide to the vascular flora of Illinois. Southern Illinois University Press, Carbondale, Illinois, USA. Mount H.R. 1982. Soil survey of Champaign County, Illinois. USDA, Soil Conservation Service. Ill. Agri. Exp. Stat. Soil Rep. 114. Muller R.N. and Liu Y. 1991. Coarse woody debris in an old-growth deciduous forest on the Cumberland Plateau, southeastern Kentucky. Can. J. Forest Res. 21: 1567–1572. Murcia C. 1995. Edge effects in fragmented forests: implications for conservation. TREE 10: 58–62.
27 Nadkarni N.M., Lawton R.O., Clark K.L., Matelson T.J. and Schaefer D. 2000. Ecosystem ecology and forest dynamics. pp. 303-350. In: Nadkarni N.M. and Wheelwright N.T. 共eds兲, Monteverde: ecology and conservation of a tropical cloud forest. Oxford University Press, New York, New York, USA. Nakashizuka T. and Iida S. 1995. Composition, dynamics and disturbance regime of temperate deciduous forests in Monsoon Asia. Vegetatio 121: 23–30. Nakashizuka T., Iida S., Tanaka H., Shibata M., Abe S., Masaki T. and Niiyama K. 1992. Community dynamics of Ogawa Forest Reserve, a species rich deciduous forest, central Japan. Vegetatio 103: 105–112. Oliver C.D. and Larson B.C. 1996. Forest stand dynamics. John Wiley and Sons Inc., New York, New York, USA. Parker G.R., Leopold D.J. and Eichenberger J.K. 1985. Tree dynamics in an old-growth deciduous forest. Forest Ecol. Manag. 11: 31–57. Pelz D.R. and Rolfe G.L. 1977. Stand structure and composition of a natural mixed hardwood forest. Trans. Illinois Acad. Sci. 69: 446–454. Ranney J.W., Bruner M.C. and Levenson J.B. 1981. The importance of edge in the structure and dynamics of forest islands. pp. 67-95. In: Burgess R.L. and Sharpe D.M. 共eds兲, Forest island dynamics in man-dominated landscapes. SpringerVerlag, New York, New York, USA. Rebertus A.J., Kitzberger T., Veblen T.T. and Roovers L.M. 1997. Blowdown history and landscape patterns in the Andes of Tierra Del Fuego, Argentina. Ecology 78: 678–692. Roberts R.D. and Wilson J.W. 1989. A proposed microburst nowcasting procedure using Single-Doppler radar. J. Appl. Meteo. 28: 285–303. Root T.W., Geis J.W. and Boggess W.R. 1971. Woody vegetation of Hart Memorial Woods, Champaign County, Illinois. Trans. Illinois Acad. Sci. 64: 27–37. Ruel J. 2000. Factors influencing windthrow in balsam fir forests: from landscape studies to individual tree studies. Forest Ecol. Manag. 135: 169–178. Runkle J.R. 1982. Patterns of disturbance in some old-growth mesic forests of eastern North America. Ecology 63: 1533–1546. Runkle J.R. 1985. Disturbance regimes in temperate forests. pp. 17-33. In: Pickett S.T.A. and White P.S. 共eds.兲, The ecology of natural disturbance and patch dynamics. Academic Press, New York, New York, USA. Runkle J.R. 1990. Gap dynamics in an Ohio Acer-Fagus forest and speculations on the geography of disturbance. Can. J. Forest Res. 20: 632–641. Runkle J.R. and Yetter T.C. 1987. Treefalls revisited: gap dynamics in the southern Appalachians. Ecology 68: 417–424.
SAS. 1993. SAS user’s guide: statistics. Version 6 ed. SAS Institute Inc., Cary, North Carolina, USA. Savill P.S. 1983. Silviculture in windy climates. Forestry Abs. 44: 473–488. Sheil D., Burslem D.F.R.P. and Alder D. 1995. The interpretation and misinterpretation of mortality rate measures. J. Ecol. 83: 331–333. Sheil D. and May R.M. 1996. Mortality and recruitment rate evaluations in heterogeneous tropical forests. J. Ecol. 84: 91–100. Spurgel D.G. 1976. Dynamic structure of wave-regenerated Abies balsmea forests in the north-eastern United States. J. Ecol. 64: 889–911. Tanaka H. and Nakashizuka T. 1997. Fifteen years of canopy dynamics analyzed by aerial photographs in a temperate deciduous forest, Japan. Ecology 78: 612–620. Telewski F.W. 1995. Wind-induced physiological and developmental responses in trees. pp. 237-263. In: Coutts M.P. and Grace J. 共eds兲, Wind and Trees. Cambridge University Press, Cambridge, UK. Turton S.M. and Freiburger H.J. 1997. Edge and aspect effects on the microclimate of a small tropical forest remnant on the Atherton Tableland, northeastern Australia. pp. 45-54. In: Laurance W.F. and Bierregaard R.O. Jr. 共eds兲, Tropical forest remnants: ecology, management, and conservation of fragmented communities. University of Chicago Press, Chicago, Illinois, USA. Ulanova N.G. 2000. The effects of windthrow on forests at different spatial scales: a review. Forest Ecol. Manag. 135: 155–167. Van der Meer P.J. and Bongers F. 1996. Patterns of tree-fall and branch-fall in a tropical rain forest in French Guiana. J. Ecol. 84: 19–29. Volk T.A. and Fahey T.J. 1994. Fifty-three years of change in an upland forest in south-central New York: growth, mortality and recruitment. Bull. Torrey Bot. Club 121: 140–147. Ward J.S., Parker G.R. and Ferrandino F.J. 1996. Long-term spatial dynamics in an old-growth deciduous forest. Forest Ecol. Manag. 83: 189-202. Webb S.L. 1989. Contrasting windstorm consequences in two forests, Itasca State Park, Minnesota. Ecology 70: 1167–1180. Whitney G.G. and Runkle J.R. 1981. Edge vs. age effects in the development of a beech-maple forest. Oikos 37: 377–381. Williams-Linera G. 1990. Vegetation structure and environmental conditions of forest edges in Panama. J. Ecol. 78: 356–373. Young T.P. and Hubbell S.P. 1991. Crown asymmetry, treefalls, and repeat disturbance of broad-leaved forest gaps. Ecology 72: 1464–1471. Young T.P. and Perkocha V. 1994. Treefalls, crown asymmetry, and buttresses. J. Ecol. 82: 319–324.