Journal of Tropical Forest Science 26(3): 309–319 (2014)
Nguyen H et al.
SPATIAL PATTERNS AND DEMOGRAPHICS OF STREBLUS MACROPHYLLUS TREES IN A TROPICAL EVERGREEN FOREST, VIETNAM H Nguyen1, *, K Wiegand1 & S Getzin1, 2 1
Department of Ecosystem Modelling, Faculty of Forest Sciences and Forest Ecology, University of Goettingen, Buesgenweg 4, 37077 Goettingen, Germany 2 UFZ Helmholtz Centre for Environmental Research–UFZ, Department of Ecological Modeling, PF 500136, D-04301 Leipzig, Germany Received January 2013 NGUYEN H, WIEGAND K & GETZIN S. 2014. Spatial patterns and demographics of Streblus macrophyllus trees in a tropical evergreen forest, Vietnam. Streblus macrophyllus is a shade-tolerant and subcanopy tree species common to tropical evergreen forests in northern Vietnam. However, its ecology is poorly known. We used spatial point pattern analysis to describe the spatial arrangement of tree individuals within a forest community dominated by S. macrophyllus. All individual trees with diameter at breast height larger than 2.5 cm in a 1-ha plot were mapped and measured. The overall pattern of this species was a regular distribution at scales up to 2 m. Its juveniles and subadults were strongly aggregated, but adult trees were regular at scales of up to 3 m, implying evidence of density dependent thinning. The spatial pattern of S. macrophyllus strongly affected the patterning of the whole plot. In S. macrophyllus, juveniles and subadults were similarly distributed relative to adults and showed additional clumping independent of the adults. The overall interspecific association between adults of other species and S. macrophyllus at different life-history stages also showed independence. We conclude that S. macrophyllus is a predominant competitor within the community and it follows a gap-phase regeneration mode. Keywords: Point pattern analysis, forest community, gap-phase regeneration mode, intra- and interspecific associations
INTRODUCTION Streblus macrophyllus (Moraceae) is a common tree species in the tropical rainforests of northern Vietnam. Streblus macrophyllus has synonyms with some other scientific tree names such as Taxotrophis balansae, Dimerocarpus balansae and Dimerocarpus brenieri (Ho 1999, eFlohras 2010). The species is a subcanopy tree with height of up to 20 m. In Cucphuong National Park, Vietnam, S. macrophyllus is dominant in the humid valleys of the limestone mountains. However, the ecology of this species is poorly known. Trees are too long-lived for feasible study of the dynamics of cohorts from sapling to adult stage. Thus, it is easier to use the size-structured approach to investigate forest population dynamics (Turner 2004). Spatial patterns of cohorts can reflect contemporary or historical processes affecting the population. Therefore,
ecological processes in plant ecology such as dispersal, competition, survival and growth can be elucidated with the application of spatial statistics (Penttinen et al. 1992, Stoyan & Penttinen 2000). We used recent techniques of spatial point pattern analysis to detect spatial patterns of trees and test null hypotheses that were related to factors controlling spatial arrangements of trees (Diggle 2003, Wiegand & Moloney 2004). The variation of tree density at different spatial scales can be observed and may be determined by separate causes. It is commonly observed in a given species that spatial patterns shift from clumping to regularity with increasing tree size and this may be caused by density-dependent thinning explained by intraspecific competition for resources (John et al. 2002, Stoll & Bergius
*Present address: Faculty of Agricultural Sciences, Hatay Community College, Chuongmy, Hanoi, Vietnam;
[email protected]`
© Forest Research Institute Malaysia
309
Journal of Tropical Forest Science 26(3): 309–319 (2014)
Nguyen H et al.
2005, Freckleton & Lewis 2006) or only by high overall mortality (Wiegand et al. 2000). Moreover, negative associations between adult and early life-history stages, e.g. juvenile and subadult, provide useful information to describe regeneration processes of the species such as colonisation following dispersal or densitydependent mortality (Grau 2000). The goals of this study were to characterise and interpret spatial patterns of S. macrophyllus. Understanding the spatial str ucture and association of trees in different life-histor y stages may elucidate the processes controlling the dominance of this species in this forest. We hypothesised that intraspecific competition and clustered regeneration would be the dominant processes that facilitated species coexistence in general and abundance of the S. macrophyllus species in particular.
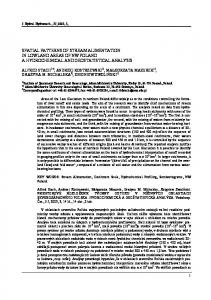
MATERIALS AND METHODS Study site and data collection The study was conducted at Cucphuong National Park, northern Vietnam. The national park was established in 1962 and covers an area of 22,200 ha (Figure 1). It is surrounded by limestone mountains with mean maximum height of 300–400 m and is covered by tropical evergreen rainforest. In the core zone, mean annual temperature is 20.6 °C, but mean temperature in winter is only 9 °C. In the buffer zone, mean annual temperature is about 2° higher. Annual mean humidity is 85% and the average annual rainfall is 2138 mm year-1. The study site, with latitude of 20° 17' N, longitude of 105° 39 ' E, and elevation of 266 m above sea level was specifically selected to investigate
Ranger station River Village Road Buffer zone Ecological restoration area Restriction area Service and administrative area
Figure 1
© Forest Research Institute Malaysia
Map of Cucphuong National Park, Vietnam
310
Journal of Tropical Forest Science 26(3): 309–319 (2014)
Nguyen H et al.
the spatial distribution of S. macrophyllus. Its adult trees may reach about 15 m in height and the species is found in combination with other species of Clusiaceae, Ulmaceae and Annonaceae (FIPI 1996). A 1-ha plot was created in an evergreen forest stand dominated by S. macrophyllus trees in the core zone. The plot was subdivided into a grid of 100 subplots of 10 m × 10 m. All woody plants with diameter at breast height (dbh, at 1.3 m above ground) ≥ 2.5 cm were identified to species, stem-mapped to their relative geographical coordinates (x, y) and their dbh recorded to the nearest 0.5 cm using a laser distance measurement device, compass and diameter tape. All individual trees were allocated into one of the three basic life-history stages, namely, juvenile (dbh < 5 cm), subadult (5 cm ≤ dbh < 10 cm) or adult (dbh ≥ 10 cm).
Statistical analysis The pair-correlation function and Ripley’s K-function are based on the distribution of distances of pairs of points (e.g. x, y coordinates of trees). Both functions are standard methods for analysing mapped point patterns in ecology (Condit et al. 2000, Wiegand et al. 2007) particularly in forest ecology used to quantify spatial patterns of tree species. Ripley’s K-function is defined as the expected number of points within distance r of an arbitrary point divided by the intensity λ where λ is the intensity of the pattern in the study area (Ripley 1976). We used the L-function (Besag 1977), a transformation of Ripley’s K-function, L(r) = (K(r)/π)0.5 – r. The pair-correlation function is the derivative of the K-function (Stoyan & Stoyan 1994, Illian et al. 2008), g(r) = K’(r)/(2πr). Particularly, it is noncumulative and is defined as the expected density of points at a distance radius r from a randomly chosen point. Based on the tree–tree distances, the univariate pair-correlation function g11(r) describes the spatial distribution of trees at a given radius r using a standardised density. Consequently, g11(r) = 1 under complete spatial randomness, g11(r) > 1 indicates aggregation and g11(r) < 1 indicates regularity at distance r within trees of the pattern. The bivariate pair-correlation function g12(r) was extended to describe spatial association between two types of points, for example two tree species. Function g12(r) was defined as the
© Forest Research Institute Malaysia
311
expected density of points of type 2 at distance r from an arbitrary point of type 1. Similarly to the univariate version, g12(r) = 1 indicates independence, g12(r) < 1 indicates repulsion and g12(r) > 1 indicates attraction between two tree species at distance r. The null models of random distribution, spatial independence and random labelling of trees were tested for null hypotheses related to ecological questions (Goreaud & Pelissier 2003, Wiegand & Moloney 2004, Illian et al. 2008). Significant departure from the null models was evaluated using 999 Monte Carlo simulations and approximately 99% confidence envelopes were built by 5th lowest and 5th highest values of these simulations. All point pattern analyses were performed using the grid-based software Programita (Wiegand & Moloney 2004). We used the null model complete spatial randomness to investigate whether the tree distribution is spatially restricted by environmental heterogeneity based on the spatial distribution of all adult trees. The distribution of all adult trees at scales beyond direct tree–tree interaction should indicate environmental suitability for colonisation and growth as well as allow capturing of environmental effects common to all species within the stand (Getzin et al. 2008). Using the L-function and pair-correlation function allowed us to observe the change in tree density from both cumulative and noncumulative perspectives at various scales. In plant communities, clumping at small scales generally indicated plant–plant interactions, while at large scales it showed the effects of environmental heterogeneity (Wiegand et al. 2007). Under heterogeneous site conditions, the pair-correlation function fluctuated above and below the upper simulation envelope, while the L-function indicated heterogeneity by a strong increase at large scales caused by highly cumulative density at those scales (Wiegand & Moloney 2004). However, in our plot, contrasting the pattern of all adult trees (dbh ≥ 10 cm) to the complete spatial randomness null model showed that there was no significant departure from the null model of complete spatial randomness at large scales (Figure 4). Consequently, the hypothesis of environmental homogeneity could not be rejected and we applied the homogeneous g-function for the following spatial pattern analyses.
Journal of Tropical Forest Science 26(3): 309–319 (2014)
Nguyen H et al.
Analysis 1: Overall univariate patterns The spatial distributions in size classes of all species, S. macophyllus and the remaining species were analysed and compared using the univariate pair-correlation function. We tested the null hypothesis of a random univariate spatial distribution of trees in each life-history stage (juvenile, subadult and adult). If a random distribution of a life stage over the entire plot was confirmed, this meant that no strong interaction occurred between the trees within this size class. Comparisons of the spatial distributions of the whole plot with and without considering S. macophyllus allowed us to interpret the abundance effect of the species. Overall, we expected that spatial patterns of adult trees were more regular than those of earlier life-history stages, with the increase of tree size being evidence of selfthinning.
Analysis 2: Dispersion patterns of S. macrophyllus Using random labelling null model, we investigated whether or not a random structure of two labels occurred within the joined patterns. The g-functions are invariant under random thinning of the joined patterns 1 and 2 (Wiegand & Moloney 2004). Thus, we expected g12(r) = g21(r) = g11(r) = g22(r). In our case-control design, control was pattern 1 (adult trees) and case was pattern 2 (one of the early life-history stages). If the test statistic g12(r) – g11(r) ≈ 0, it meant that individuals of pattern 2 around individuals of pattern 1 at scale r were distributed in the same way as individuals of pattern 1 around themselves. Therefore, this would imply that both life-history stages exploit the natural resources at that scale in a similar way (Getzin et al. 2008). In addition, if the test statistic g21(r) – g22(r) 0 meant that there were significantly less juveniles surrounding adults compared with the adult–adult relationship (Figure 6c). Intensity and range of aggregation decreased with increasing tree size (life-history stages). This is evidence of increased intraspecific competition between young conspecific trees which were growing away from adults. These results were also compatible with inferences about the aggregation of young trees (Figures 5f © Forest Research Institute Malaysia
315
and g) and they showed that these aggregations were independent of the pattern of adult trees.
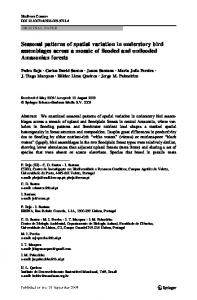
Heterospecific association of S. macrophyllus Streblus macrophyllus juveniles were marginally repulsed by heterospecific adults at a scale of 7 m (Figure 7a). Subadults and adults of S. macrophyllus were independent of the heterospecific adults (Figures 7b and c). Thus, we did not find very strong evidence of interspecific repulsion to support the assumption of a gap-phase regeneration mode of S. macrophyllus.
Journal of Tropical Forest Science 26(3): 309–319 (2014) (a) Adults vs. juveniles
0.8 g12 (r) – g11 (r)
Nguyen H et al.
0.6
0.6
0.4
0.4
0.2
0.2
0.0
0.0
-0.2
-0.2
-0.4
-0.4 -0.6
-0.6 0
10
20
30
40
0
50
(c) Adults vs. juveniles
1.0 g21 (r) – g22 (r)
(b) Adults vs. subadults
0.8
0.5
0.0
0.0
-0.5
-0.5
-1.0
-1.0
0
10
20
30
40
50
0
10
Scale r (m)
g12 (r)
0
50
20
30
40
50
Scale r (m)
10
20
30
40
(b) Remaining adults vs. S. macrophyllus subadults
1.8 1.6 1.4 1.2 1.0 0.8 0.6 0.4 0.2 50
(b) Remaining adults vs. S. macrophyllus adults
1.6 1.4 1.2 1.0 0.8 0.6 0.4
0
10
Scale r (m)
Figure 7
40
Test statistics g12(r) – g11(r) and g21(r) – g22(r) showing spatial associations between adult stage and two early stages in the life-history of Streblus macrophyllus; the observed patterns (dark line) lying beyond the confidence envelopes (grey lines) indicate significant departures from the null model of random labelling
(a) Remaining adults vs. S. macrophyllus juveniles
2.0 1.8 1.6 1.4 1.0 0.8 0.6 0.4 0.2
30
-1.5
-1.5
Figure 6
20
(d) Adults vs. subadults
1.0
0.5
10
20
30
Scale r (m)
40
50
0
10
20
30
40
50
Scale r (m)
The bivariate pair-correlation functions show association patterns between adults of remaining species and different life stages of Streblus macrophyllus; the observed patterns (dark line) lying beyond the confidence envelopes (grey lines) indicate significant departures from the null model of spatial independence
DISCUSSION Species composition and characteristics Streblus macrophyllus exhibited size structure with reverse J-shaped distribution suggesting continuous population regeneration and environmental suitability for establishment and survival of seedlings (Takahashi et al. 2001, Bunyavejchewin et al. 2003). There were many
© Forest Research Institute Malaysia
316
small trees which could potentially replace ageing adult trees and maintain the abundance of the species. This distribution type of diameter structure is often found for shade-tolerant species because one death of an adult will be replaced by individuals growing up from the smaller size classes (Richards 1996). Among the 40 remaining species, C. tonkinensis was a shade-intolerant species (FIPI 1996) with only 29 individuals but it contributed 41.79% of the total basal area.
Journal of Tropical Forest Science 26(3): 309–319 (2014)
Nguyen H et al.
Environmental homogeneity
Dispersal of S. macrophyllus
Aggregation of individuals in plant communities at scales smaller than 20 m is often interpreted as seed dispersal limitation or facilitation (Hubbell et al. 2001, Uriarte et al. 2004) while at larger scales, it may be obscured by environmental heterogeneity, e.g. rock outcrops, slope or soil nutrients (Harms et al. 2001, John et al. 2007, Wiegand et al. 2007). Here, our hypothesis of environmental heterogeneity was tested based on the density variation of all adult trees at large scales by contrasting results from L-function and g-function. By means of Figure 4, the inference was confirmed that no large-scale aggregation was captured in tree density and, therefore, the hypothesis of a homogenous environment at our plot scale was accepted with approximate 99% confidence intervals. Moreover, this initial inference allowed us to select appropriate null models for further tests on ecological hypotheses of tree interaction or association in the study plot.
We found lack of young trees in proximity to conspecific adults. This suggested densitydependent mortality because, due to seed rain, the density of seedlings was expected to be high in the vicinity of parent trees. Thereafter, it could be decreased by self-thinning. In the vicinity of S. macrophyllus adults, we found that juvenile and subadult trees occurred in a similar distribution as themselves. This is likely an outcome of the self-thinning process within S. macrophyllus. In addition, juveniles and subadults were clustered independently from adult trees. A potential mechanism that can produce the observed patterns of S. macrophyllus is a gapphase regeneration mechanism (Hamill & Wright 1986, Condit et al. 1992). For example, if seedlings required more light to survive and recruit into juvenile and subadult stages, then the distributions of juveniles and subadult trees could be aggregated in less shaded sites or canopy gaps (Itoh et al. 1997). Figures 5 and 6 also suggested that density-dependent mortality (Kenkel 1988, Itoh et al. 1997, Condit et al. 2000) was an important process within S. macrophyllus leading to decreased numbers of young trees near potential parent trees as well as more regular distances between survivors. In addition, S. macrophyllus has fleshy fruits that may be dispersed away from mother trees by birds or mammals. Consequently, the aggregation of juveniles and subadults at scales up to 15 m suggested a patchy distribution at local scales or gap-phase regeneration mode (Grau 2000, Franklin & Santos 2011).
Overall univariate patterns Aggregated distributions were found in both of the early life-history stages of S. macrophyllus, but the intensity and range of spatial scales notably decreased from juvenile to subadult stages. The aggregated patterns of juvenile and, to a smaller extent, subadult trees combined with the regular pattern of adult trees at small scales indicated that the spatial patterns of S. macrophyllus shifted with increasing tree sizes towards more regular patterns. This is evidence of density-dependent thinning that occurred within tree species, also known as self-thinning, which resulted from competition for natural resources including light, space, moisture, and nutrients (Kenkel 1988, Okuda et al. 1997). Similar patterns were found in other tropical forest trees (Sterner et al. 1986, Lan et al. 2009). Contrasting spatial patterns of all species, S. macrophyllus and the remaining species together clearly showed the predominant effect of this species on patterning of the entire community. For the remaining species, juveniles and subadults showed marginally aggregated patterns while adult trees were randomly distributed. Significant patterns of all trees were presented again in S. macrophyllus. These findings confirmed the predominance and strong competitive interaction of S. macrophyllus beyond the dominance in abundance. © Forest Research Institute Malaysia
317
Heterospecific association of S. macrophyllus The interspecific associations between adult trees of the remaining species (pattern 1) versus different life-history stages of S. macrophyllus (pattern 2) were expected to identify the local neighbourhood relationships of S. macrophyllus during its life-history. Interestingly, S. macrophyllus juveniles were weakly repulsed by other adults. Together with results from Figure 6, S. macrophyllus could be considered a light-demanding species at the juvenile stage. In the later life-history stages of S. macrophyllus, no significant association was found with the adults of other species (Figures 7a–b). This meant that S. macrophyllus adult trees competed strongly only with conspecific neighbours as shown in Figure 5 and were
Journal of Tropical Forest Science 26(3): 309–319 (2014)
Nguyen H et al.
independent of heterospecific adult neighbours. Therefore, light seemed to be a limiting factor for growth of S. macrophyllus in early life stages. From Figures 6 and 7, one potential explanation for the observed patterns was that S. macrophyllus might be an intermediate shade-tolerant species that needed sufficient sunlight to survive and grow in the early stages of life. Its patchy distribution seemed to be regulated by density-dependent mortality process.
CONCLUSIONS Analyses of size structure of S. macrophyllus suggested that this species could continuously recruit and probably persisted as a population. Spatial pattern analyses via life-history stages showed evidence of self-thinning processes whereby recruitment into larger tree size seemed to depend on open canopy. Therefore, S. macrophyllus was characterised by a gap-phase regeneration mode. However, this study was based on a snap-shot inventory and limited by the plot size. Thus, some ecological dynamic processes such as recruitment, dispersal and mortality could not be captured in detail. Therefore, long-term measurements are required to deeper elucidate the ecological processes in spatio-temporal plant dynamics of this tree species.
ACKNOWLEDGEMENTS This study was financed by the Ministr y of Education and Training of Vietnam and the Ministry of Science and Culture, State of Lower Saxony (Ministr y of Science and Culture; Cluster of Excellence ‘Functional Biodiversity Research’). Permission to work and access to the study site was provided by the Director of Cucphuong National Park, Vietnam. We thank B Strauss for her comments and editorial advices.
REFERENCES Besag J. 1977. Contribution to the discussion of Dr. Ripley’s paper. Journal of the Royal Statistical Society B 39: 193–195. Bunyavejchewin S, Lafrankie JV, Baker PJ, Kanzaki M, Ashton PS & Yamakura T. 2003. Spatial distribution patterns of the dominant canopy dipterocarp species in a seasonal dry evergreen forest in western Thailand. Forest Ecology and Management 175: 87–101. Condit R, Ashton PS, Baker P, Bunyavejchewin S, Gunatilleke S, G unatilleke N, H ubbell SP, F oster RB, I toh
© Forest Research Institute Malaysia
318
A, Lafrankie JV, Lee HS, Losos E, Manokaran N, Sukumar R & Yamakura T. 2000. Spatial patterns in the distribution of tropical tree species. Science 288: 1414–1418. Condit R, Hubbell SP & Foster RB. 1992. Recruitment near conspecific adults and the maintenance of tree and shrub diversity in a neotropical forest. American Naturalist 140: 261–286. Diggle PJ. 2003. Statistical Analysis of Spatial Point Patterns. Hodder Headline Group, London. Eflohras. 2010. Flora of China. Missouri Botanical Garden, St. Louis and Harvard University Herbaria, Cambridge. FIPI (F orest I nventory and P lanning I nstitute ). 1996. Vietnam Forest Trees. Agricultural Publishing House, Hanoi. Franklin J & Santos EV. 2011. A spatially explicit census reveals population structure and recruitment patterns for a narrowly endemic pine, Pinus torreyana. Plant Ecology 212: 293–306. F reckleton RP & L ewis OT. 2006. Pathogens, density dependence and the coexistence of tropical trees. Proceedings of the Royal Society B–Biological Sciences 273: 2909–2916. Getzin S, Wiegand T, Wiegand K & He F. 2008. Heterogeneity influences spatial patterns and demographics in forest stands. Journal of Ecology 96: 807–820. Goreaud F & Pelissier R. 2003. Avoiding misinterpretation of biotic interactions with the intertype K-12-function: population independence vs. random labelling hypotheses. Journal of Vegetation Science 14: 681–692. G rau HR. 2000. Regeneration patterns of Cedrela lilloi (Meliaceae) in northwestern Argentina subtropical montane forests. Journal of Tropical Ecology 16: 227242. Hamill DN & Wright SJ. 1986. Testing the dispersion of juveniles relative to adults: a new analytic method. Ecology 67: 952–957. H arms KE, C ondit R, H ubbell SP & F oster RB. 2001. Habitat associations of trees and shrubs in a 50-ha neotropical forest plot. Journal of Ecology 89: 947–959. Ho PH. 1999. Cay Co Viet Nam: An Illustrated Flora of Viet Nam, Nha Xuat Ban Tre, Hanoi. Hubbell SP, Ahumada JA, Condit R & Foster RB. 2001. Local neighborhood effects on long-term survival of individual trees in a neotropical forest. Ecological Research 16: 859–875. Illian J, Stoyan D, Stoyan H & Penttinen A. 2008. Statistical Analysis and Modelling of Spatial Point Patterns. Wiley, Sussex. Itoh A, Yamakura T, Ogino K, Lee HS & Ashton PS. 1997. Spatial distribution patterns of two predominant emergent trees in a tropical rainforest in Sarawak, Malaysia. Plant Ecology 132: 121–136. John R, Dalling JW, Harms KE, Yavitt JB, Stallard RF, Mirabello M, Hubbell SP, Valencia R, Navarrete H, Vallejo M & Foster RB. 2007. Soil nutrients influence spatial distributions of tropical tree species. Proceedings of the National Academy of Sciences of the United States of America 104: 864–869. John R, Dattaraja HS, Suresh HS & Sukumar R. 2002. Densitydependence in common tree species in a tropical dry forest in Mudumalai, southern India. Journal of Vegetation Science 13: 45–56.
Journal of Tropical Forest Science 26(3): 309–319 (2014)
Nguyen H et al.
Kenkel NC. 1988. Pattern of self-thinning in Jack-pine— testing the random mortality hypothesis. Ecology 69: 1017–1024. Lan G, Zhu H, Cao M, Hu Y, Wang H, Deng X, Zhou S, Cui J, Huang J, He Y, Liu L, Xu H & Song J. 2009. Spatial dispersion patterns of trees in a tropical rainforest in Xishuangbanna, southwest China. Ecological Research 24: 1117–1124. Okuda T, Kachi N, Yap SK & Manokaran N. 1997. Tree distribution pattern and fate of juveniles in a lowland tropical rain forest—implications for regeneration and maintenance of species diversity. Plant Ecology 131: 155–171. Penttinen A, Stoyan D & Henttonen HM. 1992. Marked point-processes in forest statistics. Forest Science 38: 806–824. Richards PW. 1996. The Tropical Rain Forest: An Ecological Study. Cambridge University Press, Cambridge. Ripley BD. 1976. The second-order analysis of stationary point processes. Journal of Applied Probability 13: 255–266. Sterner RW, Ribic CA & Schatz GE. 1986. Testing for life historical changes in spatial patterns of four tropical tree species. Journal of Ecology 74: 621–633. S t o ll P & B e r g i u s E. 2005. Patter n and process: competition causes regular spacing of individuals within plant populations. Journal of Ecology 93: 395–403.
© Forest Research Institute Malaysia
319
Stoyan D & Penttinen A. 2000. Recent applications of point process methods in forestry statistics. Statistical Science 15: 61–78. Stoyan D & Stoyan H. 1994. Fractals, Random Shapes, and Point Fields: Methods of Geometrical Statistics. John Wiley and Sons, Chichester. Takahashi K, Homma K, Vetrova VP, Florenzev S & Hara T. 2001. Stand structure and regeneration in a Kamchatka mixed boreal forest. Journal of Vegetation Science 12: 627–634. Turner IM. 2004. The Ecology of Trees in the Tropical Rain Forest. Cambridge University Press, Cambridge. Uriarte M, Condit R, Canham CD & Hubbell SP. 2004. A spatially explicit model of sapling growth in a tropical forest: does the identity of neighbours matter? Journal of Ecology 92: 348–360. Wiegand K, Jeltsch F & Ward D. 2000. Do spatial effects play a role in the spatial distribution of desert-dwelling Acacia raddiana? Journal of Vegetation Science 11: 473–484. Wiegand T, Gunatilleke S & Gunatilleke N. 2007. Species associations in a heterogeneous Sri Lankan dipterocarp forest. American Naturalist 170: 77–95. Wiegand T & Moloney KA. 2004. Rings, circles, and nullmodels for point pattern analysis in ecology. Oikos 104: 209–229.