Cell Transfer Delay Monitoring in ATM Networks Fábio Sakuray – Antônio Marcos Alberti – Leonardo de S. Mendes Department of Communications – State University of Campinas - UNICAMP P. O. Box 6101, CEP 13081-970 Campinas SP - Brazil sakuray, alberti,
[email protected] Mario Lemes Proença Jr. Department of Computer Science – State University of Londrina - UEL P. O. Box 6001, CEP 86051-990 Londrina PR - Brazil
[email protected]
Abstract One of the main features of ATM networks is to allow the establishment of connections with different Quality of Service (QoS) requirements. The monitoring of QoS parameters is fundamental to help network management decisions control traffic contracts. In this paper we present an in-service procedure to monitor end-to-end cell delay in ATM connections through OAM performance management cells. This procedure does not need to use synchronization between network elements in order to accomplish cell monitoring. Keywords: ATM, CTD Monitoring and QoS. 1. Introduction Asynchronous Transfer Mode (ATM) is a communication technology that intends to serve as a common base for transport of voice, video, images and data. ATM is a packet switched technology that works upon the transmission of 53 bytes, fixed size, commonly called “cells”. The cells are divided in two parts: 5 bytes for the header and 48 bytes for the payload. ATM standardizes a set of service categories, differentiated by delay and loss tolerance, for its connections [1,2]. These service categories are: Constant Bit Rate (CBR), Non-Real Time Variable Bit Rate (nrt-VBR), Real Time Variable Bit Rate (rt-VBR), Available Bit Rate (ABR), Guaranteed Frame Rate (GFR) and Unspecified Bit Rate (UBR). ATM allows the establishment of connections with different end-to-end performance parameters, called QoS parameters. ATM also assures the attainment of these parameters always that the flow submitted to the network is in agreement with the features defined in a traffic contract previously established between the network and the user. The QoS parameters can be grouped into several categories of performance, as illustrates in Table 1. Table 1: QoS Parameters. Performance Category Speed Dependability Accuracy
QoS Parameters Maximum Cell Transfer Delay (Max-CTD) Peak-to-Peak Cell Delay Variation (P2P-CDV) Cell Loss Rate (CLR) Cell Error Rate (CER) Severely Errored Cell Block Ratio (SECBR) Cell Misinsertion Rate (CMR)
ATM use statistical multiplexing to improve bandwidth allocation for the connections. To implement this, the ATM technology allocates an amount of bandwidth smaller than the sum 194
Network Management as a Strategy for Evolution and Development
195
of the peak cell rates. Buffers (or queues) are allocated throughout the connection to store excess cells, avoiding cell loss in those connections when the rate of transmission surpass the allocated bandwidth. The efficiency gain with statistical multiplexing is proportional to the allocated buffer size. With large buffers the efficiency gain increase but, if not managed correctly, large buffers can increase delays and delay jitter in individual connections. Such conditions can impair the QoS of each connection [3]. Therefore, monitoring of connections QoS is necessary to [4]: •
Certify that the network comply with the QoS contracted;
•
Aid network administrators in taking decisions (update of paths or substitution of connection admission control algorithms), evaluating previous decisions results, planning new links and maintaining the network.
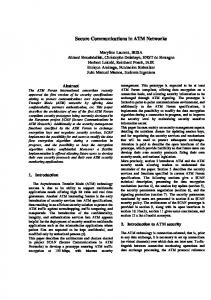
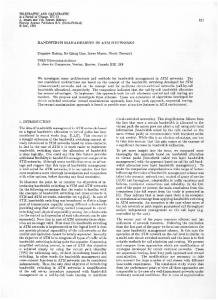
In this article we present MONIC, a procedure that allows the monitoring of end-to-end Cell Transfer Delay (CTD) in ATM connections. 2. Cell Transfer Delay (CTD) and OAM Functions The CTD is the time interval between the time of sending and the time of receiving a cell between two monitoring points (MP). In general, CTD varies from cell to cell. The CTD has three components: propagation delay, switching delay and queuing delay [2, 5]. Propagation delay is the time necessary to transfer bits through the media that connects two network elements. Switching delay is the time interval between the arrival of a cell in one of the switch’s input ports and its availability in an output port. This interval is fixed and composed by the time to access the switching table of ATM switches plus the processing delay of the switching array. The queuing delay is the time interval that the cell remains within the switches queues; this value depends on the network load. The CTD between two monitoring points, MP1 and MP2, can be determined in two situations, for synchronized networks and for non-synchronized networks. For synchronized networks, CTD is the time interval between the transmission of the first bit of the cell in MP1 (instant t1) and the arrival of the last bit of the same cell in MP2 (instant t2), therefore CTD = t2 - t1. For non-synchronized networks it is necessary to measure all the CTD components between MP1 and MP2. 2.1 Operation, Administration and Maintenance Functions (OAM) OAM functions are considered the basic structure for implementation of in-service performance monitoring. They allow end-to-end or segment monitoring of ATM connections through its performance management cells. The OAM cells are inserted in the Virtual Channel (VC) or Virtual Path (VP) level, receiving the denomination of F4 and F5 flows, respectively. Performance monitoring is done in monitoring blocks (MB) of users cells. Each OAM forward monitoring cell has information about the previous block of user cells. The block size can have 128, 256, 512 or 1024 users cells (figure 1a). Figure 1b shows the OAM performance management cell structure, which has the following fields [7, 8]: •
Header: carries the identification of the flow type (F4 or F5), the distinction between endto-end or segment monitoring and the information to the header of a cell from the same connection, as presented in [1];
196
LANOMS 2001
Insert OAM Forward Monitoring Cell
Insert Users Cells
OAM Forward Monitoring Cell Removing OAM Forward Monitoring Cell
Users Cells
Receive Users Cells
Monitoring Block (MB)
Private Switch (source)
Public Switch
Private Switch (destination)
Public Switch
Terminal
Terminal Remove OAM Backward Reporting Cell
OAM Backward Reporting Cell
Insert OAM Backward Reporting Cell
(a)
fields for backward reporting
Header
OAM Cell Type
OAM Function Type
MCSN
4
4
8
Bits: 40
TUCN
BEDC
0+1
16
TUCN
TS
Unused
0
16
16
TRCC
BLER
TRCC
0
32
232
16
0+1
8
16
fields for forward monitoring
(b)
Figure 1: (a) OAM Monitoring Block (b) OAM Performance Management Cell.
•
Type of OAM cell: indicates the type of management function performed by the cell. For performance management, the field has the code 0010;
•
Type of OAM function: this field indicates the function performed by the cell within the management type. For performance monitoring, this field can be 0000 for forward monitoring cells, or 0001 for backward reporting cells;
•
Monitoring Cell Sequence Number (MCSN): detects the loss of an OAM cell, assuring its correct sequence;
•
Total User Cells Number: accounts for the total number of users cells with CLP=0+1 (TUCN0+1) or CLP=0 (TUCN0) that were transmitted in the MB;
•
Block Error Detection Code (BEDC): only used in monitoring forward cells. computed over the data field of users cells belonging to the previous block;
It is
Network Management as a Strategy for Evolution and Development
197
•
Time Stamp (TS): it is an optional field. Contains the instant when the OAM performance management cell was inserted in the connection;
•
Total Received Cell Count: accounts for the total number of users cells with CLP=0+1 (TRCC0+1) or CLP=0 (TRCC0) that they had been received in the MB. These fields are only used in backward report cells;
•
Block Error Result (BLER): This field has the amount of detected parity errors on the data field of previous block cells. Only used in backward report cells.
In order to monitor the performance of a segment or an entire connection the following procedure must be carried on. The fields BEDC, TUCN0+1, TUCN0, MCSN and TS of the OAM forward monitoring cells are filled in the source elements. In the OAM cells destination element, the BEDC is computed over the entire received block of users cells and compared with BEDC received in OAM cell. The difference between them indicates the number of errors in the transmitted block of cells. The number of received users cells in the monitoring block is compared with the content of TUCN0+1 (or TUCN0), determining the number of lost or misinserted cells. The CTD is calculated from the difference between the instant of the arrival of an OAM forward monitoring cell and the content of his field TS. The results of these computations are attributed to the fields of the backward reporting cells. However, it is not possible to guarantee the accuracy of the calculated amount of lost or misinserted cells. Therefore, in situations where these events occur in equal amount, loss or misinsertion of cells in the cell block will not be evidenced. Another problem is the determination of the CTD as presented in section 2. In this case it is necessary synchronization between the clocks of the source and destination network elements. 3. Techniques for CTD Monitoring in ATM Networks In this section we describe some techniques for CTD monitoring. They can be divided in two categories, in-service and out-of-service [6, 7]. In the in-service technique, the monitoring is executed in connections that are carrying real user’s data, allowing the measurement of the end-to-end QoS being perceived by the user. The out-of-service technique consists of measuring the system performance in one or more switches under artificial conditions of traffic. Its objective is to verify the connection status between switches to confirm its performance parameters. 3.1 CTD Monitoring by Management Cells The scheme presented in [9] uses the field TS of OAM performance management cells to determine the time period that these cells remain in switches pertaining to the path of the monitored connection. The source element sends an OAM forward monitoring cell and fills his TS field. Each switch that receives the cell stores his cell arrival time and, at the moment the cell is scheduled for transmission, the switch calculates the cell delay and adds this delay into the cells TS field. This procedure is repeated in all switches visited by cell. The advantage of this scheme is that synchronization is not necessary between network elements. A variation for this scheme is to use several fields to separately store the delay of each switch, making possible to determine points of low performance in the connection. However, both
198
LANOMS 2001
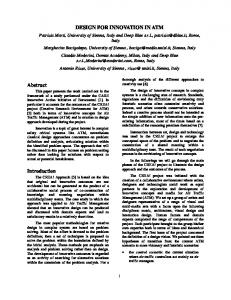
approaches demand that the switch has an increased processing capacity to modify cell contents. This represents an additional complexity to switches. 3.2 Estimating CTD with Clock Parameters The technique presented in [6] aims to determine parameters of compensation between remote clocks. With this technique the source element can update the value of the OAM cell TS field, getting the initial time of the cell with relation to the destination element clock. The remote clock (C) can be shaped using time compensation (∆T0) and clock frequency (α) parameters, through the following equation: C (t) = t + ∆T0 + α (t – t0) The parameters ∆T0 and α can estimated through quadratic linear regression, obtained through sequence samples of the TS field from OAM backward report cells, which are sent by the destination element. However, this technique requires a minimum delay in both directions of the connection, making it impracticable for use in asymmetric networks. Besides, the high number of samples necessary to get the parameters ∆T0 and α with acceptable error result in a high time of convergence in low bit rate links. The advantage of this technique is that no additional functions are necessary in switches. 3.3 INQIRE (In-Service QoS Remote Edge Instrument) The INQIRE [10] is a system for end-to-end QoS monitoring of ATM connections. It can be installed in a PC equipped with an ATM network interface card (called INQIRE station). To analyze the QoS of an user connection, the station establishes one INQIRE connection with the same parameters of QoS and path of the user connection, as illustrated in figure 2. The test cells sent by INQIRE connection will use the same buffers of user cells and, consequently will present the same features of performance. To determine the CTD, the INQIRE stations are kept synchronized. Some possible methods of synchronization are Global Positioning System (GPS) and Network Time Protocol (NTP). User's Connection
switch ATM
switch ATM
switch ATM
INQIRE Connection INQIRE Station
INQIRE Station
Figure 2: The INQIRE software The main INQIRE characteristics are: no test traffic is inserted in users connections, the independence of OAM functions implementation in switches, and the ability of end-to-end and in-service monitoring. However, the network resources remain reserved for an INQIRE connection even in case no test cells are transmitted.
Network Management as a Strategy for Evolution and Development
199
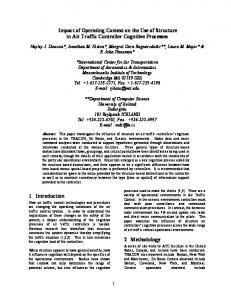
4. MONIC: CTD Monitoring in ATM Networks Baras in [11] suggest that we could use OAM cells to monitor end-to-end CTD in ATM networks. In this section we present MONIC, a procedure designed to monitor end-to-end CTD in an ATM connection. Let us consider a connection AB (figure 3), where the element A is sending data to B through an ATM network, with A and B not synchronized. In connection AB one OAM forward monitoring cell is inserted after N users cells. In MONIC, the following parameters, shown in figure 3, are used: • ti :
time instant in which the OAMi performance management cell is inserted in connection AB;
•
Ti : time instant that B receives the OAMi performance management cell;
•
∆ti: time interval between the sending of OAMi and OAMi-1, i.e., ∆ti = ti - ti-1;
•
∆Ti: time interval between the arrival of OAMi and OAMi-1, i.e., ∆Ti = Ti - Ti-1;
•
Block i: it represents a block of N users cells.
A
B ATM
t0 OAM0 Block 1
∆Τ1
t1 Block 2
T0
∆t1
∆t2
t2
Block 1
OAM1 T1
OAM2
∆ T2
Block 2
T2
Figure 3: The MONIC structure. The basic idea behind MONIC is to monitor the time difference (∆ti - ∆Ti), which we will call block i network performance behavior. Three situations can occur: •
∆Ti - ∆ti > 0: occurrence of congestion in the network, resulting in delay for the connection;
•
∆Ti - ∆ti = 0: the network performance is adjusted for the connection;
•
∆Ti - ∆ti < 0: the network presents low traffic levels, resulting in a better performance for the connection AB.
Thus, the CTD on block i can be calculated through: CTDi = CTDi-1 + (∆Ti - ∆ti)
(1)
200
LANOMS 2001
The value of CTD0 can be zero or, to improve the accuracy of the equation, it can be the minimum verified delay between the points being analysed, obtained when other connections do not exist. The queuing delay is considered null. 5. Using MONIC in a Simulated ATM Network To analyze the accuracy of the procedure we simulate a network composed of four ATM stations connected through a single central ATM switch, as shown in figure 4. The network has been simulated in Hydragyrum [12], a Network Simulator Environment oriented to event simulation. The models operate in a cell level. In each ATM station we leave an application running (App_0, App_1, App_2 and App_3), using in each one a file with self-similar traffic pattern [13]. The following connections are used: •
Connection_0: source App_0 – destination App_4, service category rt-VBR;
•
Connection_1: source App_1 – destination App_5, service category CBR;
•
Connection_2: source App_2 – destination App_4, service category CBR;
•
Connection_3: source App_3 – destination App_4, service category CBR.
The switch array and links have the rates of 155.52 Mbits/seconds. The broadband terminal equipment (BTE) and the switches have queuing structures with infinite capacity, in order to avoid cell discard. The distances between the pieces of equipment are equal to one meter. App_0 rt-VBR
App_4
Monitored Connection
App_1 BTE_0
BTE_2
CBR Switch
App_2 CBR
App_3
App_5
BTE_1
BTE_3
CBR
BTE_n: Broadband Terminal Equipment n
Figure 4: Network Architecture Simulated. The network elements were modeled as follows: •
Queuing structure: FIFO (First In First Out) queue;
•
Scheduler: the cells are extracted from queues and transmitted (or served) according with incoming order;
Network Management as a Strategy for Evolution and Development
201
•
Connection admission control: a new connection is admitted if the scheduler has sufficient bandwidth;
•
Queuing structure management: an incoming cell is stored if the amount of cells in the queue added by this new cell don’t exceed queue’s length;
•
Selective cell discard: an incoming cell is discarded if the queue is full;
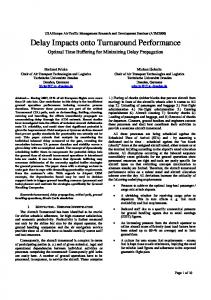
The graphic bellow presents the Connection_0 CTD in 50ms of simulation. Figures 5a, 5b and 5c show the results for blocks with N=128, N=256 and N=512 users cells, respectively. The value of CTD0 is 1.356316E-5. The results are compared with the CTD computed in OAM cell as presented in item 2. CTD (sec)
CTD (sec)
CTD of OAM Cell CTD by Monic
2,0x10
-4
-4
1,8x10
-4
1,5x10
-4
1,5x10
-4
1,2x10
-4
1,2x10
-4
1,0x10
-4
1,0x10
-4
7,5x10
-5
7,5x10
-5
5,0x10
-5
5,0x10
-5
2,5x10
-5
2,5x10
-5
2,0x10
-4
1,8x10
0,0
CTD of OAM Cell CTD by Monic
0,0 0,0
1,0x10
-2
2,0x10
-2
3,0x10
-2
4,0x10
-2
5,0x10
-2
0,0
1,0x10
-2
-2
2,0x10
Time (sec)
-2
3,0x10
4,0x10
-2
-2
5,0x10
Time (sec) (b)
(a)
CTD (sec) CTD of OAM Cell CTD by Monic
-4
2,0x10
-4
1,8x10
-4
1,5x10
-4
1,2x10
-4
1,0x10
-5
7,5x10
-5
5,0x10
-5
2,5x10
0,0 0,0
-2
1,0x10
2,0x10
-2
-2
3,0x10
-2
4,0x10
-2
5,0x10
Time (sec) (c)
Figure 5: CTD computed in Connection_0 with blocks of: (a) 128, (b) 256 and (c) 512 users cells Figure 5 show that an increase in the frequency of OAM cells allows the detection of CTD fluctuations with a smaller length. However, the overhead caused by OAM cells must be considered, since it reduces the connection rate available for users cells. Table 2 shows the percentage of overhead inserted in a monitored connection. From the simulation, we can see that the results agree inside an accuracy of 93%.
202
LANOMS 2001
Table 2: Overhead of MONIC. Block of users cells
Overhead
128
0,775193%
256
0,389105%
512
0,194931%
6. Conclusion In this paper we presented MONIC, a procedure to monitor end-to-end CTD in an ATM connection using the time interval between two consecutive OAM cells at the source and at the receiver. The presented technique possess the following advantages: •
CTD can be determined independently in each direction of the connection;
•
It uses an in-service monitoring;
•
Only OAM functions are needed in the switches;
•
Simplified implementation;
•
No synchronism between the network elements is necessary. References
[1] Black, U. – “ATM: Foundation for Broadband Networks”, Prentice Hall, London -1995. [2] ATM Forum – “Traffic Management Specification, Version 4.1”, AF-TM-0121.000, March 1999. [3] Huang, A; et al – “Advanced Traffic Management for Multiservice ATM Networks. N.E.T. White Paper” - http://www.net.com, 1998. [4] Arora, A.; Baras, J. “Performance Monitoring in ATM Networks - Technical Research Report”. Center for Satellite and Hybrid Communication Networks and Institute of Systems Research, April 1998. [5] Giroux, N.; Ganti, S. – “Quality of Service in ATM Networks: state-of-the-art Traffic Management”, Prentice Hall – 1999. [6] Roppel, C. “Estimating Cell Transfer Delay in ATM Networks Using In-Service Monitoring Methods”. Proceedings of Globecom, 1995, pages 904-908. [7] Hernández, J. G.; Ghanbari, M. “In-service monitoring of quality of service in ATM networks using OAM cells”. IEE Proceedings Communications, Vol. 146, No 2, April 1999, pages 102-106. [8] ITU-T Recommendation I.610, “B-ISDN Operations and Maintenance Principles and Functions”, May – 1995. [9] Chen, T. at al. “Monitoring and Control of ATM Networks Using Special Cells”. IEEE Network, September/October 1996, pp. 28-38. [10] Chen, T. at al. “INQIRE: A Software Approach to Monitoring QoS in ATM Networks”. IEEE Network, March/April 1998, pp.32-37.
Network Management as a Strategy for Evolution and Development
203
[11] Baras, J. S.; Arora, A.; Mykoniatis, G. “Delay Monitoring in ATM Networks” - Third Annual Federated Laboratory Symposium on Advanced Telecommunications/ Information Distribution Research Program (ATIRP). University of Maryland, February 2-4, 1999, pages 259-263. [12] Andrade N., E. L.; Alberti, A. M.; Mendes, L. S. – “Hydragyrum – Ambiente de Simulação de Redes a Eventos Discretos”, XVIII Simpósio Brasileiro de Telecomunicações - SBrT, September, 2000, Gramado RS - Brazil. [13] Sahinoglu, Z. and Tekinay, S. – “On Multimedia Networks Self-Similar Traffic and Network Performance”, IEEE Communications Magazine – January 1999.