The International Archives of the Photogrammetry, Remote Sensing and Spatial Information Sciences, Volume XLII-2/W7, 2017 ISPRS Geospatial Week 2017, 18–22 September 2017, Wuhan, China
CHANGE DETECTION BY FUSING ADVANTAGES OF THRESHOLD AND CLUSTERING METHODS M. Tan *, M. Hao School of Environment and Spatial Informatics, China University of Mining and Technology, 221116 Xuzhou City,
[email protected],
[email protected]
Commission III, WG III/6 KEY WORDS: Change Detection, Medium Resolution, Remote Sensing, Threshold, Clustering, Advantage Fusion
ABSTRACT: In change detection (CD) of medium-resolution remote sensing images, the threshold and clustering methods are two kinds of the most popular ones. It is found that the threshold method of the expectation maximum (EM) algorithm usually generates a CD map including many false alarms but almost detecting all changes, and the fuzzy local information c-means algorithm (FLICM) obtains a homogeneous CD map but with some missed detections. Therefore, we aim to design a framework to improve CD results by fusing the advantages of threshold and clustering methods. Experimental results indicate the effectiveness of the proposed method.
1. INTRODUCTION The Change detection (CD) from remote sensing images identifies changes by analyzing multitemporal images acquired in the same geographical area at different times, such as land use/land cover, damages due to earthquakes, floods and fires, changes of roads, cities, and plants (Lu et al., 2004). In the past three decades, lots of CD methods have been proposed to automatically achieve accurate CD results (Hao et al., 2014; Moser et al., 2011). All methods can be grouped into supervised and unsupervised types. The former detects changes and supply change types by comparing the classification images of bitemporal images. However, it needs the ground reference, which limits its application. The latter identifies changes without the ground reference, therefore, the study in this paper focuses on the unsupervised ones. Three steps are usually involved: 1) pre-processing, 2) image comparison and 3) image analysis (Singh, 1989). In the first step, several corrections need implementing between bitemporal images to reduce the effects of light and atmospheric condition, such as co-registration, radiometric corrections (Mishra et al., 2012; Ye and Shan, 2014). In the second step, the difference image is generated by pixel-by-pixel comparing between bitemporal images. Many methods have been used to generate the difference image, including the image differencing, image ratio, image correlation, image regression, log ratio for synthetic aperture radar (SAR) images and change vector analysis (CVA) (Shi et al., 2016). In the third step, the difference image is analyzed and divided into changed and unchanged parts. In the beginning, the visual analysis was applied to detect changes, which costs much time and limits the production efficiency (Sader and Winne, 1992). Afterward, a trial-and-error threshold method was implemented by changing the threshold value, and an empirical threshold method was developed to identify changes using xi m T , where xi is the gray value of the i-th pixel, T is a constant, m and are the mean and standard deviation of the difference image, respectively (Fung and LeDrew, 1988). In order to improve the efficiency, some
automatic threshold methods were proposed (Bazi et al., 2005; Huang and Wang, 1995; Im et al., 2008). One of the most popular threshold methods was proposed by Bruzzone, where the difference image is supposed as mixture Gaussian model and the Bayes rule for minimum error is adopted to calculate the threshold using expectation maximum (EM) algorithm(Bruzzone and Prieto, 2000). Due to many false alarms existing in the change map obtained by threshold, the spatial information was introduced by some advanced models, such as Markov random model (Gu et al., 2015; Subudhi et al., 2016), , support vector machine (Nemmour and Chibani, 2006), artificial neural network (Wang et al., 2015; Xu et al., 2015), wavelet transform (Celik and Ma, 2011), active contour model (Hao et al., 2014; Li et al., 2015) and fuzzy c-means clustering (FCM) algorithm (Ghosh et al., 2011; Krinidis and Chatzis, 2010; Mishra et al., 2012). The ranges of pixel gray values in difference image belonging to the changed and unchanged clusters often have overlap, FCM has robust characteristics for ambiguity and provides an appropriate choice to identify them by using fuzzy set information (Ghosh et al., 2011). The improved ones mainly contain an improved local energy term of exploiting spatial information. A robust fuzzy local information c-means (FLICM) was proposed by Krindis and Chatzis (Krinidis and Chatzis, 2010) for image segmentation. A novel fuzzy factor was added into FCM to guarantee noise insensitiveness and image detail preservation. Gong et al. (Gong et al., 2012) improved the fuzzy factor of FLICM by reshaping the effects of neighbor pixels on the center pixel, called reformulated FLICM (RFLICM), which improves the utilizing manner of local information by modifying the fuzzy factor. It is found that the threshold method, i.e., the EM algorithm, usually generates more false alarms but less missed detections than clustering algorithm, such as active contour model and FLICM. The EM-based threshold method generates a CD map including many false alarms but almost detecting all changes. FLICM obtains a CD map including less false alarms. Therefore, we aim to design a framework to improve CD results by fusing the advantages of threshold and clustering methods.
* Corresponding author
This contribution has been peer-reviewed. https://doi.org/10.5194/isprs-archives-XLII-2-W7-897-2017 | © Authors 2017. CC BY 4.0 License.
897
The International Archives of the Photogrammetry, Remote Sensing and Spatial Information Sciences, Volume XLII-2/W7, 2017 ISPRS Geospatial Week 2017, 18–22 September 2017, Wuhan, China
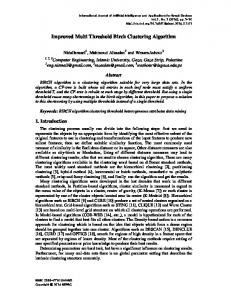
The designed framework mainly includes three blocks. First, CVA is used to bitemporal images to produce the difference image. Second, EM-based threshold and FLICM are implemented the difference image and two initial CD maps are yielded. Then, an advantage fusion strategy is proposed to fuse two initial CD maps by taking full use of their advantages and obtain the final CD map.
Input
T1 image
T2 image
X1
X2
Change vector analysis or image differencing
Generate the difference image
Obtain initial CD maps
EM-based threshold CD
FLICM-based clustering CD
Step 1: Initialize the means k , covariance k and a priori probability P(Wk). A threshold d to the difference image was set to obtain the initial changed pixels and unchanged pixels. The threshold can be generated from an empirical equation written as: (3) d X R X where R is a constant, X and X denote the respective mean and standard deviation of the difference image. The values of k , k and P(Wk) can then be computed from the classified pixels and regarded as the initial values to EM. Step 2: Expectation step. The equations (1) and (2) are used to evaluate the a posterior probability P(Wk/X) with the equation (4), as follows: P(Wk ) p( xi Wk ) (4) P(Wk xi ) P( xi ) here 1 i MN and xi is the ith pixel of the difference image. Step 3: Maximization step. Re-estimate the parameters using the following equations: MN
P (W t
t 1
P (Wk )
(5)
MN
MN
Label the CD map of threshold
P (W t
t 1
k Fusion procedure
xi )
k
i 1
k
i 1 MN
xi ) xi
(6)
Pt (Wk xi )
Calculate the overlap ratio
i 1
MN
P (W t
Set the overlap threshold
( k ) 2
t 1
k
i 1
xi )( xi k ) 2
(7)
MN
Pt (Wk xi ) i 1
CD map
Output
Figure 1. Flowchart of the designed framework 2. METHODOLOGY 2.1 EM-based Threshold CD Let X1 and X2 be two multispectral images acquired from the same geographical area at two different times. Assuming images have been co-registered and radiometrically corrected, the two images have the same size of M × N. The difference image X is generated by the magnitude of the CVA method, and consists of changed pixels W1 and unchanged pixels W2. In this study, it is assumed that the difference image X can be seen as a Gaussian mixture, as follows: (1) p( X ) p( X W1 ) P(W1 ) p( X W2 )P(W2 ) where p(X), p(X/W1) and p(X/W2) are the probability density functions of the difference image X, changed pixels W1 and unchanged pixels W2, and P(W1) and P(W2) are the a priori probabilities of changed pixels and unchanged pixels, respectively. The probability density functions p(X/W1) and p(X/W2) are Gaussian and can be written as: ( X k ) 2 1 (2) p X Wk exp 2 k2 k 2 here k (1, 2) , k and k are the respective mean and variance of the corresponding pixels of class Wk. Given that, EM can be performed to estimate the mean values k by the following three steps (Hao et al., 2014).
where the superscripts t and t+1 are the current and next iterations, respectively. The parameters are estimated by the steps above and then checked for convergence. If the convergence criterion is not satisfied, repeat steps 2 and 3 until convergence is achieved. Finally, the mean values are estimated. Finally, the Bayes rule for minimum error is adopted to calculate the threshold T0 according to the following equation:
2 2
12 T0 2 2 2 12 1 22 T0 2 12 22
P 2 22 12 2 22 12 ln 1 0 2 P 1 2.2 FLICM-based Clustering CD
(8)
Dunn (Dunn, 1973) first developed FCM algorithm and later extended by Bezdek (Bezdek, 1981). This clustering algorithm aims at producing and optimal c partition through an interactive clustering process. Suppose there are N pixels in the difference image X x1 , x2 , , xN , and c is the number of the clusters. The FCM aims at obtaining membership probability uki 0,1 c
( uki 1 i 1,2,
, N ) of the pixel xi in the difference image
k 1
for the k-th cluster by minimizing the objective function as follows: N
c
J m ukim xi vk
2
(9)
i 1 k 1
where uki is the degree of membership value of the pixel xi in the k-th cluster, vk is the prototype of the center of cluster k, m is the weighing exponent in each fuzzy membership, and
This contribution has been peer-reviewed. https://doi.org/10.5194/isprs-archives-XLII-2-W7-897-2017 | © Authors 2017. CC BY 4.0 License.
898
The International Archives of the Photogrammetry, Remote Sensing and Spatial Information Sciences, Volume XLII-2/W7, 2017 ISPRS Geospatial Week 2017, 18–22 September 2017, Wuhan, China
xi vk
2
is the Euclidean distance between object xi and the
cluster center vk . To improve the robustness of the conventional FCM, local information has been introduced to extend it. Krinidis and Chatzis (Krinidis and Chatzis, 2010) proposed a robust FLICM clustering algorithm to overcome the disadvantages of the absence of spatial information in the initial FCM algorithm. A fuzzy local similarity measure factor G was added into FCM, aiming to guarantee noise insensitiveness and image detail preservation, and the modified objective function is written as N
c
2 J m ukim xi vk +Gki i 1 k 1
(10)
where the xi is the gray value of the i-th pixel, N is the number of pixels in the difference image, vk is the prototype of the center of cluster k, uki denotes the fuzzy membership of the i-th pixel with respect to cluster k, and for each pixel xi , the fuzzy membership
satisfies
the
constraint
that
c
u 1 .
connected pixels, labeled from 1 to n, as shown in Figure 1. Step 2: Calculate the overlap ratio for each cluster. For the labeled cluster Ci, the overlap ratio ri is calculated referencing the FLICM CD map using ri n1 n2 , where n1 is the pixel number in Ci and n2 is the number of changed pixels in the corresponding region of FLICM CD map. Step 3: Set a threshold T to the overlap ratio ri. If riT
r=0.0625