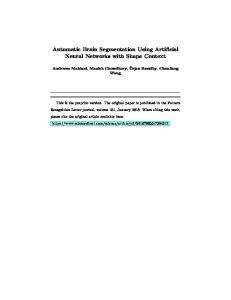
Cite this paper as: Yazdanpanah A.P., Regentova E.E., Mandava A.K., Ahmad T., Bebis G. (2013) Sky Segmentation by Fusing Clustering with Neural Networks.
Sky Segmentation by Fusing Clustering with Neural Networks Ali Pour Yazdanpanah1, Emma E. Regentova1, Ajay Kumar Mandava1, Touqeer Ahmad2, and George Bebis2 1
Dept. of Electrical and Computer Engineering, University of Nevada, Las Vegas Maryland Parkway Las Vegas, Nevada 89154-4026 2 Dept. of Computer Science & Engineering, University of Nevada, Reno 1664 N. Virginia Street Reno, Nevada 89557-0208
Abstract. Sky segmentation is an important task for many applications related to obstacle detection and path planning for autonomous air and ground vehicles. In this paper, we present a method for the automated sky segmentation by fusing K-means clustering and Neural Network (NN) classifications. The performance of the method has been tested on images taken by two Hazcams (ie., Hazard Avoidance Cameras) on NASA’s Mars rover. Our experimental results show high accuracy in determining the sky area. The effect of various parameters is demonstrated using Receiver Operating Characteristic (ROC) curves.
1
Introduction
NASA's Mars Exploration Rover mission (MER) and Mars Science Laboratory mission (MSL) are ongoing robotic space missions involving three rovers, exploring Mars. Two of the most important tasks during their missions are route planning, and path finding. The first step in route planning and path finding is to determine the suitability of the terrain for traversal. This includes extracting appropriate features for assessing rover navigation difficulty. To accomplish this task, accurate sky segmentation is required. This is not an easy task, however, due to the diversity of skyline shapes (boundaries between sky regions and non-sky areas) and clutter like clouds. There are two main categories of sky segmentation found in computer vision literature. In the first category, the problem is addressed as finding a horizon line/sky line which mostly depends on edge detection and some post processing on top of detected edges. The regions above the horizon line are labeled as sky whereas the regions below the horizon are labeled as non-sky. In the second category of sky segmentation, the problem is formulated as a pixel wise classification problem so every pixel in the given image gets a sky or non-sky label. In [4] Lie et al. have presented an edge based horizon line detection method. They formulate the horizon finding problem as a multi-stage graph problem where a shortest path is found extending from the left most column to the right most column. A Sobel/Canny edge detector is applied on the given gray scale image. The detected edges are used as graph nodes and links with zero G. Bebis et al. (Eds.): ISVC 2013, Part II, LNCS 8034, pp. 663–672, 2013. © Springer-Verlag Berlin Heidelberg 2013
664
A.P. Yazdanpanah et al.
or higher costs are placed between nodes if they are adjacent or have gaps. The gaps between edges (nodes) are filled using interpolation by introducing dummy nodes with higher costs. This method is robust in nature but it is time consuming and depends heavily on certain parameters (e.g. tolerance of gap (tog) used for gap filling). Kim et al. [5] try to extract the sky line in cluttered and cloudy environments. First, they model the clutter and then, using an iterative scheme, they find the sky line using multistage edge filtering. Their approach is based on a limited scenario and requires modeling the clutter before the extraction of sky line which is not always available. Although not directly focused on the problem of sky segmentation, their method of ray-based color image segmentation can be easily adapted for sky segmentation. The image segmentation process of Xu et al. [6] models the segments as clusters with centroids and applies ray shooting from the centroids towards the boundaries. In their results of outdoor scenes, a single centroid is mostly found for the sky; hence, it can be used to distinguish the sky region from the non-sky regions. Their approach is robust as compared to the popular K-means and normalized graph cuts algorithms used for image segmentation. McGee et al. [1] have presented a sky segmentation technique based on color channels. In their approach, they try to find a linear separation (linear line) between sky and non-sky regions using Support Vector Machines (SVMs). Their approach is motivated by the objective of obstacle detection for small UAVs. The underlying assumption of this method is that a linear boundary divides the sky and non-sky region is not general enough and gets violated very often. The authors of [3] also assume that the horizon line is a line; they find the true horizon line among various candidates as the line that best segments the sky and non-sky regions. They have used various color and texture features (e.g., mean intensity values of three color channels, entropy, smoothness, uniformity and third moment etc.) to train several classifiers. Although their approach finds a good horizon line, the underlying assumption of the horizon line being linear is again not generally valid. The underlying assumption in the approach of Ettinger et al. [7] is also that the horizon line is linear. They model the sky and non-sky regions using Gaussian distributions and try to find the optimum boundary by dividing these two distributions. In [2], Croon et al. have addressed this issue using shallow decision trees (J48 Implementation of C4.5 algorithm) based on color and texture features. The choice of decision trees is motivated by the computational efficiency achieved at run time since their goal is to use sky segmentation for static obstacle avoidance by Micro Air Vehicles (MAVs). They have extended the features used in [3] and introduced new features such as cornerness, grayness feature and Fisher discriminant features etc. In contrast to [3], they have used an extended database to train their classifier and a large number of features; hence their approach is more robust and capable of finding nonlinear sky boundaries. Todorovic et al. [8] have tried to circumvent the earlier assumptions [7] of the horizon line being linear and modeling the sky/non-sky regions using Gaussian distributions. In [8], they built prior statistical models for sky and non-sky regions based on
Sky Segmentation by Fusing Clustering with Neural Networks
665
color and texture features. They argue the importance of both color (Hue and Intensity) and texture features (Complex Wavelet Transform) due to enormous variations in sky and ground appearances. A Hidden Markov Tree model was trained based on these features, yielding a robust horizon detection algorithm, capable of detecting non-linear horizons as well. Although color could provide significant information to a detector/classifier, the use of grayscale images is advantageous because of faster processing time. The proposed method employs grayscale image characteristics. Our goal is to obtain a precise skyline; thus the assumption of the horizon line being linear as in [1], [3], and [7] is not valid. Most of the methods discussed above have been evaluated using a limited dataset. The method in [3] was tested on two sets of 10 images yielding an accuracy in the range of 90-99%. In [4], experiments were conducted using 25 grayscale images. The method in [5] was tested using 38 images, yielding 84.2% accuracy. Croon et al. [2] addressed non-linear sky boundaries. The performance of their method depends on the proportion of the sky area in the test images. Precision over 90% has been attained on images which contain more than 25% of sky. The goal of our research is to develop a high performance method and evaluate it on a sufficiently large data set. The objective is to increase the True Positive rate while reducing False Positives. As machine learning techniques have shown good potential, our method uses a Neural Network (NN) classifier for pixel classification with successive refinements. A total of 16 features were used including raw intensity values and texture features. In a post-processing step, the output of the NN classifier is refined using geometric properties and some heuristics. The output of postprocessing is further refined by fusing it with clustering result obtained using K-means. The results of fusion are further post-processed. We discuss the effect of various parameters of the method and provide Receiver Operating Characteristic (ROC) curves using a large number of test images. The paper is organized as follows. Section 2 describes the proposed method for sky segmentation. Section 3 presents our experimental results. Conclusions and the future work are presented in Section 4.
2
Proposed Algorithm for Sky Segmentation
In our method, the classification of the image into sky and non-sky regions is performed by fusing the results of K-means clustering with those obtained using a NN classifier. Fig. 1 shows the block diagram of the proposed sky segmentation algorithm. First, we classify the input image into sky and non-sky regions using the NN classifier. The input to the NN classifier include pixel values and texture features extracted from 9 x 9 non-overlapping image blocks. The output is ‘1’ (for sky) or ‘0’ (for non-sky). The results of the NN classifier are post-processed and fused with the clustering results obtained using K-means clustering [9]. Finally, a second postprocessing stage produces a valid mask wherein ‘1’ marks the sky region and the rest is marked as “0”.
666
A.P. Yazdanpanah et al.
Fig. 1. Block diagram of our proposed sky segmentation method
2.1
Neural Network
Neural networks have been successfully applied to a variety of real world classification tasks in industry, business and science [10]. The NN used here is two-layer feedforward back-propagation network with 16 inputs, 20 nodes in the hidden layer and one output node indicating “1” for the sky; “0” for non-sky region (Fig. 2).
Fig. 2. Architecture of the Neural Network
The NN was trained using the gradient descent method. The features used were extracted from 9 x 9 non-overlapping blocks from 236 images selected randomly from our dataset. The NN was trained using pixel intensities and 15 texture features extracted from the patches (includes GLCM Features such as Dissimilarity, Energy, Entropy, Maximum probability, Sum entropy, Difference variance, Difference entropy, Inverse difference normalized, Inverse difference moment normalized,
Sky Segmentation by Fusing Clustering with Neural Networks
667
Homogeneity, Cluster Prominence, Information measure of correlation1, Information measure of correlation2, Cluster Shade) [11],[12],[13].The total number of training blocks for the sky region is 127679 and the total number of training blocks for the non-sky region is 408749. The result of the NN is a binary map of sky/non-sky region. Fig. 3 shows the NN output for a sample image.
Fig. 3. Left: input image; Right: NN output
2.2
Post-processing
In the first post-processing stage, we remove “non-sky” patches classified as “sky” and “sky” patches classified as “non-sky”. To be considered as part of the sky, a region should satisfy the following assumptions: 1- The size of the connected region in the sky part of the image should be larger than a certain threshold; the default value is 450 pixels for our dataset. 2- The connected region of the sky should be adjacent to the upper edge of the image, or should be connected to the upper n pixels of the image (default value of n is 10 pixels). 3- If the sky region is adjacent to either the left, right or bottom boundaries, then sky segmentation has failed. 4- If the region of sky appears in an internal portion of the image, the segmentation is considered false and that region is removed. 2.3
K-Means Clustering
K-means clustering is a method of cluster analysis which aims to partition n observations into k clusters where each observation belongs to the cluster with the nearest mean [9]. The method is applied to partition the image into k clusters; it outputs a label matrix, where each pixel is assigned a label of the cluster it belongs to. The default value for the number of means is 10. This value was obtained experimentally as shown in Section 3. A number of disjoint clusters can be assigned the same label ( … , where Num is a number of clusters ), so generally there could be regions with the label , that is, the output of clustering is , ,…, - disjoint clusters sharing label (Fig.4).
668
A.P. Yazdanpanah et al.
Fig. 4. Left: input image, middle: k-means result (k=10), Right: 106 disjoint clusters with label ) 8 shown from input image (left). ( , ,…,
2.4
Fusion Algorithm
At the fusion step, the algorithm checks if the size of the intersection between each region obtained using K-means and the corresponding region determined as sky in the post-processed NN results constitutes a certain part of the K-means clustered region. If this condition holds, the algorithm marks the whole region as sky. The algorithm uses a threshold to evaluate the relative size of the intersection. The default value is 0.5. In Section 3, we will show how the performance of the method is affected by the choice of the threshold. Next, all sky regions are merged together to produce the final binary map - matrix. Fig. 5 shows the pseudo-code for the fusion methodology, where - number of clusters. - final segmentation matrix (initially, zero matrix). - tunable threshold (between 0 and 1. – output matrix for post-processed neural network stage. , ,…, - clusters in matrix paired with/one to one relationship , ,…, clusters. with , ,…, -clusters in matrix paired with/one to one relationship with , , … , clusters. – number of pixels in . In the second post-processing stage, we use the same rules as in the first postprocessing stage, except Rule #1.
Fig. 5. Fusion algorithm
Sky Segmentation by Fusing Clustering with Neural Networks
3
Experimental Results
3.1
Database
669
The database used in this work consists of 1482 (1038x1388) grayscale images taken by two Hazcams (hazard avoidance cameras) cameras on NASA’s Mars rovers. Hazcams are photographic cameras sensitive to the visible light. They have a wide field of view (approximately 120° both horizontally and vertically) to allow a large amount of terrain to be visible. They are mounted on the front and rear of NASA's Mars rovers. These images are used by the rover to autonomously navigate around hazards.
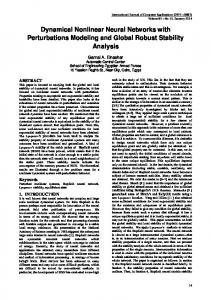
Receiver Operating Characteristic (NN) 0.96 Th =0.1
0.94
Th =0.2
True Positive Rate
0.92
Th =0.3 Th =0.4
0.9 Th =0.5 Th =0.6
0.88
Th =0.7
0.86 0.84
Th =0.8
0.82 Th =0.9
0.8 0.01
0.015
0.02
0.025 0.03 0.035 0.04 False Positive Rate
0.045
0.05
0.055
Receiver Operating Characteristic (Fusion) 1 Th = 0.2 Th = 0.5 Th = 0.4 Th = 0.3
Th = 0.1
Th = 0.6
True Positive Rate
0.98
0.96
Th = 0.7
0.94
Th = 0.8
0.92
0.9 Th = 0.9
0.88 0
0.5
1
1.5 2 False Positive Rate
2.5
3
3.5 -3
x 10
Fig. 6. ROC curves (top: NN only, bottom: proposed fusion method)
670
3.2
A.P. Yazdanpanah et al.
Evaluation
We have manually labeled the boundary between the sky and the ground, creating an accurate ground truth in the form of binary maps. For evaluation, we calculate the true positive (TP), false negative (FN), false positive (FP), and true negative (TN) rates. and rates for images in the database is calculated as The total value of follows, ∑ ∑ ∑ ∑
The ROC curves for the NN classifier and the proposed fusion method are shown in Fig. 6. As it can be observed, the approach based on fusion shows better performance than the NN method. Also, the effect of different number of clusters (K) can be seen in Fig. 7. In this figure, five sets of ROC curves are presented for five different values of K. We observe that for k ≥ 10 the performance does not change significantly but as the value of K gets larger, the implementation is more computationally expensive. Therefore, the value of K was set to 10. TPR= 0.9886 and FPR= 4.0461 10 are obtained for K=10. Fig. 8 shows segmentation results for some test images in our dataset.
Receiver Operating Characteristic 1
0.98
True Positive Rate
0.96
0.94
0.92 k=6 k=8 k=10 k=12 k=14
0.9
0.88
0.86
0
0.5
1
1.5 2 2.5 False Positive Rate
3
3.5
4 -3
x 10
Fig. 7. ROC for different number of clusters in K-means clustering
Sky Segmentation by Fusing Clustering with Neural Networks
671
Fig. 8. Experimental results for six test images. From left to right: input images, ground truth maps, NN results, and results by the proposed method.
4
Conclusions and Future Work
The main contribution of this paper is the development of a highly accurate method for sky segmentation. This is an important task for NASA’s rover tasks such as route planning, and path finding as well as for path planning and control of air- and ground unmanned vehicles. Due to the diversity of skylines and clouds, sky segmentation is a challenging task. We have proposed an automated framework for segmenting images into sky and non-sky regions by fusing K-means clustering with NN classifications. The method involves two post-processing steps which depend on certain parameters.
672
A.P. Yazdanpanah et al.
We have analyzed the performance of the method with regards to these parameters. For future work, we plan to optimize the feature set and implement the method in hardware. This will make the algorithm well-suited for the real-time applications. Acknowledgment. This research was supported by NASA EPSCoR under cooperative agreement No. NNX10AR89A.
References 1. McGee, T.G., Sengupta, R., Hedrick, K.: Obstacle Detection for Small Autonomous Aircraft Using Sky Segmentation. In: International Conference on Robotics and Automation (ICRA 2005), pp. 4679–4684 (2005) 2. de Croon, G.C.H.E., Remes, B.D.W., De Wagter, C., Ruijsink, R.: Sky Segmentation Approach to Obstacle Avoidance. In: IEEE Aerospace Conference, pp. 1–16 (2011) 3. Fefilatyev, S., Smarodzinava, V., Hall, L.O., Goldgof, D.B.: Horizon detection using machine learning techniques. In: 5th International Conference on Machine Learning and Applications (ICMLA 2006), pp. 17–21 (2006) 4. Lie, W.-N., Lin, T.C.-I., Lin, T.-C., Hung, K.-S.: A robust dynamic programming algorithm to extract skyline in images for navigation. Pattern Recognition Letters 26, 221–230 (2005) 5. Kim, B.-J., Shin, J.-J., Nam, H.-J., Kim, J.-S.: Skyline Extraction using a Multistage Edge Filtering. World Academy of Science, Engineering and Technology 55, 108–112 (2011) 6. Xu, C., Lee, Y.J., Kuipers, B.: Ray-based Color Image Segmentation. In: Canadian Conference on Computer and Robot Vision, pp. 79–86 (2008) 7. Ettinger, S.M., Nechyba, M.C., Ifju, P.G., Waszak, M.: Vision-Guided Flight Stability and Control for Micro Air Vehicles. In: IEEE Int. Conf. on Intelligent Robots and Systems, pp. 2134–2140 (2002) 8. Todorovic, S., Nechyba, M.C., Ifju, P.G.: Sky/Ground Modeling for Autonomous MAV Flight. In: International Conference on Robotics and Automation (ICRA 2003), pp. 1422– 1427 (2003) 9. Seber, G.A.F.: Multivariate Observations. John Wiley & Sons, Inc., Hoboken (1984) 10. Widrow, B., Rumelhard, D.E., Lehr, M.A.: Neural networks: Applications in industry, business and science. Commun. ACM 37, 93–105 (1994) 11. Soh, L., Tsatsoulis, C.: Texture Analysis of SAR Sea Ice Imagery using Gray Level CoOccurrence Matrices. IEEE Transactions on Geoscience and Remote Sensing 37(2), 780– 795 (1999) 12. Haralick, R.M., Shanmugam, K., Dinstein, I.: Textural Features of Image Classification. IEEE Transactions on Systems, Man and Cybernetics, SMC 3(6), 610–621 (1973) 13. Clausi, D.A.: An analysis of co-occurrence texture statistics as a function of grey level quantization. Can. J. Remote Sensing 28(1), 45–62 (2002)