CORTICAL ENERGY REGULATION AS WAKE TIME INCREASES
Changes in Components of Energy Regulation in Mouse Cortex with Increases in Wakefulness Elena V. Nikonova, MD1,2; Nirinjini Naidoo, PhD*1; Lin Zhang, MD1; Micah Romer, BS1; Jacqueline R. Cater, PhD1; Matthew T. Scharf, MD, PhD1; Raymond J. Galante, BS1; Allan I. Pack, MBChB, PhD*1 *Co-senior authors Center for Sleep and Respiratory Neurobiology, University of Pennsylvania School of Medicine, Philadelphia, PA; 2Molecular Profiling and Research Informatics, Merck Sharp & Dohme, West Point, PA (current affiliation) 1
Study Objectives: Increases in ATP production machinery have been described in brain after 3 h of sleep deprivation. Whether this is sustained with longer durations of extended wakefulness is unknown. We hypothesized that energy depletion could be a mechanism leading to difficulty maintaining wakefulness and assessed changes in components of the electron transport chain. Design: Protein levels of key subunits of complexes IV and V of the electron transport chain (COXI, COXIV, ATP5B) and uncoupling protein 2 (UCP2) in isolated mitochondria by Westerns in mouse cerebral cortex after 3 and 12 h of sleep deprivation were compared to that in control mice. Activity of complex IV enzyme and relevant transcription factors—Nrf1, Nrf2 (Gabp), and phosphorylation of AMP-dependent kinase (AMPK)—were also assessed. Participants: 8-10 week old C57BL/6J male mice (n = 91). Interventions: 3, 6, and 12 h of sleep deprivation. Measurements and Results: After both 3 and 12 h of sleep deprivation, complex IV proteins and enzyme activity were significantly increased. The complex V catalytic subunit was significantly increased after 12 h of sleep deprivation only. Increased levels of UCP2 protein after 12 h of sleep deprivation suggests that there might be alterations in the ATP/AMP ratio as wakefulness is extended. That phosphorylation of AMPK is increased after 6 h of sleep deprivation supports this assertion. The increase in Nrf1 and Nrf2 (Gabp) mRNA after 6 h of sleep deprivation provides a mechanism by which there is up-regulation of key proteins. Conclusions: There are complex dynamic changes in brain energy regulation with extended wakefulness. Keywords: Sleep deprivation, sleep, mitochondria, oxidative phosphorylation, uncoupling protein 2, nuclear respiratory factor Citation: Nikonova EV; Naidoo N; Zhang L; Romer M; Cater JR; Scharf MT; Galante RJ; Pack AI. Changes in components of energy regulation in mouse cortex with increases in wakefulness. SLEEP 2010;33(7):889-900.
HUMANS CAN MAINTAIN WAKEFULNESS FOR 16 H BUT BEYOND THIS TIME THERE IS EVIDENCE OF PERFORMANCE IMPAIRMENT.1 USING electroencephalographic (EEG) recordings, periods of “micro-sleep,” as evidenced by increases in delta power, can be detected in mice after 6 h of induced wakefulness, though such animals stay visibly and intentionally active.2 Thus, the duration of wakefulness that can be sustained in mice is shorter than humans. The mechanisms, which set the duration of wakefulness that can be sustained, are currently unknown. The energy hypothesis proposed by Benington and Heller3 posits that as wakefulness is prolonged, there is ATP depletion that limits wakefulness and promotes sleep.4 In support of this hypothesis are observations that with sustained wakefulness increases in extracellular adenosine occur in cerebral cortex5 and basal forebrain,6-8 and further that increases in adenosine promote sleep.6,7 Recent evidence indicates that one of the sources of adenosine that promotes sleep is from glial cells.9
Energy depletion during wakefulness is proposed to occur because there are increased energy demands as a result of increased neuronal activity.10-12 Increased neuronal depolarization consumes newly synthesized ATP.13 ATP is produced by the oxidative phosphorylation system (OXPHOS) located in the inner mitochondrial membrane,14,15 a system that is highly developed in neurons.15 In mammals, the OXPHOS system comprises five tightly regulated multi-subunit enzyme complexes, namely complexes I to V; transcripts of these subunits originate from both nuclear and mitochondrial genomes and are expressed in a tissue-specific fashion.16 Not surprisingly, given the increased need for ATP during wakefulness, there is evidence of up-regulation of the OXPHOS system in wakefulness. Increased transcript levels from both mitochondrial (Nadh2 - complex I, or NADH: ubiquinone oxidoreductase, EC 1.6.5.3; Cox1 - complex IV, or cytochrome-c oxidase, EC 1.9.3.1; and 12S rRNA) and nuclear (Cox4 – complex IV, and Atp5a - complex V, or ATP synthase, EC 3.6.3.14) genes have been shown after 3 h of wakefulness or sleep deprivation in mammalian cortex.17-21 An early up-regulation of the mitochondrial encoded catalytic subunit 1 mRNA of complex IV (Cox1), with 3 h of sleep deprivation has also been shown in Drosophila melanogaster.22 In addition to transcriptional up-regulation, increased activity of COX enzyme, the key enzyme in respiratory control,23,24 has been described after 3 h of sleep deprivation in multiple brain regions in rat, including cerebral cortex.25 But whether this up-regulation of the oxidative phosphorylation system is maintained as wakefulness is prolonged is currently unknown.
Submitted for publication April, 2009 Submitted in final revised form February, 2010 Accepted for publication March, 2010 Address correspondence to: Allan I. Pack, MBChB, PhD, Center for Sleep and Respiratory Neurobiology, University of Pennsylvania School of Medicine, Translational Research Laboratories, Suite 2100, 125 South 31st Street, Philadelphia, PA 19104-3403; Tel: (215) 746-4806; Fax: (215) 746-4814; E-mail:
[email protected] SLEEP, Vol. 33, No. 7, 2010
889
Electron Transport Chain in Extended Wakefulness—Nikonova et al
There is some evidence that it may not be. After 8 h of sleep deprivation, Cox1 mRNA in rat cerebral cortex is no longer upregulated.17,20 Thus, the first goal of our study was to evaluate whether with longer durations of extended wakefulness there was loss of the up-regulation of the key components of the oxidative phosphorylation system. Another regulator of this oxidative phosphorylation system is uncoupling proteins. There is a family of such proteins with UCP2, UCP4 and UCP5 being expressed in brain.26,27 The mRNA for Ucp2, one of the isoforms of uncoupling proteins that is found in brain,27,28 and highly expressed in neurons,28 is up-regulated in the cerebral cortex of rats after 8 h of sleep deprivation.29 Increased UCP2 may contribute to dissipation of protons instead of coupled ATP production.30 This might decrease reactive oxygen species (ROS) generation and play a neuroprotective role.31-33 It is not known, however, whether the protein level of UCP2 is increased during extended wakefulness. There is translational control of UCP2 such that mRNA and protein levels can be dissociated.34 Hence, we studied changes in UCP2 at the protein level and investigated the time course of change as wakefulness was prolonged. Thus, we examined changes in different aspects of regulation of cellular energy status in mouse brain with short and longer term sleep deprivation at the protein level. We assessed differences between mice that were sleep deprived from those allowed to sleep spontaneously and sacrificed at the same time of day. We measured by Westerns, protein levels of both mitochondrial-encoded (COXI), and nuclear-encoded (COXIV and ATP synthase catalytic subunit 5B [ATP5B]) OXPHOS subunits, and additionally measured complex IV (COX) enzyme activity to assess whether changes in proteins are reflected in altered enzyme activity. Since enzyme activity is assessed in absolute units, we also measured enzyme activity at 07:00 (lights on) to provide a baseline measure. We also assessed whether there was increased uncoupling protein UCP2 with extended wakefulness, i.e., after 3 and 12 h of sleep deprivation. The changes we are studying could be due to a number of different regulatory mechanisms. These regulatory mechanisms were assessed at an intermediate timepoint between 3 and 12 h by comparing levels in mice sleep deprived for 6 h with those that were allowed to sleep spontaneously for 6 h following lights on. Part of the differences we observed could be due to transcriptional regulation by the nuclear respiratory factors NRF1 and NRF2 (Gabp) and the transcriptional co-activator peroxisome proliferator-activated receptor gamma co-activator 1 alpha (PGCa).35,36-38 Levels of these transcription factors are dependent on neuronal activity.39,40 Moreover, these transcription factors alter expression of a number of genes for proteins in the electron transport chain and also uncoupling protein 2 (UCP2).41,42 Thus, we studied whether there was alteration in these molecules at the mRNA level in cerebral cortex between sleep deprived and sleeping mice. Another regulatory mechanism that could be operational is that mediated by phosphorylation of AMP-dependent kinase (AMPK). Reduction in the intracellular ATP/AMP ratio leads to increased activity of 5’-AMP-activated protein kinase (AMPK, EC 2.7.11.1), a key enzyme regulating cellular energy status.43,44 Activation occurs through phosphorylation of threonine 172 within the catalytic subunit α of AMPK. Cellular metabolism is shifted toward reduction in energy utilization and increases in energy supply upon activation of AMPK.43-48 SLEEP, Vol. 33, No. 7, 2010
Assessing changes in phosphorylation of α-AMPK between sleep and sleep deprivation will provide evidence whether sleep loss leads to an alteration in the cellular energy status, specifically the ATP/AMP ratio. Assessing this is, however, not trivial since capturing the phosphorylation state of the enzyme requires sacrifice by microwave, since without this phosphorylation of AMPK changes rapidly post-mortem.49 Moreover, there are two isoforms of α-AMPK. Measuring the phosphorylation of each separately following immunoprecipitation provides a more sensitive assessment of changes in phosphorylation state of the enzyme.50 We used this approach to assess differences in phosphorylation of AMPK between mice allowed to sleep spontaneously for 6 h from those sleep deprived for the same time period. All studies were done in mouse cerebral cortex to parallel previously described transcriptional changes in the energy system,17,18,21,29 thereby addressing changes in one of the most active brain areas during wakefulness. METHODS Animal Handling and Behavioral Assessment All experiments were performed on C57BL/6J male mice, 8-10 weeks old, and maintained on a 12:12 light/dark cycle (lights on at 07:00). Animals were kept in individual cages in a sound-attenuated room with ambient temperature 23.5°C ± 1.0°C, humidity 40% ± 5%, and light intensity of 50-60 lux measured at the level of the mice with water and food available ad libitum. Mice were allowed to acclimate to their new environment for at least 2 weeks before starting any experiments. Animal handling and experimental procedures followed the National Institutes of Health Guide for the Care and Use of Laboratory Animals and were approved by the Institutional Animal Care and Use Committee of the University of Pennsylvania. Following acclimation, a 3-day baseline behavioral assessment was performed using infrared beam breaking activity monitors (AccuScan Instruments, Inc., Columbus, OH). Total activity was measured in 10-sec epochs, i.e., 8,640 epochs per 24 h. Estimates of sleep and wake were determined using an algorithm developed in our lab that defines sleep as ≥40 sec of continuous inactivity. We have shown that this definition of sleep/wake has an 88%-94% agreement in individual mice across 8,640 epochs with simultaneous EEG/EMG-defined sleep or wakefulness in 10-week-old male C57BL/6J mice.51 The average sleep across the day in the mice studied in this validation study was 59.4 min/2 h and the algorithm based on sleep being considered as ≥ 40 sec of continuous inactivity estimated this with a 1.0-min error. For the studies described in this report, we used this algorithm to estimate sleep for each of the experimental animals and, where appropriate, to establish an inclusion criteria. We did not record sleep by the electroencephalogram (EEG). Sleep deprivation was conducted by gentle handling as previously described.17,20,25 We acclimated mice to this procedure for several days before performing sleep deprivation. Our experimental design varied slightly for studies involving Western analysis and COX enzyme activity. Animals for Western analysis.
There were 5 groups of animals in studies for Westerns, with 6-8 animals per group. Starting at lights on (07:00), 2 groups 890
Electron Transport Chain in Extended Wakefulness—Nikonova et al
were sleep deprived by gentle handling for 3 and 12 h, respectively (3SD, 12SD), while 2 other groups (matching controls) were allowed to sleep spontaneously undisturbed and were sacrificed at either 3 or 12 h from lights on (3C, 12C). For an animal to be included in the sleep group sacrificed 3 h after lights on, the mouse had to have more than 75% of the previous 3 h being estimated as sleep.17,20,25 To be included in the sleep group sacrificed 12 h after lights on, the mouse had to spend more than 70% of the 12 h period being estimated as sleep as well as 75% or more of estimated sleep in the last 3 h before sacrifice. Animals not meeting these criteria were not included in our study. The final group of animals was the spontaneous wake group, which included animals who had been spontaneously awake during the 3 h period from lights off (19:00) for more than 75% (3SW) and were sacrificed at 22:00. This design was used for studies of the OXPHOS subunits and UCP2.
corpus callosum. For OXPHOS Westerns and COX activity experiments, fresh tissue from each mouse was immediately homogenized in ice-cold medium containing 70 mM sucrose, 220 mM mannitol, 1.5 mM HEPES, 2 mM EDTA, 0.05% (pH = 7.4) bovine serum albumin (BSA) and centrifuged for isolation of mitochondria. Isolation of Mitochondria Mitochondria were isolated immediately from fresh tissue by two-step differential centrifugation as previously described.25,54 Briefly, microdissected tissue was homogenized in a glass Dounce homogenizer (Wheaton, Inc., Millville, NJ) using icecold isolation medium (70 mM sucrose, 220 mM mannitol, 1.5 mM HEPES, 2 mM EDTA, 0.05% BSA, pH = 7.4) in 1:8 w/v ratio, followed by centrifugation at 600 x g for 15 min. Supernatants containing mitochondria were collected and centrifuged again at 600 x g prior to 10,000 x g centrifugation for 15 min. Pellets from high-speed centrifugation were washed twice in isolation medium without BSA (1:10 v/v ratio), spun at 10,000 x g for 15 min and stored at −70ºC until used for Western blotting. For experiments assessing cytochrome-c oxidase activity, freshly obtained mitochondria were immediately incubated with 0.002% digitonin for 2 min on ice to generate phospholipid-enriched outer membrane-free mitoplasts as described.54 Following a triple wash in isolation medium, mitoplasts were harvested by centrifugation at 10,000 x g for 15 min, and stored at –70���������������������������������������������������� °��������������������������������������������������� C. Measurements of mitochondrial protein concentration were run in triplicate with a micro-BCA kit (Pierce Biotechnology, Inc., Rockford, IL) using a VERSAmax microplate reader (Molecular Devices, Sunnyvale, CA).
Animals for study of activity of COX enzyme
There were 5 groups of animals in this study with 6-8 animals per group. Utilizing the criteria described above, we had the following groups: 3 and 12 h sleep deprived (3SD, 12SD sacrificed at 10:00 and 19:00, respectively); 3 h spontaneously wake group (3SW) sacrificed at 22:00; and a 3 h spontaneous sleep group (3C) sacrificed 3 h after lights on (10:00). In addition we used a group of mice that were left undisturbed and sacrificed at lights on (07:00, time zero). Animals for study of mRNA for Nrf1, Nrf2 (Gabp), and Pgc1a
For these studies, there were 3 groups of animals (n = 8 in each group). One group was sacrificed at lights on (07:00), i.e., time zero. The second group was allowed to sleep undisturbed and sacrificed 6 h after lights on (spontaneous sleep group). The third group (sleep deprived group) was sleep deprived for 6 h starting at lights on and sacrificed at the same diurnal time as the spontaneous sleep group.
Assessment of Activity of Cytochrome-c Oxidase Cytochrome-c oxidase activity was measured by detecting a decrease in the absorbance of reduced cytochrome c at 550 nm25,55,56 using a DU530 Life Sciences UV/Vis Spectrophotometer (Beckman). Cytochrome c from equine heart (Sigma-Aldrich, Inc., St. Louis, MO) was reduced in 0.05% ascorbic acid (Sigma-Aldrich, Inc., St. Louis, MO), followed by dialysis at 4ºC and stored in aliquots at –70���������������������������� °��������������������������� C. Samples from all experimental groups were run simultaneously on each experimental day. Reaction of cytochrome-c oxidation was conducted in 1 ml medium containing 10 mM phosphate buffer pH 7.4, 0.02% lauryl maltoside (Sigma-Aldrich, Inc., St. Louis, MO) and 1 mg mitochondrial protein. Absorbance was continuously measured for 1 min at 550 nm before and after the addition of 40 ������ m����� M reduced cytochrome-c. First-order rate constants were calculated from mean slope values of 3 to 4 measurements. Enzyme activity was expressed as pmol of cytochrome-c oxidized by 1 mg mitochondrial protein during 1 min using 21.1 mmol-1 x cm-1 extinction coefficient.54 The reducing capacity of cytochromec was monitored by calculating A550/A565 absorbance ratio. Aliquots of whole mouse brain mitochondria were routinely run on all experimental days to ensure the assay consistency.
Animals for study of phosphorylation of AMP-dependent kinase (AMPK)
Two groups of C57BL/6J mice were studied (n = 9 in each group). One group was allowed to sleep spontaneously for 6 h before sacrifice. The other group was sleep deprived for 6 h and sacrificed at the same time of day. Mice were sacrificed by focused microwave irradiation. A Murosachi Microwave Application Model TMW-4012C (Stoelting, Wood Dale, IL) was used with a power setting of 3.5 kW applied for 0.9 sec using the technique described previously.52 Tissue dissection and preparation of cerebral cortex samples
Animals were sacrificed by cervical dislocation. Brains were quickly removed and dissected on ice following the guidelines for the mouse brain atlas by Franklin and Paxinos.53 Briefly, the first coronal cut was performed 1 mm rostral to the point where the optic nerves merge to form the optic chiasm, and the second cut approximately 1 mm caudally to the optic chiasm. From the resulting slice, the left and right parts of the cerebral cortex containing cingulate cortex (Cg1 and Cg2), primary and secondary motor areas (M1 and M2), as well as the somatosensory cortex (S1 and S2), were separated from the subcortical structures along the SLEEP, Vol. 33, No. 7, 2010
Western Blots Studies of subunits of enzymes in electron transport chain
For the OXPHOS experiments, protein samples of isolated mitochondria from cerebral cortex were separated on 10-20% SDS891
Electron Transport Chain in Extended Wakefulness—Nikonova et al
PAGE pre-cast Tris-HCl gradient gels (Bio-Rad, Hercules, CA) and transferred to Hybond-P PVDF 0.45 ���������������� m��������������� m membrane (Amersham Biosciences, Piscataway, NJ) in Towbin buffer (25 mM Tris-base, 195 mM glycine, 0.01% SDS [w/v], and 20% methanol [v/v]). 10-15 μg mitochondrial protein samples were loaded for anti-OXPHOS complex IV subunits I (COXI) and IV (COXIV) and anti-OXPHOS complex V subunit β (ATP5B), and 25 μg for anti-UCP2 immunoblot experiments. A pooled whole brain mitochondrial sample obtained from 5 mice was run on every gel for reference purposes. Each protein sample was run in duplicate and each gel contained two control and two experimental conditions. Following transfer, blots were blocked in 5% milk/PBS0.05% Tween for 1 h, incubated overnight at 4°C with a relevant primary antibody: mouse monoclonal for COXI 1:5000, COXIV 1:2000, or ATP5B 1:2000 (Molecular Probes, Portland, OR). A rabbit polyclonal antibody was used for UCP2 1:500 (Chemicon International, Temecula, CA). Following washing in PBS (0.05%), blots were incubated for 1 h at room temperature with secondary horseradish peroxidase (HRP)-conjugated anti-mouse or anti-rabbit antibody at 1:1000 dilution each (Amersham Biosciences, Piscataway, NJ). For COXI (57 kDa) and COXIV (19.6 kDa), immunoblottings were performed utilizing the same blots after recycling them once using a Western Blot Recycling Kit (Alpha Diagnostic International, San Antonio, TX).
was synthesized using 0.5 μg total RNA and TaqMan Reverse Transcription Reagents (Applied Biosystems, Foster City, CA). The following sets of primers and probes for the relevant genes (listed in parentheses) were used: Mm00447996_m1 (Nrf1); Mm00484598_m1 (Nrf2 [Gabpa]); Mm01208835_m1 (Pgc1a) and Mm00545877_m1 (Apc). Each PCR reaction was repeated in triplicate. The relative transcript level was established by the “ΔΔ method” as described previously.57 The Apc (adenomatosis poliposis coli) gene was used as an internal standard; this gene was identified as unchanged in its expression either during sleep or sleep deprivation in the cerebral cortex and hypothalamus of C57BL/6J mice.58 Assessment of Phosphorylation of AMPK Cortical lysates (600 mg protein) were pre-incubated and pre-cleared with 10 mL of Protein-G Sepharose beads for 1 h at 4°C. Following centrifugation, the lysates were immunoprecipitated with either 2 µg of antibody for α-a/1 (cat#sc-19128; Santa Cruz Biotechnology, Santa Cruz, CA) or α-2 (cat#sc-19131; Santa Cruz Biotechnology, Santa Cruz, CA) overnight at 4°C, then bound to 50 mL Protein-G beads (cat#15920-010; Invitrogen, Carlsbad, CA) by incubation for 1.5 h at 4°C. The protein bound beads were subsequently washed three times in lysis buffer, then incubated with 50 µL of Laemmli buffer containing 5% β-mercaptoethanol for 5 min. Bound protein was resolved by 10% SDS-PAGE under reducing conditions and transferred to PVDF membranes for western analysis using the phosphoα-AMPK antibody (cat#2532; Cell Signaling, Danvers, MA) at a 1:1000 dilution. The blots were then incubated with an infrared-conjugated anti-rabbit secondary antibody (cat#92632221; LI-COR, Lincoln, NE) room temperature for 1 h in the dark. Membranes were read on an Odyssey Infrared Scanner (cat#9201-01; LI-COR, Lincoln, NE). Quantification was conducted using the Odyssey software as described above.
Studies of UCP2
Gels were run as described above in animals from groups at all time points. Blots were blocked in Odyssey Buffer (LI-COR, Inc., Lincoln, NE) for 1 h at room temperature and incubated overnight at 4��������������������������������������������� °�������������������������������������������� C with C-terminus raised polyclonal UCP2 antibody at 1:1000 (Santa Cruz Biotechnology, Inc., Santa Cruz, CA). After a series of 3 washes of 10 min each, blots were then incubated with infrared-conjugated IRDye 800 anti-goat secondary antibody at 1:5000 (Rockland, Inc., Gilbertsville, PA) for 1 h at room temperature. Single bands corresponding to UCP2 protein were visualized using the Odyssey Imaging System (LI-COR, Inc., Lincoln, NE).
Statistical Analysis A mixed model ANOVA was used to assess overall differences among sleep deprived and control groups. The model contained terms for the fixed effect of group and a random factor which accounted for replications within gel. Following the overall hypothesis test among groups, specific planned comparisons were used to determine the effect of sleep deprivation at the 3, 6, and 12-h time periods relative to controls. In addition, the effect of gentle handling was assessed by comparing the 3 h spontaneous wake group to the 3 h sleep deprivation group for each assay. For certain comparisons, a Student’s t-test was used.
Analysis of Western Blots Blots were visualized using a SuperSignal Western Pico kit (Pierce Biotechnology, Inc., Rockford, IL) and a computer-assisted Alpha Innotech FluorChem 8900 (IMGEN Technologies, New City, NY) imaging analysis system or Odyssey Imaging System (LI-COR, Inc., Lincoln, NE). Averages of 2-3 measurements of band densities of each sample were individually compared to the reference whole brain mitochondrial sample to generate within-gel ratios of samples to whole brain reference for both control and experimental samples (see examples in Figure 1A-B).
RESULTS
Assessment of Changes in mRNA for Nrf1, Nrf2 (Gabp) and Pgc1a The expression of Nrf1, Nrf2 (Gabpa) and Pgc1a genes in the cerebral cortex of C57BL/6J mice during sleep and in sleep deprivation was established by quantitative RT-PCR using the TaqMan Gene Expression Assays and 7500 real time PCR system (Applied Biosystems, Foster City, CA). Total RNA was isolated with Trizol (Invitrogen) and further cleaned using a RNeasy purification kit (Qiagen, Valencia, CA). cDNA SLEEP, Vol. 33, No. 7, 2010
OXPHOS Proteins are Increased with Extended Wakefulness We addressed whether OXPHOS protein expression changes after 3 h of sleep deprivation compared to 3 h sleep, i.e., undisturbed control animals sacrificed at the same diurnal time (10:00), and after 12 h of sleep deprivation compared to undisturbed controls sacrificed at the same diurnal time (19:00). We also compared protein levels after 3 h of sleep deprivation (10:00) and 3 h of spontaneous wake (22:00) to evaluate the effect, if any, of handling, i.e., the method used to produce sleep 892
Electron Transport Chain in Extended Wakefulness—Nikonova et al
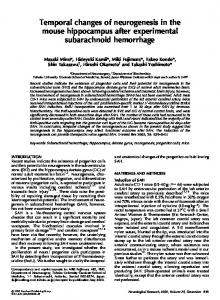
A
3C
3SD
Whole brain mitochondria COXI, 57 kDa
COXIV, 19.6 kDa
ATP5B, 12.3 kDa
B
12C
12SD
Whole brain mitochondria
COXI, 57 kDa
COXIV, 19.6 kDa
ATP5B, 12.3 kDa
Figure 1—Representative immunoblots of OXPHOS proteins–COXI, COXIV, and ATP5B–after 3 h (panel A) and 12 h (panel B) of spontaneous (undisturbed) sleep (3C, 12C) and sleep deprivation (3SD, 12SD). Each blot shows a single biological replicate run in duplicate. 3-6 gels each had a sleep deprived group and a spontaneous sleep group and were run using 2-3 biological replicates per group in duplicate. Normalization was done using the expression of target protein (COXI, COXIV, ATP5B) in a whole brain mitochondria sample run on every gel.
deprivation. Examples of Western blots in different experimental conditions are shown in Figure 1 (see Methods). For the mitochondrial encoded catalytic COXI subunit of complex IV the overall p-value for group differences was significant (P = 0.001; F5,15 = 7.27). There were significant increases in protein levels after both 3 and 12 h of sleep deprivation compared to undisturbed controls sacrificed at the same diurnal time (P = 0.0004 and 0.014, respectively; Figure 2A). COXI protein levels were increased on average 33% after 3 h of sleep deprivation and 48% after 12 h of deprivation. There was not a SLEEP, Vol. 33, No. 7, 2010
significant difference in COXI level after 3 h of sleep deprivation compared to 3 h of spontaneous wake (P = 0.146; Figure 2A), which was indicative of no effect of gentle handling. Significant differences among means were also found for the nuclear encoded COXIV subunit of complex IV (P < 0.0001; F5,30 = 153.3). Significant increases in nuclear encoded COXIV subunit of complex IV were found after 3 h (+51%) and 12 h (+16%) of sleep deprivation compared to undisturbed diurnal controls (P < 0.001 and 0.037, respectively; Figure 2B). We found no evidence that gentle handling up-regulated the level of 893
Electron Transport Chain in Extended Wakefulness—Nikonova et al
B
**
1.0 0.5 0.0
0.5
3S
D
/3
SW
2C /1 SD
/3 3S
D
/1 SD 12
SW
2C
C D 3S
12
3S
D
SD
/3
/1
/3
2C
C /3 D 3S
1.0
0.0
SW
0.0
1.5
12
0.5
*
C
1.0
1.5
/3
***
*
D
1.5
ATP5B 2.0
***
2.0
Fold change
Fold change
COXIV
**
3S
COXI 2.0
C
Fold change
A
Figure 2—Effects of 3 and 12 h of sleep deprivation on protein level of OXPHOS subunits in mouse cerebral cortex: (A) mitochondrial catalytic COXI subunit of complex IV; (B) nuclear COXIV subunit of complex IV; and (C) nuclear catalytic ATP5B subunit of complex V. Data are mean and standard deviation of fold change between groups (n = 6-8 per group). Left to right: after 3 h of sleep deprivation (3SD) compared to 3 h of spontaneous sleep (3C, grey bar); after 12 h of sleep deprivation (12SD) compared to undisturbed matching control (12C, dark grey bar); and after 3 h of sleep deprivation (3SD) compared to 3 h of spontaneous wake (3SW, black bar). COXI, COXIV protein levels are significantly increased after both 3 and 12 h of sleep deprivation compared to undisturbed diurnal controls while ATP5B level is significantly increased only after 12 h of sleep deprivation. Note that COXIV protein expression is significantly lower after 3 h of sleep deprivation compared to 3 h of spontaneous wake. Legend: 3SD–3 h of sleep deprivation (lights on); 3C–3 h of spontaneous sleep (lights on); 12SD–12 h of sleep deprivation (lights on); 12C–12 h after lights on (12 h spontaneous sleeping group); 3SW–3 h of spontaneous wake (lights off); *P < 0.05; **P < 0.01; ***P < 0.001
Cytochrome c oxidized, pmol/ug/min
There were also significant differences among groups for ATP5B (P < 0.0001; F5,33 = 32.7). Protein levels of nuclear encoded catalytic ATP5B subunit of complex V were increased only after 12 h of sleep deprivation as compared to undisturbed diurnal controls (P = 0.033; see Figure 2C). This increase was 41%. There was not a significant effect of sleep deprivation at 3 h compared to undisturbed controls (P = 0.152). ATP5B protein after 3 h of sleep deprivation was also not significantly different compared to 3 h of spontaneous wake (P = 0.120; Figure 2C). Thus, gentle handling had no significant effect on the level of this protein.
COX activity
7.5
**
7.0 6.5
*
6.0 5.5 5.0 4.5
H) (1
9:0
0-
SD 12
0:0 3S
D
(1
(2 W 3S
Activity of Cytochrome-c Oxidase Is Increased after Both 3 and 12 h of Sleep Deprivation For COX enzyme activity in cerebral cortex, there was a significant main effect of group (P = 0.012; F4,9 = 5.87; see Figure 3) although the only significant difference was between 3 h of sleep deprivation (mean ± SD 6.51 ± 0.50) and 3 h of spontaneous sleep (mean ± SD 5.68 ± 0.45; P = 0.011) (Figure 3). In particular, there was no significant difference in COX activity between the groups with 3 and 12 h of sleep deprivation, or between the 07:00 lights on group and 3 h of spontaneous sleep. There was also no significant difference between enzyme activity in the group who were sleep deprived for 12 h and other groups.
0-
H)
0) 2:0
0) 0:0 (1 3C
07
:00
4.0
Figure 3—Enzymatic activity of OXPHOS complex IV (COX) increases with wakefulness in mouse cortex. Data are mean and standard deviations of absolute values measured per 1 µg protein from isolated mitochondria. Left to right: COX activity for mice sacrificed at 07:00 (lights on, n = 7); after 3 h of spontaneous sleep (3C, n = 6); after 3 h of spontaneous wake (3SW, n = 8); after 3 h of sleep deprivation (3SD, n = 6); and 12 h of sleep deprivation (12SD, n = 6). There is a significant increase in COX activity after 3 h of sleep deprivation (3SD) compared to 3 h of spontaneous sleep (3C). No significant changes in COX activity were found between 3 (3SD) and 12 (12SD) h of sleep deprivation. The time of sacrifice is given below each bar. H indicates groups that were sleep deprived by handling. Legend: 07:00–time zero (lights on); 3C–3 h of spontaneous sleep (lights on); 3SW–3 h of spontaneous wake (lights off); 3SD–3 h of sleep deprivation (lights on); 12SD–12 h of sleep deprivation (lights on); **P = 0.011.
Uncoupling Protein 2 is Increased Only after 12 h of Sleep Deprivation The UCP2 analyses were designed to assess whether there were changes after 3 and 12 h of sleep deprivation compared to undisturbed diurnal controls, as well as differences in UCP2 between 3 and 12 h of sleep deprivation. There was a significant overall difference among groups (P = 0.003, F3,7 = 12.3). We found that after 3 h of sleep deprivation there was not a significant change in UCP2 protein
COXIV subunit. Indeed, after 3 h of sleep deprivation by gentle handling the level of this protein was significantly lower (−16%) compared to 3 h of spontaneous wake (P = 0.008, Figure 2B). SLEEP, Vol. 33, No. 7, 2010
894
Electron Transport Chain in Extended Wakefulness—Nikonova et al
12C 1
2
12SD 3
4
WB 6
5
8
7
UCP2, 40 kDa
Figure 4A—UCP2 protein level increases after 12 h of sleep deprivation in mouse cerebral cortex. Representative immunoblot for UCP2 containing samples collected after 12 h of undisturbed lights on period (12C, lanes 1-3); 12 h of sleep deprivation (12SD, lanes 4-6), and whole brain mitochondria (WB, lanes 7-8).
compared to 3 h of spontaneous sleep (P = 0.091). However, the UCP2 level was significantly higher after 12 h of sleep deprivation compared to the undisturbed diurnal control (P = 0.024; Figure 4). This up-regulation of UCP2 protein after 12 h of sleep deprivation was also significant when compared to 3 h of sleep deprivation (P = 0.04, an increase of 41%; see Figure 4). There was not a significant change in the level of this protein in the course of spontaneous sleep (3C versus 12C, P = 0.877).
UCP2 1.75
Fold change
Nuclear Respiratory Factors Nrf1 and Nrf2 (Gabp) are Increased at the mRNA Level After 6 h of Sleep Deprivation To address whether there was alteration in transcription of the key regulatory molecules nuclear respiratory factors 1 and 2 (Nrf1, Nrf2 (Gabp)) and the transcriptional co-activator Pgc1a, we first examined the data base we have created for differences in gene expression in mouse cerebral cortex between sleeping and sleep deprived mice sacrificed at the same diurnal time based on a microarray study recently completed by us58 (see www.sleepgene.org for data). There were significant differences in expression for both Nrf1 and Nrf2 (Gabp) (see Figures 5A and 5B) but not in Pgc1a (data not shown). The differences in Nrf1 expression and Nrf2 (Gabp) expression were significant at the false discovery rates of 1.3 x 10⁻⁴ and 1 x 10⁻⁵, respectively. We have confirmed our microarray finding using quantitative RT-PCR in a separate group of animals. We find that for Nrf1 there is a significant difference between its mRNA in cortex after 6 h of sleep deprivation compared to spontaneously sleeping mice sacrificed at the same diurnal time (P < 0.0001; Figure 6). Likewise, for the DNA-binding subunit of Nrf2 (Gabpa in mice) the mRNA in the sleep deprived mice is higher than in the spontaneous sleep group (P < 0.0001; see Figure 6). There was, however, no significant difference in mRNA for Pgc1a between any of the groups (see Figure 6).
1.25 1.00 0.75 0.50 0.25
handled
C 12
3C
SD 12
D 3S
3S
W
C 3S
D/
/12 SD
12
3S
D/
3C
0.00 non-handled
lights on
Figure 4B—UCP2 protein level increases after 12 h of sleep deprivation in mouse cerebral cortex. Data on the left represent fold change in UCP2 protein expression level calculated using the means between the corresponding groups as for OXPHOS proteins. Left to right: fold change after 3 h of sleep deprivation (3SD) compared to 3 h of spontaneous sleep (3C, light grey bar); after 12 h of sleep deprivation (12SD) compared to undisturbed diurnal control (12C, medium grey bar), and after 3 h of sleep deprivation (3SD) compared to 3 h of spontaneous wake (3SW, black bar). Data on the right represent the whole brain mitochondria normalized UCP2 protein expression (mean ± standard deviation, n = 8-16). Animals were sacrificed 3 or 12 h after lights on, those that were sleep deprived (handled) are shown in gradient grey, and their undisturbed matching controls by open bars. Left to right: 3 h of sleep deprivation (3SD); 12 h of sleep deprivation (12SD); 3 h of spontaneous sleep (3C); and 12 h of lights on period (12C). There is a significant increase in UCP2 protein level after 12 h of sleep deprivation (12SD) compared to both undisturbed diurnal control (12C, P = 0.024) and 3 h of sleep deprivation (3SD, P = 0.04). *P < 0.05.
Phosphorylation of AMPK For α-1 AMPK, there were no significant increases in either phosphorylated α-1 AMPK or total α-1 AMPK. The results are presented in Figure 7A. We also assessed α-2 AMPK. We found a 35% increase in phosphorylated α-2 AMPK following 6 h of sleep deprivation compared to mice that were spontaneously sleeping (P < 0.05). We found no significant increase in total α-2 AMPK. The results are presented in Figure 7B. Therefore, SLEEP, Vol. 33, No. 7, 2010
*
*
1.50
there was an increase in α-2 AMPK phosphorylation following 6 h of sleep deprivation but no identified increase in α-1 AMPK phosphorylation. DISCUSSION This study demonstrates the temporal changes in the ATP production machinery with prolonged wakefulness. It shows that there is a coordinated up-regulation of the OXPHOS sys895
Electron Transport Chain in Extended Wakefulness—Nikonova et al
***
Nrf1 7.75
APC-normalized expression
log2 transformed expression
A
7.50
7.25
Control Sleep deprived 3
6
9
12
log2 transformed expression
7.75
7.50
7.25
7.00
3
0
6
9
Hours after lights on
0.25
6SD
6C
6SD
6C
Nrf2 (Gabpa)
6SD
6C
Pgc1a
of ATP synthesis). The change in the steady state of OXPHOS enzymes by kinetic regulation of one or more controlling steps, such as complex I and complex IV (COX) is another mechanism. Energy demand can also be met by a change in the level of the key OXPHOS enzymes per cell, with a constant steady state in the activity of each compound. This study supports the postulate that extended wakefulness is a condition when the brain needs more energy to sustain its functions and adapts to meet that need by the up-regulation of various components of the electron transport chain. It has previously been demonstrated by us that COX enzyme activity and COX subunit I transcript are increased after 3 h of sleep deprivation.25 This study extends that finding by demonstrating that COX enzyme activity in mouse cerebral cortex remains elevated after 12 h of sleep deprivation. There is no further increase since the level of enzyme activity after 12 h of sleep deprivation is not different from that after 3 h of deprivation. However, when mice are deprived of sleep for more than 6 h, delta wave activity intrudes into wakefulness such that the mice seem to be having microsleeps.2 These microsleeps may affect the level of change in enzyme activity we observe. Further, our data demonstrate that protein levels of mitochondrialencoded COX catalytic subunit I (and nuclear-encoded COX subunit IV) are increased after 12 h of sleep deprivation. Both the increase in COX enzyme activity and the up-regulation of subunits I and IV indicate that at least two of the three mitochondrial mechanisms of energy conversion to meet energy demand mentioned above are altered during sleep deprivation. Further, the increase in ATP synthase catalytic subunit B on the protein level, while significant only after 12 h of sleep deprivation, also suggests that this also contributes towards meeting an increased energy need.
12
Figure 5—Temporal changes in the expression of the Nrf1 (A), and Nrf2 (Gabpa) (B) genes in the mouse cerebral cortex. The expression profiles were established after 3, 6, 9, and 12 h of spontaneous sleep denoted in the figure as control (squares/dashed lines) or sleep deprivation (triangles/ solid lines). The mRNA level of the Nrf1 and Nrf2 genes increases during sleep deprivation and does not change or decline during sleep. A false discovery rate (FDR) was calculated for each gene as described by Storey78 to determine how significant the differences are in gene expression between sleep and sleep deprivation. The FDR values for the Nrf1 and Nrf2 genes is estimated at 1.3 x 10⁻⁴ and 1 x 10⁻⁵, respectively.58 Transcript abundance change is expressed in arbitrary units, and is log2 of the mean fluorescence signal for each time point minus that of the control animals sacrificed at 07:00 or time “0”. The data presented in this figure originate from a recently completed microarray study.58
tem, in particular complex IV, during the entire course of extended wakefulness up to 12 h thereby allowing adjustments to meet increasing energy need. The increased energy need is likely not only to support enhanced neuronal firing but also enhanced synaptic strengths as wakefulness is extended.59 The spontaneous firing rate of cortical neurons increase in a systematic way with the duration of preceding wakefulness.60 The OXPHOS system is tightly regulated on multiple levels by a number of mechanisms that are not mutually exclusive.61 The change in the oxidative phosphorylation rate allows an increase or a decrease in energy conversion flux (i.e., the rate SLEEP, Vol. 33, No. 7, 2010
0.50
Figure 6—Changes in the steady-state transcript levels of Nrf1, Nrf2 (Gabpa) and Pgc1a in the cerebral cortex of C57BL/6J mice after 6 h of total sleep deprivation and 6 h of spontaneous sleep. The transcript level at time zero (light on at 07:00) was used for calibration of other groups. Sleep deprivation significantly up-regulates the expression of both Nrf1 and Nrf2 (Gabpa) genes (P < 0.0001). These results are in agreement with previously published microarray data. The Pgc1a transcript level in cerebral cortex did not change with sleep deprivation (P = 0.764). Legend: 6SD–6 h of sleep deprivation; 6C–6 h of undisturbed sleep; ***P < 0.0001.
Nrf2 (Gabpa)
8.00
0.75
Nrf1
Hours after lights on B
***
1.00
0.00
7.00 0
1.25
896
Electron Transport Chain in Extended Wakefulness—Nikonova et al
SLEEP, Vol. 33, No. 7, 2010
P-α-AMPK Odyssey Integrated Intensity
A
3.5 3.0
30
P-α1-AMPK α1-AMPK
25
2.5
20
2.0
15
1.5
10
1.0
5
0.5 0.0
Control
Sleep Deprived
0
α-AMPK Odyssey Integrated Intensity
A byproduct of ATP production is the generation of reactive oxygen species (ROS), with the rate of generation depending on various factors including coupling state.62 In sleep deprivation, however, there is no evidence of end-products of oxidative damage such as lipid peroxidation even after 3-14 days of sleep deprivation.63 Thus, sleep deprivation either does not cause an increased ROS production, which seems unlikely given the increased COX activity, or there are mechanisms activated to limit ROS. One mechanism proposed to limit ROS production is by uncoupling via action of uncoupling proteins.26,33,41,64 UCP2 is one of the five uncoupling proteins, which is expressed in multiple brain regions.28 We have demonstrated at the protein level that there is an increase in UCP2 after 12 h of sleep deprivation in mouse cerebral cortex but not at 3 h. This extends previously published data on Ucp2 mRNA that was observed to increase after 8 h of sleep deprivation in rat cerebral cortex.29 We show that there is an increase in the protein level. mRNA and protein for UCP2 can be dissociated.34 Uncoupling proteins such as UCP2 play an important and diverse role in the central nervous system,26,33 one of which seems to be neuroprotection.31,32 In mice overexpressing human UCP2, brain damage is diminished after an induced stroke or after traumatic brain injury.42 This is proposed to be the consequence of UCP2 reducing uptake by the mitochondria of calcium and reduced production of reactive oxygen species.32 This aspect of the function of UCP2 is likely to be important in sleep deprivation as there is evidence of cellular stress after 6 h of sleep deprivation with activation of the unfolded protein response in mouse cerebral cortex.65 The present data also extend these observations by showing that we find in mouse cortex an increase in phosphorylation of AMP-dependent kinase (AMPK) at least in the α-2 isoform, after 6 h of sleep deprivation compared to that in sleeping mice. The phosphorylation of this enzyme is exquisitely sensitive to the ATP/AMP ratio in the cell.43,44 Thus, despite the increase in enzyme activity of COX and in levels of key proteins in the electron transport chain, there is a decrease in the ATP/ AMP ratio with 6 h of sleep deprivation. Thus, at least part of the reason for the unfolded protein response being found after 6 h of sleep deprivation is likely due to alteration in cellular energy state. Proper folding of proteins is an energy-dependent process.66 Sleep likely represents a stage of recovery and increases in ATP in brain during sleep have been previously demonstrated.67,68 That we find differences in the phosphorylation of the α-1 and α-2 isoforms of the catalytic subunit of AMPK is not surprising. The two isoforms have different cellular localization.69,70 The α-2 isoform is also expressed in brain at much higher levels than the α-1 isoform, including in the cerebral cortex that was studied here.70 There is also evidence that the two isoforms have somewhat different functions. The α-2 catalytic subunit of AMPK has been shown to play a major role in vivo as a fuel metabolic sensor by modulating the activity of the autonomous nervous system.71,72 Mice deficient in the AMPK α-2 isoform have glucose intolerance and reduced insulin sensitivity while mice deficient in the AMPK α-1 isoform do not.71,72 These different functions are also found in brain, in particular in a stroke model. AMPK is phosphorylated following stroke and contributes to an increase in infarct size. Mice lacking the α-2 isoform
3.5 3.0
30
P-α2-AMPK α2-AMPK
25
2.5
20
2.0
15
1.5
10
1.0
5
0.5 0.0
Control
Sleep Deprived
0
α-AMPK Odyssey Integrated Intensity
P-α-AMPK Odyssey Integrated Intensity
B
Figure 7—Assessment of α-AMPK and phosphorylated α-AMPK following immunoprecipitation for (A) α-1 AMPK and (B) α-2 AMPK. Data are presented as average ± SEM (n = 9). α-AMPK and phosphorylated α-AMPK (P-α1-AMPK) are placed on different y-axes. There is a significant increase in phosphorylated α-2 AMPK in sleep deprived samples, *P < 0.05.
of AMPK show reduced infarct size with stroke while deletion of the α-1 isoform has no such effect.73 The transcriptional regulation of OXPHOS is highly complex and involves interactions between two cellular genomes— nuclear and mitochondrial.35-38 Nuclear respiratory factors 1 (NRF1) and 2 (NRF2, or GABP in mice) are two known transcription factors that might play a role in sleep deprivation to adjust for the increasing energy needs. A number of OXPHOS subunits, e.g., COX4, ATP5B, and components of electron transfer, e.g., cytochrome c, as well as mtDNA transcription factor TFAM, contain binding sites for nuclear respiratory factor 1 (NRF1) and/or nuclear respiratory factor 2 (NRF2) in mice in their promoter regions.74 Both NRF1 and NRF2 transcription factors are known to be activity dependent.40,75 In vivo decreased neuronal activity in visual cortex produced by monocular enucleation reduces Nrf1 and Nrf2 expression.40 In vitro neural cultures with reduced activity also have reductions in Nrf1 and Nrf2 mRNA,40 while activation by stimulation increases gene expression.75 Based on a recent microarray study from our group,58 transcription of Nrf1 is up-regulated with sleep deprivation compared to sleep, at a false discovery rate (FDR) of 1.3 x 10⁻⁴ (see Figure 5A). We have confirmed by RTPCR that Nrf1 expression in the cerebral cortex is 20% higher in the sleep deprived group than in the sleep group. This increase in transcription of Nrf1 gene occurs with even short-term sleep deprivation, i.e., 3 h (for complete file of genes differentially 897
Electron Transport Chain in Extended Wakefulness—Nikonova et al
Nrf1, nuclear respiratory factor 1 Nrf2 (Gabp), nuclear respiratory factor 2 (GA-repeat binding protein) Pgc1a (PPARGC1A), peroxisome proliferator-activated receptor gamma, coactivator 1 alpha AMPK, AMP-dependent kinase.
expressed between sleep and sleep deprivation, refer to http:// www.sleepgene.org). Nrf2 (Gabpa) mRNA is also significantly different in the cerebral cortex between sleep and sleep deprivation (FDR for comparison between sleeping and deprived groups is 1 x 10⁻⁵) (see Figure 5B). We confirmed by RT-PCR in the same mice that Nrf2 (Gabpa) expression in mouse cerebral cortex is 40% greater in sleep deprived compared to sleeping mice. The activation of nuclear respiratory transcription factors is likely part of a feedback mechanism aimed to maintain ATP production during the increased neuronal activity. Our results do not allow us to conclude, however, that changes in expression of these transcription factors are responsible for the changes we observe in the proteins in the electron transport chain, etc. The evidence is correlative rather than causative. Future studies will require manipulation of the expression of these transcription factors to prove causality. PGC1a is another important regulatory molecule to consider. It increases the expression of OXPHOS genes including the Cox4 subunit of complex IV and Ucp2.76 While our microarray and RT-PCR studies did not find any difference in Pgc1a mRNA expression in mouse cortex or hypothalamus between sleep deprived and sleeping mice, it does not completely rule it out, as the action of PGC1a is affected by phosphorylation.77 We currently do not know if phosphorylation of PGC1a is affected by neuronal activity nor whether it is different in brain between sleep deprived and sleeping animals. Another consideration is that PGC1a expression might be rapidly up-regulated and that the time course of measurements we used in our studies missed the change. Studies looking at reductions in PGC1a, NRF1 and NRF2 with reduced neuronal activity in vitro and in vivo find that PGC1a changes are found at an earlier time point than for NRF1 and NRF2.40 Also, in vitro depolarization of neurons in culture with KCl results in increases in PGC1a protein in nucleus and cytoplasm after 1-3 h of depolarization but not at 5 h and later times.39 In conclusion, we postulate that in early sleep deprivation OXPHOS proteins originate from local, immediately available precursor sources, while as wakefulness continues the maintenance of OXPHOS resources becomes more challenging and likely involve additional nuclear transcriptional mechanisms. Initially the demand for increased ATP during wakefulness is met by increased activity of the OXPHOS system. We postulate that this will lead to an increase in production of ROS during extended wakefulness that leads to uncoupling with at least temporary decline in ATP, increase in AMP with activation of AMP-dependent protein kinase (AMPK),47 as well as the unfolded protein response.65 These events, in turn, lead to transcriptional changes with resulting alterations in the energy regulatory system. Several aspects of this model are supported by data presented here, while other components warrant further study.
ACKNOWLEDGMENTS We are grateful to Mr. Daniel Barrett and Ms. Jennifer Montoya for their help in preparation of this manuscript. The original research was supported by NIH grant AG17628 and HL60287 and a grant from the American Academy of Sleep Medicine (EVN). DISCLOSURE STATEMENT This was not an industry supported study. Dr. Pack is the John Miclot Professor of Medicine at the University of Pennsylvania. Funds for this position are provided by Philips/Respironics. REFERENCES
1. Van Dongen HP, Maislin G, Mullington JM, Dinges DF. The cumulative cost of additional wakefulness: dose-response effects on neurobehavioral functions and sleep physiology from chronic sleep restriction and total sleep deprivation. Sleep 2003;26:117-26. 2. Veasey SC, Yeou-Jey H, Thayer P, Fenik P. Murine Multiple Sleep Latency Test: phenotyping sleep propensity in mice. Sleep 2004;27:388-93. 3. Benington JH, Heller HC. Restoration of brain energy metabolism as the function of sleep. Prog Neurobiol 1995;45:347-60. 4. Scharf MT, Naidoo N, Zimmerman JE, Pack AI. The energy hypothesis of sleep revisited. Prog Neurobiol 2008;86:264-80. 5. Porkka-Heiskanen T, Strecker RE, McCarley RW. Brain site-specificity of extracellular adenosine concentration changes during sleep deprivation and spontaneous sleep: an in vivo microdialysis study. Neuroscience 2000;99:507-17. 6. Basheer R, Porkka-Heiskanen T, Stenberg D, McCarley RW. Adenosine and behavioral state control: adenosine increases c-Fos protein and AP1 binding in basal forebrain of rats. Brain Res Mol Brain Res 1999;73:1-10. 7. Porkka-Heiskanen T, Strecker RE, Thakkar M, Bjorkum AA, Greene RW, McCarley RW. Adenosine: a mediator of the sleep-inducing effects of prolonged wakefulness. Science 1997;276:1265-8. 8. Strecker RE, Morairty S, Thakkar MM, et al. Adenosinergic modulation of basal forebrain and preoptic/anterior hypothalamic neuronal activity in the control of behavioral state. Behav Brain Res 2000;115:183-204. 9. Halassa MM, Florian C, Fellin T, et al. Astrocytic modulation of sleep homeostasis and cognitive consequences of sleep loss. Neuron 2009;61:213-9. 10. Steriade M. Impact of network activities on neuronal properties in corticothalamic systems. J Neurophysiol 2001;86:1-39. 11. Timofeev I, Grenier F, Steriade M. Disfacilitation and active inhibition in the neocortex during the natural sleep-wake cycle: an intracellular study. Proc Natl Acad Sci U S A 2001;98:1924-9. 12. Pellerin L, Magistretti PJ. Neuroscience. Let there be (NADH) light. Science 2004;305:50-2. 13. Hevner RF, Duff RS, Wong-Riley MT. Coordination of ATP production and consumption in brain: parallel regulation of cytochrome oxidase and Na+, K(+)-ATPase. Neurosci Lett 1992;138:188-92. 14. Saraste M. Oxidative phosphorylation at the fin de siecle. Science 1999;283:1488-93. 15. Scheffler IE. A century of mitochondrial research: achievements and perspectives. Mitochondrion 2001;1:3-31. 16. Lenka N, Vijayasarathy C, Mullick J, Avadhani NG. Structural organization and transcription regulation of nuclear genes encoding the mammalian cytochrome c oxidase complex. Prog Nucleic Acid Res Mol Biol 1998;61:309-44. 17. Cirelli C, Tononi G. Differences in gene expression between sleep and waking as revealed by mRNA differential display. Brain Res Mol Brain Res 1998;56:293-305.
ABBREVIATIONS ATP, adenosine triphosphate OXPHOS, oxidative phosphorylation COX, cytochrome-c oxidase (complex IV) ATP5B, ATP synthase (complex V) catalytic subunit B ROS, reactive oxygen species UCP2, uncoupling protein 2 SLEEP, Vol. 33, No. 7, 2010
898
Electron Transport Chain in Extended Wakefulness—Nikonova et al
18. Cirelli C, Tononi G. Differences in brain gene expression between sleep and waking as revealed by mRNA differential display and cDNA microarray technology. J Sleep Res 1999;8 Suppl 1:44-52. 19. Cirelli C, Tononi G. Differences in gene expression during sleep and wakefulness. Ann Med 1999;31:117-24. 20. Cirelli C, Tononi G. Gene expression in the brain across the sleep-waking cycle. Brain Res 2000;885:303-21. 21. Cirelli C, Gutierrez CM, Tononi G. Extensive and divergent effects of sleep and wakefulness on brain gene expression. Neuron 2004;41:35-43. 22. Shaw PJ, Cirelli C, Greenspan RJ, Tononi G. Correlates of sleep and waking in Drosophila melanogaster. Science 2000;287:1834-7. 23. Ludwig B, Bender E, Arnold S, Huttemann M, Lee I, Kadenbach B. Cytochrome C oxidase and the regulation of oxidative phosphorylation. Chembiochem 2001;2:392-403. 24. Kadenbach B, Napiwotzki J, Frank V, Arnold S, Exner S, Huttemann M. Regulation of energy transduction and electron transfer in cytochrome c oxidase by adenine nucleotides. J Bioenerg Biomembr 1998;30:25-33. 25. Nikonova EV, Vijayasarathy C, Zhang L, et al. Differences in activity of cytochrome C oxidase in brain between sleep and wakefulness. Sleep 2005;28:21-7. 26. Andrews ZB, Diano S, Horvath TL. Mitochondrial uncoupling proteins in the CNS: in support of function and survival. Nat Rev Neurosci 2005;6:829-40. 27. Lengacher S, Magistretti PJ, Pellerin L. Quantitative rt-PCR analysis of uncoupling protein isoforms in mouse brain cortex: methodological optimization and comparison of expression with brown adipose tissue and skeletal muscle. J Cereb Blood Flow Metab 2004;24:780-8. 28. Richard D, Rivest R, Huang Q, et al. Distribution of the uncoupling protein 2 mRNA in the mouse brain. J Comp Neurol 1998;397:549-60. 29. Cirelli C, Tononi G. Uncoupling proteins and sleep deprivation. Arch Ital Biol 2004;142:541-9. 30. Arsenijevic D, Onuma H, Pecqueur C, et al. Disruption of the uncoupling protein-2 gene in mice reveals a role in immunity and reactive oxygen species production. Nat Genet 2000;26:435-9. 31. Sullivan PG, Dube C, Dorenbos K, Steward O, Baram TZ. Mitochondrial uncoupling protein-2 protects the immature brain from excitotoxic neuronal death. Ann Neurol 2003;53:711-7. 32. Paradis E, Clavel S, Bouillaud F, Ricquier D, Richard D. Uncoupling protein 2: a novel player in neuroprotection. Trends Mol Med 2003;9:522-5. 33. Kim-Han JS, Dugan LL. Mitochondrial uncoupling proteins in the central nervous system. Antioxid Redox Signal 2005;7:1173-81. 34. Pecqueur C, Alves-Guerra MC, Gelly C, et al. Uncoupling protein 2, in vivo distribution, induction upon oxidative stress, and evidence for translational regulation. J Biol Chem 2001;276:8705-12. 35. Scarpulla RC. Nuclear control of respiratory chain expression in mammalian cells. J Bioenerg Biomembr 1997;29:109-19. 36. Scarpulla RC. Transcriptional activators and coactivators in the nuclear control of mitochondrial function in mammalian cells. Gene 2002;286:81-9. 37. Scarpulla RC. Nuclear control of respiratory gene expression in mammalian cells. J Cell Biochem 2006;97:673-83. 38. Scarpulla RC. Transcriptional paradigms in mammalian mitochondrial biogenesis and function. Physiol Rev 2008;88:611-38. 39. Meng H, Liang HL, Wong-Riley M. Quantitative immuno-electron microscopic analysis of depolarization-induced expression of PGC-1alpha in cultured rat visual cortical neurons. Brain Res 2007;1175:10-6. 40. Liang HL, Wong-Riley MT. Activity-dependent regulation of nuclear respiratory factor-1, nuclear respiratory factor-2, and peroxisome proliferator-activated receptor gamma coactivator-1 in neurons. Neuroreport 2006;17:401-5. 41. Brand MD, Esteves TC. Physiological functions of the mitochondrial uncoupling proteins UCP2 and UCP3. Cell Metab 2005;2:85-93. 42. Mattiasson G, Shamloo M, Gido G, et al. Uncoupling protein-2 prevents neuronal death and diminishes brain dysfunction after stroke and brain trauma. Nat Med 2003;9:1062-8. 43. Jing M, Ismail-Beigi F. Role of 5‘-AMP-activated protein kinase in stimulation of glucose transport in response to inhibition of oxidative phosphorylation. Am J Physiol Cell Physiol 2006;290:C484-91. 44. Hardie DG, Hawley SA, Scott JW. AMP-activated protein kinase--development of the energy sensor concept. J Physiol 2006;574:7-15. 45. Ahima RS, Lazar MA. Adipokines and the peripheral and neural control of energy balance. Mol Endocrinol 2008;22:1023-31.
SLEEP, Vol. 33, No. 7, 2010
46. Kim MS, Lee KU. Role of hypothalamic 5‘-AMP-activated protein kinase in the regulation of food intake and energy homeostasis. J Mol Med 2005;83:514-20. 47. Carling D. AMP-activated protein kinase: balancing the scales. Biochimie 2005;87:87-91. 48. Rutter GA, Da Silva Xavier G, Leclerc I. Roles of 5‘-AMP-activated protein kinase (AMPK) in mammalian glucose homoeostasis. Biochem J 2003;375:1-16. 49. Scharf MT, Mackiewicz M, Naidoo N, O‘Callaghan JP, Pack AI. AMPactivated protein kinase phosphorylation in brain is dependent on method of killing and tissue preparation. Journal of Neurochemistry 2008;105:833-41. 50. Jensen TE, Rose AJ, Jorgensen SB, et al. Possible CaMKK-dependent regulation of AMPK phosphorylation and glucose uptake at the onset of mild tetanic skeletal muscle contraction. Am J Physiol Endocrinol Metab 2007;292:E1308-17. 51. Pack AI, Galante RJ, Maislin G, et al. Novel method for high-throughput phenotyping of sleep in mice. Physiol Genomics 2007;28:232-8. 52. O‘Callaghan JP, Sriram K. Focused microwave irradiation of the brain preserves in vivo protein phosphorylation: comparison with other methods of sacrifice and analysis of multiple phosphoproteins. J Neurosci Methods 2004;135:159-68. 53. Franklin KBJ, Paxinos G. The mouse brain in stereotaxic coordinates. San Diego: Academic Press, 1997. 54. Vijayasarathy C, Damle S, Prabu SK, Otto CM, Avadhani NG. Adaptive changes in the expression of nuclear and mitochondrial encoded subunits of cytochrome c oxidase and the catalytic activity during hypoxia. Eur J Biochem 2003;270:871-9. 55. Hevner RF, Liu S, Wong-Riley MT. An optimized method for determining cytochrome oxidase activity in brain tissue homogenates. J Neurosci Methods 1993;50:309-19. 56. Smith L. Spectrophotometric assay of cytochrome c oxidase. Methods Biochem Anal 1955;2:427-34. 57. Livak KJ, Schmittgen TD. Analysis of relative gene expression data using real-time quantitative PCR and the 2(-Delta Delta C(T)) Method. Methods 2001;25:402-8. 58. Mackiewicz M, Shockley KR, Romer MA, et al. Macromolecule biosynthesis: a key function of sleep. Physiol Genomics 2007;31:441-57. 59. Vyazovskiy VV, Cirelli C, Pfister-Genskow M, Faraguna U, Tononi G. Molecular and electrophysiological evidence for net synaptic potentiation in wake and depression in sleep. Nat Neurosci 2008;11:200-8. 60. Vyazovskiy VV, Olcese U, Lazimy YM, et al. Cortical firing and sleep homeostasis. Neuron 2009;63:865-78. 61. Devin A, Rigoulet M. Mechanisms of mitochondrial response to variations in energy demand in eukaryotic cells. Am J Physiol Cell Physiol 2007;292:C52-8. 62. Liu Y, Fiskum G, Schubert D. Generation of reactive oxygen species by the mitochondrial electron transport chain. J Neurochem 2002;80:780-7. 63. Gopalakrishnan A, Ji LL, Cirelli C. Sleep deprivation and cellular responses to oxidative stress. Sleep 2004;27:27-35. 64. Brand MD, Affourtit C, Esteves TC, et al. Mitochondrial superoxide: production, biological effects, and activation of uncoupling proteins. Free Radic Biol Med 2004;37:755-67. 65. Naidoo N, Giang W, Galante RJ, Pack AI. Sleep deprivation induces the unfolded protein response in mouse cerebral cortex. J Neurochem 2005;92:1150-7. 66. Dobson C. Principles of protein folding, misfolding and aggregation. Semin Cell Devel Biol 2004;15:3-16. 67. Van den Noort S, Brine K. Effect of sleep on brain labile phosphates and metabolic rate. Am J Physiol 1970;218:1434-9. 68. Dworak M, Diel P, Voss S, Hollmann W, Struder HK. Intense exercise increases adenosine concentrations in rat brain: implications for a homeostatic sleep drive. Neuroscience 2007;150:789-95. 69. Salt I, Celler JW, Hawley SA, et al. AMP-activated protein kinase: greater AMP dependence, and preferential nuclear localization, of complexes containing the alpha2 isoform. Biochem J 1998;334:177-87. 70. Turnley AM, Stapleton D, Mann RJ, Witters LA, Kemp BE, Bartlett PF. Cellular distribution and developmental expression of AMP-activated protein kinase isoforms in mouse central nervous system. J Neurochem 1999;72:1707-16. 71. Viollet B, Andreelli F, Jørgensen SB, et al. Physiological role of AMPactivated protein kinase (AMPK): insights from knockout mouse models. Biochem Soc Trans 2003;31:216-9.
899
Electron Transport Chain in Extended Wakefulness—Nikonova et al
72. Viollet B, Andreelli F, Jørgensen SB, et al. The AMP-activated protein kinase α2 catalytic subunit controls whole-body insulin sensitivity. J Clin Invest 2003;111:91-8. 73. Li J, Zeng Z, Viollet B, Ronnett GV, McCullough LD. Neuroprotective effects of adenosine monophosphate-activated protein kinase inhibition and gene deletion in stroke. Stroke 2007;38:2992-9. 74. Chinenov Y, Coombs C, Martin ME. Isolation of a bi-directional promoter directing expression of the mouse GABPalpha and ATP synthase coupling factor 6 genes. Gene 2000;261:311-20. 75. Yang SJ, Liang HL, Wong-Riley MT. Activity-dependent transcriptional regulation of nuclear respiratory factor-1 in cultured rat visual cortical neurons. Neuroscience 2006;141:1181-92.
SLEEP, Vol. 33, No. 7, 2010
76. Wu Z, Puigserver P, Andersson U, et al. Mechanisms controlling mitochondrial biogenesis and respiration through the thermogenic coactivator PGC-1. Cell 1999;98:115-24. 77. Li X, Monks B, Ge Q, Birnbaum MJ. Akt/PKB regulates hepatic metabolism by directly inhibiting PGC-1alpha transcription coactivator. Nature 2007;447:1012-6. 78. Storey JD. A direct approach to false discovery rates. J Royal Stat Soc B 2002;64:479-98.
900
Electron Transport Chain in Extended Wakefulness—Nikonova et al