margin L. For larger jq1 01j, the map becomes increasingly asymmet- rical and the difference in probabilities of 0s and 1s increases. It is possible that a local ...
382
IEEE TRANSACTIONS ON CIRCUITS AND SYSTEMS—I: FUNDAMENTAL THEORY AND APPLICATIONS, VOL. 48, NO. 3, MARCH 2001
Chaos-Based Random Number Generators—Part II: Practical Realization Toni Stojanovski, Johnny Pihl, and Ljup˘co Kocarev Abstract—This paper and its companion (Part I) are devoted to to the analysis of the application of a chaotic piecewise-linear one-dimensional (PL1D) map as Random Number Generator (RNG). In Part I, we have mathematically analyzed the information generation process of a class of PL1D maps. In this paper, we find optimum parameters that give an RNG with lowest redundancy and maximum margin against parasitic attractors. Further, the map is implemented in a 0.8 m standard CMOS process utilizing switched current techniques. Post-layout circuit simulations of the RNG indicate no periodic attractors over variations in temperature, power supply and process conditions, and maximum redundancy of 0.4%. We esimate that the output bit rate of our RNG is 1 Mbit/s, which is substantially higher than the output bit rate of RNGs available on the market. Index Terms—Chaos, CMOS, random number generator.
I. INTRODUCTION To construct a random number generator (RNG) based on chaos, in this paper and its companion [1] we exploit the double nature of chaos, deterministic in microscopic space, and random in macroscopic space. In Part I, we have shown that our chaos-based RNG is mathematically proven to act as an information source and is not prone to silent breakdowns. In this paper, we address the questions of practical realization of our RNG. In particular, we find optimum parameters of RNG and show how it can be efficiently implemented on-chip. Here is the layout of our paper. Section II shows the way a RNG based on a chaotic map can be optimized. Section III benefits from the results presented in Section II, and gives the design of a chaotic RNG based implemented by virtue of switched current circuits. Concluding remarks are given in Section IV. II. OPTIMIZATION OF CHAOS– BASED RNGS In Part I, we have analyzed the information generation process of the following PL1D maps:
n
x +1
=
n) =
f (x
q1
+ k1 xn ;
01 + )j1
n;
k2 x
for xn for xn
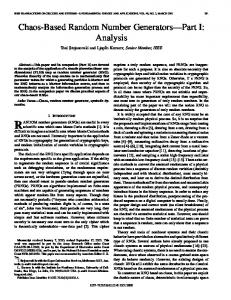
0, and then apply bit skipping thus yielding the sequence Zp ; Z2p ; Z3p ; . . .. Bits from sequences Y0 ; Yp ; Y2p ; . . . and Zp ; Z2p ; Z3p ; . . . are related via the deterministic transformation Zp = Y0 and Z(i+1)p = Zip 8 Yip for i > 0, and therefore their entropies and redundancies are identical. Which redundancy reduction technique is preferred between these two, depends on the ease of practical implementation. They can both be implemented with a one-stage binary counter, the only difference being that the binary counter is set to 0 at the start of every block of p bits. Contrary to bit skipping, bit counting affects both sources of redundancy. This is the reason behind the superiority of bit counting with respect to bit skipping, and this will be pointed out throughout following sections. We show that bit counting is superior to bit skipping in the sense that it is more robust to the inevitable fluctuations of the parameter values from the nominal ones, and provides lower redundancy. Both bit counting and bit skipping reduce the output bit generation rate p times, and one must compromise between reduction in the redundancy and reduction in the bit generation rate. Therefore we give results only for moderate values of p � 6. Even for p � 6 redundancies are very small, and further reduction in the bit generation rate by choosing larger p can not be justified. B. Redundancy Reduction in 1-D Regions Figs. 1 and 2 show redundancies for bit skipping and bit counting in the 1-D regions P1 and P2 , which are defined as P1 = f(k1 ; k2 ; q1 ) j 1 < k2 = k1 < 2; q1 = 1g and P2 = f(k1 ; k2 ; q1 ) j 1 < k1 = k2 < 2; q1 = k1 0 1g. Common value of k1 and k2 is denoted k in both P1 and P2 . For P1 , where both binary symbols are equiprobable, bit skipping and bit counting are with comparable performances. For P2 bit counting is substantially superior to bit skipping. In P2 , binary symbols are not equiprobable, and bit skipping offers no cure against such a source of redundancy. As illustrated in Fig. 2(b), redundancies for bit skipping go very quickly
1057–7122/01$10.00 © 2001 IEEE
IEEE TRANSACTIONS ON CIRCUITS AND SYSTEMS—I: FUNDAMENTAL THEORY AND APPLICATIONS, VOL. 48, NO. 3, MARCH 2001
383
Fig. 1. Redundancy in parameter region P for : (a) bit counting and (b) bit skipping redundancy reduction techniques.
Fig. 2. Redundancy in parameter region P for : (a) bit counting and (b) bit skipping redundancy reduction techniques.
down to the lower limit 1 0 HB (P fX = 0g), which is determined by the differences in probabilities of 0s and 1s. There are local minima of the redundancy both in P1 and P2 , that is, larger p and/or higher slope k do not always mean smaller redundancy, and smaller redundancy does not necessarily mean lower margins L. We observed local minima of the redundancy also in the other 1-D regions which we examined. For bit counting in P1 ; p = 5 is better than p = 6, and p = 3 is better than p = 4 for moderate values of k < 1:85. This is a consequence of the fact that P fY = 0g = P fY = 1g only for odd p, while P fY = 0g = 6 P fY = 1g for even p contributes to higher redundancy. Figures also show that width of local minima decrease for higher p. Thus, a local minima for higher p can be difficult to achieve with real circuits where parameter fluctuations are inevitable. This is an additional reason against usage of higher p. On the basis of previous results and analysis carried out also in several other 1-D regions of the parameter space, we conjecture that the conclusions on the existence of local minima of the redundancy, on the narrower width of local minima for higher p, and on the superiority of bit counting to bit skipping in sense of assuring less redundancy are valid also in the 3-D parameter space P . The existence of local minima creates possibility for optimization of the choice of parameters, that is, smaller k1 ; k2 and p can be chosen to provide smaller redundancy and higher margin L. C. Optimum Choice of Parameters What is the optimum choice of parameters? How can we exploit results from this subsection to find the optimum choice? When one uses
map (1) as an RNG, then one wants to be secure against appearance of parasitic attractors. When designing an RNG from the circuit implementation, one can compute the fluctuations in I+ and I0 due to temperature, power supply, and fabrication fluctuations, and then one can specify a minimum required margin Lmin against appearance of parasitic attractors. The next requirement is that the bit generation rate is higher than a certain value vb , which for a given clock frequency vc transforms into a requirement that p � pmax = dvc =vb e, where dxe denotes the largest integer smaller than or equal to x. For given Lmin and pmax , we define the optimum parameters as the set of parameters (k1 ; k2 ; q1 ; p)opt which minimizes redundancy � amongst all sets of parameters (k1 ; k2 ; q1 ; p) which satisfy (k1 ; k2 ; q1 ) 2 P ; p � pmax ; L � Lmin , that is,
1 ; k2 ; q1 ; p)opt = (k
(k
;k ;q
)2Pmin ;p�p
;L�L
�:
(2)
Brute-force searching of optimum parameters in P is a formidable task, and the following discussion relieves it. We show that optimization in the 1-D region P1 provides results that are almost as good as those obtained by optimization in the 3-D region P . Instead of searching P , we restrict our attention to a 3-D region P3 = f(k1; k2 ; q1 ) j (k1 2 (1:6 ; 1:9); k2 2 (k1 ; 1:9); q1 2 (0:9; 1:1)g. Very small slopes give small h entropy, while very large ones provide small margin L. For larger jq1 0 1j, the map becomes increasingly asymmetrical and the difference in probabilities of 0s and 1s increases. It is possible that a local minimum of a redundancy curve in P1 (see Fig. 1) is not a local minimum in P . Then, a set of parameters lying very close to P1 is a local minimum in P . This was the motivation to examine 1% and 2% neighborhoods of P1 ; P1;1% = f(k1 ; k2 ; q1 ) j k1 �
384
IEEE TRANSACTIONS ON CIRCUITS AND SYSTEMS—I: FUNDAMENTAL THEORY AND APPLICATIONS, VOL. 48, NO. 3, MARCH 2001
Fig. 3. Optimum redundancy as a function of the minimum margin L and : (a) p 2 and (b) p = 6.
=
in regions P (solid line), P (triangles), and P
[P
(circles) for bit counting
� 1:01k1 ; 0:99 � q1 � 1:01g and P1 2% defined in a similar way P1 1% . We divided P3 into 115 351 = 61 2 61 2 31 equal cubes. For a point (k1 ; k1 ; 1) lying in P1 we define its 1% neighborhood as f(k1 ; k2 ; q1) j k1 � k2 � 1:01k1; 0:99 � q1 � 1:01g, We divided k2 to
;
;
the 1% neighborhoods of 80 points k1 = 1:6; 1:605; 1:61; . . . ; 1:995 into 288 equal cubes thus producing a total of 23 040 cubes in P1;1% . An analogue procedure was repeated for P1;2% . For each of the 115 351 + 23 040 + 23 040 cubes we found an inner point for which is a Markov partition of order r � 12 (12 is chosen because the execution time and the memory requirements of the computer program that computes redundancies grow exponentially with r ). Then for each of these inner points we computed redundancies of bit skipping and bit counting for 2 � p � 6. This way, we examined behavior of redundancy in the 1% neighborhood of P1 ; P1;1% = f(k1 ; k2 ; q1 ) j k1 � k2 � 1:01k1 ; 0:99 � q1 � 1:01g, We repeated this procedure for a 2% neighborhood P1 . On the basis of previous computations, we performed optimization (2) in P1 ; P3 , and P1;1% [ P1;2% for 0 < Lmin < 0:45 and 2 � pmax � 6. We present results only for pmax = 2 and pmax = 6, see Fig. 3. For large Lmin (larger than approximately 0.15), optimization in P1 provides very close results to optimization in P3 and P1;1% [P1;2% , while for smaller Lmin optimizing in P1 is superior to optimizing in P3 and P1;1% [ P1;2% . The latter superiority is due to the small width of minima for k1 ; k2 � 2, and the chance is small that these minima are hit by the finite number of points analyzed in P3 ; P1;1% , and P1;2% . A twice finer grid of points in P3 and P1;1% would increase the number of points 8 times. In contrast, in P10D we analyzed only 574 points for which is a Markov partition with order r < 12. Motivated by (i) the substantially smaller computational complexity of the analysis and optimization in P1 than in P3 ; P1;1% , and P1;2% ; and (ii) the comparable or superior quality of the optimization in P1 compared to the optimization in P3 ; P1;1% , and P1;2% we suggest only an optimization in P1 is done when bit counting is employed. III. PRACTICAL REALISATION
Fig. 4. Transistor diagram for VLSI implementation in switched current technique, of the PL1D map. It shows the open-loop setup when the design is simulated after layout in a 0.8 �m CMOS process. During normal operation I is closed to I , and a nonoverlapping two-phase clock is applied to � and � .
A. Circuit Design Parameter variations due to implementation imprecision and external influences (temperature, power supply etc.) need to be estimated. As they are slowly varying compared to the iteration speed of the map, their temporal changes can be neglected and it can be approximated that the parameters are constant in time, though mismatched from the nominal ones.
We now look at how the chaotic map
for x0n < TL for x0n � TL may be implemented in VLSI technology. Fig. 4 shows a VLSI plementation of map (3), in a standard 0.8 �m CMOS process The implementation is a switched-current based circuit based on
x0n+1
=
q10 + k10 (xn0 0 TL ); q20 + k20 (xn0 0 TL );
(3) im[5]. [4].
IEEE TRANSACTIONS ON CIRCUITS AND SYSTEMS—I: FUNDAMENTAL THEORY AND APPLICATIONS, VOL. 48, NO. 3, MARCH 2001
385
Fig. 5. Map function obtained by open-loop SPICE simulation utilising Level 15 MOS models under typical mean process conditions. No parasitic stable points exist for temperatures between 25 C and 75 C and 10% power supply fluctuation.
0
+
6
The upper half of the circuit performs the slope multiplication and storage operation, and the lower half performs the nonlinear discrimination function [4]. The discriminator operates in one of two modes: For I1 > 0 T18, T19 are on and T20, T29 conduct so that through T17 Iout = I1 0 Ia . For I1 < 0 T8, T9 are on and T10, T28 conduct so that through T4 Iout = I1 + Ia . The figure shows the setup for open-loop simulation where the output current is terminated in a stage equivalent to the input. During closed-loop operation, the input and output are connected and a two-phase nonoverlapping clock is applied to 81 and 82 . The circuit was designed for a nominal threshold value of TL = 0, and a nominal slope of 1.82. This corresponds to one of the minimums of the redundancy curve for p = 5. The slope is small enough to provide a good margin L = 19:6%. B. Circuit Analysis With the circuit extracted from layout, the design was simulated open-loop in SPICE across 4.5. . .5.5 V power supply range and temperatures 025 � C to +75 � C, at typical mean process conditions. The proprietary charge based transistor model from Austria Mikro Systems (AMS) (Level 15) was used [5]. Iq was selected to 16 �A and Ia to 12 �A. For each pair of temperature and power supply, redundancies for bit counting and bit skipping with p = 2; . . . ; 6 were computed. Maximum redundancy over all temperatures and power supplies is minimum for p = 5 with a value of 0.4%. No parasitic attractors were detected. This was found to be true also for different process corners except for worst case speed process parameters. A different setting of Iq and Ia , yielding no parasitic attractors could, however, be found also for this process corner. The map, obtained from circuit simulation after layout is shown in Fig. 5 (27 � C, +5 V). The slope is 1.82 at 5 V and 27 � C. Simulations also indicated a maximum clock feed-through in Iout o f 0.3 �A across its entire range. On a step input from 09 �A to +9 �A in Iin ; Iout settles to within 0.1 �A in 140 ns. Maximum operating clock frequency is estimated to 5 MHz, which together with bit counting with p = 5 yields a total RNG
bit rate of 1 Mbit/s. This is substantially higher than the output bit rate of the RNGs available on the market: from 7600 bits/s to 76 000 bits/s. Furthermore, our RNG requires no software postprocessing. IV. CONCLUSION We have addressed the practical issues of our chaos-based RNG. Performances of simple redundancy reduction techniques such as bit counting and bit skipping, which due to their simplicity can be implemented on-chip, are analyzed. Bit counting is superior to bit skipping as it yields smaller redundancy, provides higher robustness of redundancy to fluctuations in parameters, and optimization of parameters can be done in a much simpler mode. Post-layout circuit simulations of the RNG indicate maximum redundancy of 0.4% for bit counting with p = 5, and no parasitic attractors over variations in temperature, power supply and process conditions. Maximum operating clock frequency is estimated to 5 MHz, which together with bit counting with p = 5 yields a total RNG bit rate of 1 Mbit/s. This is substantially higher than the output bit rate of the RNGs available on the market. REFERENCES [1] T. Stojanovski and L. Kocarev, “Chaos based random number generators Part I: Analysis,” IEEE Trans. Circuits Syst. I, vol. 48, pp. 281–288, Mar. 2001. [2] S. Espejo-Meana, A. Rodriguez-Vazquez, J. L. Huertas, and J. M. Quintana, “Application of chaotic switched-capacitor circuits for randomnumber generation,” in Proc. Eur. Conf. Circuit Theory Design 1989, 1989, pp. 440–444. [3] G. M. Bernstein and M. A. Lieberman, “Secure random number generation using chaotic circuits,” IEEE Trans. Circuits Syst., vol. 37, pp. 1157–1164, Dec., 1990. [4] M. Delgado-Restituto, F. Medeiro, and A. Rodriguez-Vazquez, “Nonlinear switched-current CMOS IC for random signal generation,” Electron. Lett., vol. 29, no. 25, pp. 2190–2191, 1993. [5] 0.8 �m CMOS process , Austria Mikro Systems, Unterpremstatten, Austria, 1995.