Chapter 19 IN-CAR SPEECH RECOGNITION USING DISTRIBUTED MICROPHONES Tetsuya Shinde1, Kazuya Takeda2, Fumitada Itakura1 1
2
Graduate School of Engineering; Graduate School of Information Science Nagoya University, 1 Furo-cho, Nagoya 464-8603 Japan Email:
[email protected]
Abstract
In this paper, we describe a method for multichannel noisy speech recognition that can adapt to various in-car noise situations during driving. Our proposed technique enables us to estimate the log spectrum of speech at a close-talking microphone based on the multiple regression of the log spectra (MRLS) of noisy signals captured by a set of distributed microphones. Through clustering of the spatial noise distributions under various driving conditions, the regression weights for MRLS are effectively adapted to the driving conditions. The experimental evaluation shows an average error rate reduction of 43 % in isolated word recognition under 15 different driving conditions.
Keywords: In-car-ASR, multiple microphone, linear regression
1.
INTRODUCTION
Array-microphone signal processing is known for sometime now to be effective for spatially selective signal capture and, in particular, noisy speech recognition when the locations of the speaker and noise sources are predetermined. However, when the spatial configuration of the speaker and noise sources are unknown or they change continuously, it is not easy to steer the directivity adaptively to the new conditions [1], [2], [3]. Previously, we have proposed multiple regression of log spectra (MRLS) to improve the robustness in the case of a small perturbation of the spatial distribution of the source and noise signals. In that study, log spectra
294
Chapter 19
of the signals captured by distributed microphones have been used to approximate that of the close-talking microphone, through linear regression [4]. In addition, we have employed MRLS technique for speech recognition in vehicles and have shown its effectiveness in improving the accuracy of noisy speech recognition. Through the experiments, we also found that further improvement of the recognition accuracy can be achieved if the regression weights are trained for each speaker and/or a particular in-car sound condition that is mainly set the vehicle itself. These scenarios include the background music from the audio system, windows are closed or open, noise from fan/A.C., and the speed of the vehicle. It is worth noting that the computation of regression weights regression weights for a given speaker at enrolment is not difficult. Whereas, changing the weights in order to adapt to the driving conditions is not easy. The aim of this study is to improve the MRLS so that regression weights can be changed adaptively to the in-car noise conditions. For this purpose, we attempt to benefit from distributed microphones for capturing the spatial distribution of noise sounds. The rest of the paper is arranged as follows. First, in Section 2, we describe the in-car speech corpus recorded using distributed microphones. The basic idea of MRLS and its extension to the adaptive method are described in Section 3 and Section 4, respectively. In Section 5, experimental evaluations and their results are discussed. Section 6 is a summary of this paper.
2.
2.1
MULTIPLE REGRESSION OF LOG SPECTRA Two-dimensional Taylor-expansion of log-spectrum
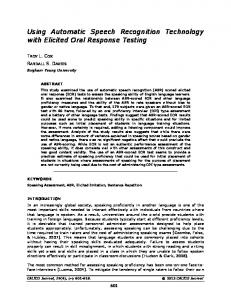
Assume that speech signal at microphone position is give by a mixture of the source speech and the noise convolved with the transfer functions to the position, and i.e.,
as shown in Figure 19-1. Assume also that the power spectrum of given by the ‘power sum’ of the filtered speech and noise, i.e.,
is
19.-In-car speech recognition using distributed microphones
295
where and are the power spectra of the speech signal at its source position, the noisy speech signal at microphone position and the noise signal at its source position, respectively. (The frequency index will be omitted in the rest of paper.) Consequently, the corresponding log-power-spectrum of the signals at the microphone positions are given by
Figure 19-1.
The derivative of
Where
and
Signal captured through distributed microphones.
can be calculated by
are given by
Note that both and are the functions of the ratio between signal and noise at their source positions, i.e., S/N. Small deviations of the log-power-spectrum of the signal at the microphone position can be approximated by a two-dimensional Taylor series expansion around i.e.,
296
Chapter 19
where Using superscript for the deviation from e.g. the Taylor expansion can be rewritten by
2.2
Multiple regression of multi-channel signals
Approximation of form
by the multiple-regression of
has the
By substituting equation (4), the regression error of the approximation, can be calculated as follows.
Assuming the orthogonality between tation value of the regression error becomes
and
the expec-
The minimum regression error is then achieved when
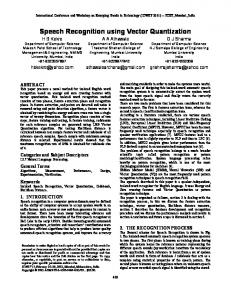
Thus, the optimal can be uniquely determined as a vector that is orthogonal to and its inner product with is equal to unity. The relationship among these three vectors are shown in Figure 19-2.
19.-In-car speech recognition using distributed microphones
Figure 19-2. The geometric relationship among optimal regression weights Taylor series coefficients and In the log-power-spectrum domain, continues to hold.
297
and the
and correspond to the Signal-to-Noise and Noise-to-Signal ratios, respectively, at the microphone position, and the relationship
holds for every microphone position. Therefore, once is given, both and are uniquely determined. Multiple regression on the log-powerspectrum domain can be regarded as an implicit estimation of the local SNR at each microphone position. On the other hand, when multiple-regression is performed on the powerspectrum domain, since
holds,
and
are given by
However unlike in the log-power-spectrum domain, and dependent, they can not uniquely related to the optimized
are in-
298
2.3
Chapter 19
Implementation
We have th following procedure to implement the technique. Logpower-spectrum is calculated through Mel-filter-bank analysis followed by log operation[8]. The spectrum of the speech captured by the closetalking microphone, is used as the speech at the source position S. All log-power-spectrum are normalized so that their means over an utterance become zero, i.e.,
Note that in this implementation, the minimisation of regression error is equivalent to minimising the MFCC distance between the approximated and the target spectra, due to the orthogonality of the discrete time cosine transform (DCT) matrix. Therefore, the MRLS has the same form as the maximum likelihood optimization of the filter-and-sum beamformer proposed in [5].
3.
AUTOMATIC ADAPTATION OF MRLS
In the previous report[4], we found that changing regression weights adaptively to the driving conditions is effective in improving the recognition accuracy. In this section, we propose a method of discriminating in-car noise conditions, which is mainly affected by driving conditions, using spatial distribution of noise signals, and of controlling the regression weights for MRLS. The basic procedure of the proposed method is as follows. 1) Cluster the noise signals, i.e., short-time non-speech segments preceding utterances, into several groups. 2) For each noise group, train optimal regression weights for MRLS, using the speech segments. 3) For unknown input speech, find a corresponding noise group from background noise, i.e., the non-speech segments, and perform MRLS with the optimal weights for the noise cluster. If there is a significant change in the sound source location, it greatly affects the relative intensity among distributed microphones. Therefore, in order to cluster the spatial noise distributions, we have developed a feature vector based on the relative intensity of the signals captured at the different positions to that of the nearest distant microphone, i.e.,
where is the relative power at the mel-filterbank (MFB) channel calculated from the microphone signal. We do not use
19.-In-car speech recognition using distributed microphones
299
the lower frequency channel because the spectra of stationary car noise is concentrated in the lower frequency region. Thus, R is a vector with 84 elements. As shown in Figure 19-1, the microphone is the one nearest to the driver. Finally, the 84 elements are normalized so that their mean and variance across elements are 0 and 1.0, respectively. Prototypes of noise clusters are obtained by applying the k-means algorithm to the feature vectors extracted from the training set of noise signals. An example of the clustering results are illustrated in Table 19-3, where we how many samples of each driving condition each noise class contains when four clusters of noise are learned. As seen from the table, clusters are naturally formed for ‘normal’, ‘music playing’, ‘fan’ and ‘open window’ situations, regardless of the driving speeds. From the results, it is expected that the relative power of the sound signals at different microphone positions can be a good cue for controlling MRLS weights.
4.
IN-CAR SPEECH CORPUS FOR DISTRIBUTED MICROPHONE
The distributed microphone speech corpus is a part of the CIAIR (Center for Integrated Acoustic Information Research) in-car speech database
300
Chapter 19
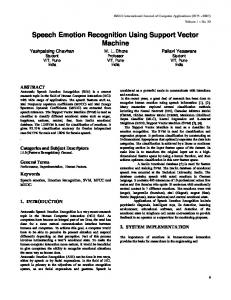
collected at Nagoya University [7], which contains data from 800 speakers. They include isolated word utterances, phonetically balanced sentences and dialogues recorded while driving. The data collection is performed using a specially designed data collection vehicle that has multiple data acquisition capabilities of up to 16 channels of audio signals, three channels of video and other driving-related information, i.e., car position, vehicle speed, engine speed, brake and acceleration pedals and steering handle. Five microphones are placed around the driver’s seat, as shown in Figure 19-3, where the top and the side views of the driver’s seat are depicted. Microphone positions are marked by the black dots. While microphones #3 and #4 are located on the dashboard; #5, #6 and #7 are attached to the ceiling. Microphone #6 is closest to the speaker. In addition to these distributed microphones, the driver wears a headset with a close-talking microphone (#1).
Figure 19-3. Microphone positions for data collection inside the vehicle: Side view (top) and top view (bottom).
In the majority of the corpus, the speaker is driving in the city traffic near Nagoya University. Considerable part of the corpus that we use in
19.-In-car speech recognition using distributed microphones
301
this study was collected under carefully controlled driving conditions, i.e., combinations of three car speeds (idle, driving in a city area and driving on an expressway) and five car conditions (fan on (hi/lo), CD player on, open window, and normal driving condition). For this part of the corpus, 50 isolated word utterances of 20 speakers were recorded under all combinations of driving speeds and vehicular conditions.
5.
5.1
EXPERIMENTAL EVALUATIONS Experimental Setup
Speech signals used in the experiments were digitized into 16 bits at the sampling frequency of 16 kHz. For the spectral analysis, 24-channel mel-filterbank analysis is performed by applying the triangular windows on the FFT spectrum of the 25-ms-long windowed speech. This basic analysis is realized through HTK standard MFB analysis [8]. The regression analysis is performed on the logarithm of MFB output. Since the power of the in-car noise signal is concentrated in the lower frequency region, the regression analysis is performed for the range of 250-8kHz, i.e., to spectral channels of the MFB. Then DCT is executed to convert the log-MFB feature vector into the MFCC vector for the speech recognition experiments. Three different HMMs are trained: close-talking HMM is trained using the close-talking microphone speech, distant microphone HMM is trained using the speech at the nearest distant microphone, and MRLS HMM is trained using MRLS results. The regression weights optimized for each training sentence are used for generating the training data of MRLS HMM. The structure of the three HMMs is fixed, i.e., three-state triphones based on 43 phonemes that share 1000 states; each state has 16-component mixture Gaussian distributions; and the feature vector is a 25 vector. The total number of training sentences is about 8,000. 2,000 of which were uttered while driving and 6,000 in an idling car.
302
5.2
Chapter 19
Baseline Performance of MRLS
For the evaluation of the baseline performance of MRLS, five recognition experiments are performed: CLS-TALK recognition of close-talking speech using close-talking HMM MRLS SPKER recognition of MRLS output optimized for each speaker using MRLS HMM MRLS DR recognition of MRLS output optimized for each driving condition using the MRLS HMM MRLS ALL recognition of MRLS output optimized for all training data using MRLS HMM and DIST recognition of nearest distant microphone speech by the distant microphone HMM. The resulting recognition accuracies are listed in Table 19-4, and the average accuracies over fifteen driving conditions are shown in Figure 19-4. It is found that MRLS outperforms the nearest distant microphone result even in “MRLS ALL”, where a set of universal weights are used for all conditions. This result confirms the robustness of the MRLS to the change of the location of the noise sources, because the primary noise locations are different depending on driving conditions. It is also found that the improvement is greater when the performance of the distant microphone is lower.
5.3
MRLS Performance with Weight Adaptation
To evaluate the MRLS performance with weight adaptation, optimal regression weights for the four noise clusters of Section 3 are trained. Using a 200 ms non-speech segment preceding the utterance, the nearest prototype of the noise cluster is searched; then the utterance is recognized after MRLS with the regression weights optimized for the corresponding noise cluster using the same MRLS HMM. The results of the experiments are shown in Figure 19-5, where the performance of the MRLS using adaptive regression weights is as high as the results of using the optimally trained weights for each driving condition. Furthermore, the MRLS outperforms the MLLR adaptation (five-word supervised adaptation) applied to the close-talking speech [9]. Therefore, the effectiveness of the proposed method is confirmed.
19.-In-car speech recognition using distributed microphones
303
Figure 19-4. Recognition performance averaged over various driving conditions. Closetalking (CLS-TALK), MRLS with optimized weights for a speaker (SPKER), with optimized weights for each driving condition (DR), with optimized weights for all training data (ALL), MLLR and distant microphone (DIST), from left to right.
304
Chapter 19
19.-In-car speech recognition using distributed microphones
305
Figure 19-5. Recognition performance of MRLS with optimized weights for a speaker (SPKER), with optimized weights for a driving condition (DR), proposed weight adaptive method (ADAPT), with optimized weights for all training data (ALL), from left to right.
6.
SUMMARY
In this paper, we described a multichannel method of noisy speech recognition that can adapt to various in-car noise conditions during driving. The method allows us to estimate the log spectrum of speech at a close-talking microphone based on the multiple regression of the log spectra (MRLS) of noisy signals captured by multiple distributed microphones. Through clustering of the spatial noise distributions under various driving conditions, the regression weights for MRLS are effectively adapted to the driving conditions. The experimental evaluation shows an
306
Chapter 19
error rate reduction of 43 % in isolated word recognition under various driving conditions. Acknowledgement: This work has been supported by a Grant-in-Aid for COE Research (No. 11CE2005).
References [1] Widrow, B. et al., “Adaptive Noise Cancelling: Principles and Applications”, Proc. IEEE, Vol.63, No.12, (1975.12). [2] Kaneda, Y. and Ohga, J., “Adaptive Microphone-Array System for Noise Reduction”, IEEE Trans. Acoustics Speech and Signal Processing, 34 (6): 1391-1400, (1986). [3] Yamada, T., Nakamura, S. and Shikano, K. “Distant-talking speech recognition based on a 3-D Viterbi search using a microphone array”, IEEE Transactions on Speech and Audio Processing, Vol.10, No.2, pp.48-56, February 2002 [4] T.Shinde K. Takeda and F. Itakura, “Multiple regression of Log Spectra for in-car speech recognition”, Proc. International Conference on Spoken Language Processing, Vol.II, pp.797-800, 2002 (ICSLP2002, Denver) [5] Michael L. Seltzer, Bhiksha Raj, and Richard M. Stern, “Speech Recognizer-based microphone array processing for robust handsfree speech recognition”, Proc. IEEE International Conference on Acoustics, Speech, and Signal Processing, Vol.I, pp.897-900, 2002 (ICASSP2002, Orlando) [6] Shimizu, Y., Kajita, S., Takeda, K. and Itakura, F., “Speech Recognition Based on Space Diversity Using Distributed Multi-Microphone”, Proc. IEEE International Conference on Acoustics, Speech, and Signal Processing, Vol.III, pp.1747-1750, (ICASSP2000, June, 2000, Istanbul). [7] Kawaguchi, N., Takeda, K., et al., “Construction of Speech Corpus in Moving Car Environment”, Proc. International Conference on Spoken Language Processing, pp. 1281-1284, 2000 (ICSLP2000, Beijing, China). [8] Young, S. et al. “The HTK Book”
19.-In-car speech recognition using distributed microphones
307
[9] C.J.Leggetter and P.C.Woodland, “Flexible speaker adaptation using maximum likelihood linear regression,” Proc. of the ARPA Spoken Language Technology Workshop, 1995, Barton Creek
This page intentionally left blank