freeze drying in Part I experiment (Note; *, not freeze dried). Ao. Sc. Plant extracts ... Adventure TM Pro (Ohaus corporation, Pine Brook, NJ, USA). 3. Autoclave ...
17
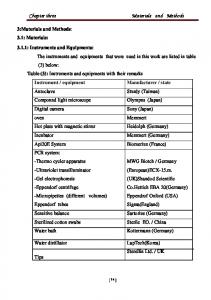
CHAPTER 2 MATERIALS AND METHODS The study is divided into four parts. Part I Preparation of Thai medicinal plant extracts Part II In vitro assay for the antibacterial activity of the plant extracts Part III In vitro assay for the cytotoxic activity of the studied plant extracts on gingival connective tissue fibroblasts Part IV In vitro assay for the anti-inflammatory activity of the studied plant extracts Part I Preparation of Thai medicinal plant extracts Materials 1. Five Thai medicinal plants of which seven parts were obtained: leaves and bark of Ao, dried-fruit of Tb, leaves and bark of Sc, pericarp of Pn, and leaves of Rn. 2. Ethanol 3. Dimetyl sulfoxide (DMSO) (MERCK®) 4. Distilled water (DW) Equipment 1. 2. 3. 4. 5.
Incubator Balance Rotary evaporation machine Water bath (Memmert) Freeze dried machine
17
18 Method Seven parts of the medicinal plants were studied. Ao leaves and bark, Sc leaves and bark, Pn pericarp, and leaves of Rn were collected from plants of the same age, size, and place in Songkhla, Southern Thailand. Tb dried-fruit was purchased from a Thai traditional medicine shop in Hatyai, Songkhla. Botanical identifidation of the studied plants was acquired by Thai herbalists at the Faculty of Pharmaceutical Sciences, Prince of Songkla University. The studied plants were cleaned, weighed and recorded, shade dried in the incubator at 50°C for 1 day, then re-weighed and recorded. The plants were then cut into small pieces, and then weighed and recorded. The next step, dried ground plant material was macerated with pure ethanol for 3 days and then filtrated and evaporated solvent from the first extract. This process was repeated for 3 times, thus obtaining 3 sets of measurements. Because the studied extracts were sticky and wet (except Sc and Rn leaves), the wet studied plant extracts were freeze dried, weighed and stored in 2-8º C. The weights of the studied plant extracts are shown in Table 2-1. Each sample of plant extracts was then dissolved with DMSO and mixed well. From pilot studies Ao leaves, Sc leaves and bark, Pn pericarp, and Rn leaves extracts were more easily dissolved than Ao bark and Tb dried-fruit extracts. So selected Ao leaves, Sc leaves and bark, Pn pericarp, and Rn leaves extracts 1,000 mg were prepared by DMSO 2.5 ml and distilled water 7.5 ml to get the concentration of 100 mg/ml and Ao bark and Tb dried-fruit extracts 5,000 mg prepared by DMSO 5 ml and DW 5 ml to get the concentration of 500 mg/ml (Table 2-2). The next step we centrifuged each plant extract solution at 4,500 rounds per minute (rpm), for 30 minutes and stored in 2-8ºC.
19 Table 2-1 Weights of the studied plant extracts after drying, volume of used ethanol, and the weight of the studied plant extracts after filtration, evaporation of solvent and freeze drying in Part I experiment (Note; *, not freeze dried) Plant extracts
Ao leaves bark 220 390
Step Weight after dried (g) Volume of ethanol 1,400 for evaporated (ml) Weight of the plant 17.87 extracts after freeze drying (g) Wet part (g) 7.14
Tb dried-fruit 540
Sc bark 170
Pn pericarp 523.96
Rn leaves 80
leaves 566.15
1,350
700
1,800
700
800
500
19.29
37.4
49
4.96*
68.88
4.12*
7.62
-
-
-
-
-
Table 2-2 Concentration of each plant extracts preparated Plant extracts
Weight of plant extracts (g)
Ao leaves Ao bark Tb dried-fruit Sc leaves Sc bark Pn pericarp Rn leaves
1 5 5 1 1 1 1
DMSO/distilled water (ml/ml) (%DMSO) 2.5/7.5 (25) 5/5 (50) 5/5 (50) 2.5/7.5 (25) 2.5/7.5 (25) 2.5/7.5 (25) 2.5/7.5 (25)
Beginning concentration of plant extracts (mg/ml) 100 500 500 100 100 100 100
20 Part II In vitro assay for the antibacterial activity of the plant extracts Materials 1. 2. 3. 4. 5. 6. 7. 8. 9. 10. 11. 12. 13. 14. 15. 16. 17. 18. 19. 20. 21. 22.
Seven prepared plant extracts from part I Dimetyl sulfoxide (DMSO) (MERCK®) Distilled water Brain heart infusion (BHI) (MERCK®) Yeast extract Bacto agar (Nuncton®) Blood Vitamin K (Menadione of Sigma®) Hemin (Sigma®) Brain heart broth (BHB) (MERCK®) Ministart® 96 wells plate (NUNCTONTM) Loop Cup (diameter 6 mm) Forceps Sterile Petri dishes Vernier caliper Magnetic bar Test tubes Glass pipette 1 ml, 5 ml, 10 ml, 20 ml Vortex mixer (Vortex Genie 2) Automatic pipette 1-10 µl, 10-100 µl, 100-1,000 µl (Drummond, Drummond scientific co. Broomall PA, USA) 23. Micropipette tips 24. 0.5 McFarland concentration (1.5×10⁸ CFU/ml ) standard 25. Flask 125 ml, 250 ml, 500 ml, 1,000 ml
21 26. Black paper sheet 27. Glass bottles 28. Beaker 50 ml, 100 ml, 500 ml, 1,000 ml Equipment 1. 2. 3. 4. 5. 6.
Anaerobic Incubator (Thermo-Forma, USA ) Adventure TM Pro (Ohaus corporation, Pine Brook, NJ, USA) Autoclave (Hiclave TM HV-50, Hirayama co.) Water bath (Memmert) Hot air oven (Memmert) UV/Visible spectro-photometer (Ultraspec 3300/Pharmacia of Amersham Biosciences)
Microorganism 1. Porphyromonas gingivalis (Pg) (ATCC 33277) 2. Aggregatibactor actinomycetemcomitans (Aa) (Clinical isolate) 3. Prevotella intermedia (Pi) (Clinical isolate) Standard antibiotic Metronidazole as a control for Pg This part consists of 3 experiments. Antibacterial experiments were modified from Koneman, et al., 1988. 61 1. Screening the antibacterial activity against Porphyromonas gingivalis (Pg), Aggregatibactor actinomycetemcomitans (Aa) and Prevotella intermedia (Pi) by agar diffusion method
22 2. Conducting the minimal inhibitory concentration (MIC) of the extracts by broth microdilution method 3. Evaluating the minimal bactericidal concentration (MBC) using blood agar plate Method 1. Screening the antibacterial activity against Porphyromonas gingivalis (Pg), Aggregatibactor actinomycetemcomitans (Aa) and Prevotella intermedia (Pi) by agar diffusion method Each of Pg, Aa and Pi 800 µl were mixed well with Brain Heart Infusion (BHI) agar 25 ml. The bacteria mixture was poured into sterile petri dishes containing 3 or 4 cups (6 mm diameter) and allowed to set. Each plant extracts, metronidazole 0.1 mg/ml, 25%, 50% DMSO and DW was added 100 µl/well. The plates were placed in an anaerobic condition containing N2:CO2:H2= 80:10:10 at 37 º C for 48 hours. The antibacterial activity was recorded if the inhibition zone was greater than 7 mm (Figure 2-1). The experiments were repeated 3 times.
Ao leaves
Ao bark
Sc leaves
Sc bark
Pn pericarp Distilled water
25% DMSO 50% DMSO Metronidazole
Rn leaves Tb dried-fruit
Figure 2-1 Location of each tested cups in plates of the antibacterial activity screening. (Cups of Ao leaves, Ao bark, Sc leaves and Sc bark extracts were tested in the same plate, cups of Pn pericarp, distilled water, Rn leaves and Tb dried-fruit extracts were tested in the same plate, and cups of 25% DMSO, 50% DMSO, and metronidazole 0.1mg/ml were tested in the same plate)
23 2. Determination of Minimal Inhibitory Concentration (MIC) of the extracts MIC was determined by using the broth microdilution method. Using a 96-well plate, each well was filled with 100 µl of BHI and serial broth microdilution was done by adding 100 µl of each beginning concentration of plant extract (100 mg/ml of Ao, Sc, Rn leave, Sc bark, and Pn pericarp and 500 mg/ml of Ao bark and Tb dried-fruit) into the first well , mixed well and pipetted 100 µl to the next right well until finished at the well number 11. The 12th well was used for intra-experiment control (Table 2-3). Controls consisted of a) positive control: metronidazole for Pg b) negative control: broth and microorganism c) intra-experimental controls: pure broth, broth and plant extracts without microorganism, 25% and 50%DMSO and broth with microorganism. Pg, Aa and Pi 0.5 MacFarland concentration (1.5×10⁸ CFU/ml) 100 µl were then added to the prepared wells. All plates were incubated in an anaerobic condition for 48 hours. The MIC was recorded if the solution did not appear turbid of bacterial accumulation when compared with the negative control. The experiments were repeated 5 times. The 96 well plate consisted of 8 rows (row A-H) and 12 columns (1st -12th column). In this experiment (Figure 2-2 and final concentration presented in Table 2-3) Row A represented tested Ao leave extracts at the MIC in 1st-11th columns. Row B represented tested Rn leave extracts at the MIC in 1st -11th columns. Row C represented tested Sc leave extracts at the MIC in 1st -11th columns. Row D represented tested Sc bark extracts at the MIC in 1st -11th columns. Row E represented tested Pn pericarp extracts at the MIC in 1st -11th columns. Row F represented tested Ao bark extracts at the MIC in 1st -11th columns. Row G represented tested Tb dried-fruit extracts at 5.95 mg/ml in 1st -11th columns. Row H represented tested metronidazole at the MIC in 1st -6th columns (positive control). 12th column (row A-G wells) were intra-experiment control (broth+plant extracts of each row, not added microorganism). 7th column of row H was intra-experiment control of metronidazole. 8th-10th column of row H were intra-experiment control of 10, 25, and 50% DMSO (broth+ DMSO+microorganism).
24 11th column of row H was negative control (broth+microorganism). 12th column of row H was intra-experiment control (pure broth).
1 2 3 4 5 6 7 8 9 10 11 12 1:2 1:4 1:8 1:16 1:32 1:64 1:128 1:256 1:512 1:1024 1:2048
Ao leaves
AA
Rn leaves
B
Sc leaves
C
Sc bark Pn pericarp
D
Ao bark
F
Tb dried-fruit
G
Control
E
H
H1
H2
H3
H4 H5 H6 H7
10% 25% 50%DMSO NC
Broth
Figure 2-2 Method of broth microdilution for exploring the Minimal Inhibitory Concentration (MIC). (Note; NC= Negative control)
25 Table 2-3 Concentration of each studied plant extract and control groups in each well of 96-well plate of the broth microdilution method for exploring the Minimal Inhibitory Concentration (MIC) (Note; IC= Intra-experiment control, micro= Microorganism ) Well no. (mg/ml)
Ao leaves (Row A) Rn leaves (Row B) Sc leaves (Row C) Sc bark (Row D) Pn Pericarp (Row E) Ao bark (Row F) Tb driedfruit (Row G) Metroni dazole (Row H)
1
2
3
4
5
6
7
8
9
10
11
12
25
12.5
6.25
3.125
1.56
0.78
0.39
0.195
0.097
0.048
0.024
IC
25
12.5
6.25
3.125
1.56
0.78
0.39
0.195
0.097
0.048
0.024
IC
25
12.5
6.25
3.125
1.56
0.78
0.39
0.195
0.097
0.048
0.024
IC
25
12.5
6.25
3.125
1.56
0.78
0.39
0.195
0.097
0.048
0.024
IC
25
12.5
6.25
3.125
1.56
0.78
0.39
0.195
0.097
0.048
0.024
IC
125
62.5
31.25
15.62
7.8
3.9
1.95
0.97
0.48
0.24
0.12
IC
125
62.5
31.25
15.62
7.8
3.9
1.95
0.97
0.48
0.24
0.12
IC
0.025
0.0125
0.0062
0.0031
0.0016
0.0008
Metro +broth
10% DMSO +broth +micro
25% DMSO +broth +micro
50%
broth+ micro
Only broth
DMSO +broth +micro
(positive control)
26 3. Evaluating the Minimal Bactericidal Concentration (MBC) using blood agar plate. After completing the broth microdilution method for exploring the MIC of studied plant extracts, we now confirm the results of this experiment by evaluating the MBC using a blood agar plate. The solution from each well was dropped onto blood agar plates and incubated under anaerobic conditions for 2 days. The last concentration was recorded as the MBC if there was no evidence of Pg, Aa and Pi colony formation. The experiments were repeated 5 times.
One type of the experiment (12 wells )
One type of the experiment (12 wells) the experiment
Figure 2-3 Example of the minimal bactericidal concentration (MBC) method. Statistical analysis Descriptive statistics are presented.
27 Part III In vitro assay for the cytotoxic activity of the studied plant extracts on gingival connective tissue fibroblasts (from Part II) Materials 1. 2. 3. 4. 5. 6. 7. 8. 9. 10. 11. 12. 13. 14. 15. 16. 17. 18. 19. 20. 21. 22. 23. 24.
Seven prepared plant extracts from part I Dimetyl sulfoxide (DMSO) (MERCK®) Distilled water 96 wells plate (NUNCTONTM) Forceps Glass pipette 1 ml, 2 ml, 5 ml, 10 ml, 20 ml Fetal bovine serum (FBS) Magnetic bar Dulbecco-MEM (DMEM) Vortex mixer (Vortex Genie 2) Automatic pipette 1-10 µl, 10-100 µl, 100-1,000 µl (Drummond, Drummond scientific co. Broomall PA, USA) Micropipette tips 200 µl, 1,000 µl Flask 125 ml, 250 ml, 500 ml, 1,000 ml Beaker 50 ml, 100 ml, 500 ml, 1,000 ml Phosphate buffered saline (PBS) MTT agent (Sigma, USA) Culture plate Tissue Culture flask 25, 75 cm2 Trypsin/EDTA solution Penicillin/Streptomycin Gentamycin Fungizone Centrifuge tube 15, 50 ml Ministart 0.45 µl 26 ml
28 Equipment 1. 2. 3. 4. 5. 6. 7. 8. 9. 10. 11. 12. 13. 14. 15.
AdventureTM Pro (Ohaus corporation, Pine Brook, NJ, USA) Autoclave (HiclaveTM HV-50, Hirayama co.) Water bath (Memmert) Hot air oven (Memmert) UV/Visible spectro-photometer (Ultraspec 3300/Pharmacia of Amersham Biosciences) Microflow Laminar (Bioharzard Laminar Air Flow Class II, Astec Microflow, UK) Liquid Nitrogen Tank (Thaylor-Wharton) Nikon Antimould (Hollywood international co. , LTD, Japan) BiotrakTM visible plate reader (Amersham Biosciences, USA) Hot plate stirer (Corning) pH meter (Precisa pH900) Eppendorf centrifuge 5417c (Pharmed and science) Spectromicroscope Refrigerated centrifuge (Labofuge®) Inverted Microscope (Nikon Eclipse, TE2000-U)
Method 1. Cell culture Human gingival fibroblast (HGF) derived from healthy gingival tissue under the Prince of Songkla University Ethic committee regulation. Cells were cultured in Dulbecco-MEM (DMEM) supplemented with 10% fetal bovine serum (FBS), antibiotics (100 µg/ml of penicillin, 100 µg/ml of streptomycin), glutamine and non-essential amino acid at 37° C in humidified atmosphere of 95% air and 5% CO2.
29 2. Cytotoxicity of plant extracts Using 96-well culture plate, HGF (passage 5th-10th) were added to each well at 5x10³ cells in 200 µl. At the subconfluent stage, the cells were quiescent in DMEM supplemented with 2% FBS for 8 hours before adding the plant extracts at the concentrations of 100, 50, 20 and 2 times of their MIC. Controls consisted of a) positive control: metronidazole b) negative control: HGF cells only c) Intra-experimental controls: DMEM supplemented with 2% FBS, 25% and 50% DMSO. After incubation for 24 hours, the subconfluent cells were then treated with plant extracts at concentrations mentioned above at 12, 24, or 48 hours. The control group consisted of a) positive control: HGF cells only b) intra-experimental controls: DMEM supplemented with 2% FBS, DMSO at the concentration of MIC and MBC for Pg of each plant extracts, 25% and 50% DMSO, and metronidazole. The positions of each tested plant extracts and controls consisted of; (Figure 2-4) Row 1A-C, row 2A-C represent Ao leaves extracts 100, 50 and 2 times of MIC. Row 1E-F, row 2E-F represent Sc leaves extracts 50 and 2 times of MIC. Row 1H, row 2H represent Rn leaves extracts 2 time of MIC. Row 3A-B, row 4A-B represent Sc bark extracts 10 and 2 times of MIC. Row 3C-E, row 4C-E represent Pn pericarp extracts 100, 50 and 2 times of MIC. Row 3G-H, row 4G-H, row 5A, row 6A represent Ao bark extracts 100, 50 and 2 times of MIC. Row 5C-E, row 6C-E represent Tb dried-fruit extracts 148.75, 59.5, and 5.95 mg/ml. Row 5F, row 6F represent control (HGF cells and DMEM supplemented with 2% FBS). Row 6G-H represent metronidazole 100 times of MIC. Row 7A-C, row 8A-C represent metronidazole 50, 20, and 2 times of MIC. Row 7D-G, row 8D-G represent DMSO 600, 300, 100, and 10 µl/ml. Row 11A, row 12A represent the blank. Row 11C, row 12C represent pure DMEM supplemented with 2% FBS.
30 1
2
3
4
5
6
7
8
9
10 11 12
A
AB C D
E F G H
Figure 2-4 Positions of each tested plant extracts and controls MTT assay MTT (Sigma, USA) solution was prepared as 5 mg/ml in DMEM just before use and filtered through a 0.22-µm filter to sterilize and remove a small amount of insoluble residue. The method of MTT assay described by Kasugai et al., 62 was used with some modification. Briefly, after 12, 24, or 48 hours, 10 µl of MTT solution was added to each well, and the incubation was continued for 4 hours. Then the entire medium was removed by gently inverting and tapping the plates. After the plates were washed with 100 µl of PBS twice, the wells were filled with 100 µl DMSO. The plates were stirred to enhance the dissolution of the MTT formazan. The spectrophotometric absorbance at 562 nm then was measured by an ELISA reader (Ceres UV 900 HDi, Biotrak Instrument, USA) with DMSO as blank. The mitochondrial dehydrogenase activity at each plant extracts concentration was calculated as a percentage of the control activity from the absorbance values. The experiment was repeated 3 times.
31 Statistical analysis The comparison of mean cell survival rate between the studied plant extracts was carried out using one way Analysis of variance (ANOVA). SPSS version 10 was used for all statistical analysis. A p-value less than 0.05 was considered to be significant.
32
Part IV In vitro assay for the anti-inflammatory activity of the studied plant extracts Materials 1. 2. 3. 4. 5. 6. 7. 8. 9. 10. 11. 12. 13. 14. 15. 16. 17. 18. 19. 20. 21. 22. 23.
Five prepared plant extracts from part II Dimetyl sulfoxide (DMSO) (MERCK®) Distilled water 96 wells plate (NUNCTONTM) Prostaglandins E2 (PGE2) by a commercial specific enzyme-linked immunosorbant assay (ELISA) kit (R&D system, USA ) ELISA kit (R&D system, USA) Glass pipette 1 ml, 2 ml, 5 ml, 10 ml, 20 ml Fetal bovine serum (FBS) Magnetic bar Dulbecco-MEM (DMEM) Vortex mixer (Vortex Genie 2) Automatic pipette 1-10 µl, 10-100 µl, 100-1,000 µl (Drummond, Drummond scientific co. Broomall PA, USA) Micropipette tips 200 µl, 1,000 µl Flask 125 ml, 250 ml, 500 ml, 1,000 ml Beaker 50 ml, 100 ml, 500 ml, 1,000 ml Phosphate buffered saline (PBS) MTT agent (Sigma®, USA) Culture plate Tissue Culture flask 25, 75 cm2 Trypsin/EDTA solution Penicillin/Streptomycin Gentamycin Fungizone
33 24. Centrifuge tube 15, 50 ml 25. Ministart 0.45 µl 26 ml 26. LPS of Escherichia coli (Sigma®, USA) Equipment 1. 2. 3. 4. 5. 6. 7. 8. 9. 10. 11. 12. 13. 14. 15. 16. 17.
AdventureTM Pro (Ohaus corporation, Pine Brook, NJ, USA) Autoclave (HiclaveTM HV-50, Hirayama co.) Water bath (Memmert) Hot air oven (Memmert) UV/Visible spectro-photometer (Ultraspec 3300/Pharmacia of Amersham Biosciences) CO2 incubator (Thermo Forma) Microflow Laminar (Bioharzard Laminar Air Flow Class II, Astec Microflow, UK) Liquid Nitrogen Tank (Thaylor-Wharton) Nikon Antimould (Hollywood international co. , LTD, Japan) BiotrakTM visible plate reader (Amersham Biosciences, USA) Hot plate stirrer (Corning) pH meter (Precisa pH900) Eppendorf centrifuge 5417c (Pharmed and science) Spectromicroscope Table Top Centrifuge PLC-03 (Centrifuge PLC serias, Taiwan) Refrigerated centrifuge (Labofuge®) Inverted Microscope (Nikon Eclipse, TE2000-U)
Method This experiment was performed for the evaluation of the anti-inflammation effect of plant extracts on HGF cells. HGF (passage 5th-10th) were added to each well of a 24well culture plate at 5x10⁴ cells in 1,000 µl of DMEM supplemented with 10% FBS, antibiotics (100 µg/ml of penicillin, 100 µg/ml of streptomycin), glutamine and non-essential amino acid. Cells were incubated at 37°C in humidified atmosphere of 95% air and 5% CO2 for 24 hours.
34 The HGF cells were then treated with LPS of E. coli 1 µg/ml incubated at 37°C in humidified atmosphere of 95% air and 5% CO2 for 9 hours (peak of PGE2 release). 63 We selected 5 plant extracts that were less cytotoxic from part III and prepared them by 20 and 2 times of MIC plant extracts, except Tb dried-fruit (5.95 and 59.5 mg/ml). Controls consisted of a) HGF cells treated with LPS but not treated with plant extracts b) HGF cells not treated with LPS and plant extracts. The subconfluent cells were then treated with prepared plant extracts. Cells were incubated at 37°C in humidified atmosphere of 95% air and 5% CO2 for 6, 12, 24 hours. At the end of the exposure time, the supernatant was collected. We measured PGE2 of the cell supernatants by a commercial specific enzyme-linked immunosorbant assay (ELISA) kit (R&D system, USA). The assay was conducted through the manufactures instructions (Table Appendix). The spectrophotometric absorbance at 405 nm was then measured by an ELISA reader (Ceres UV 900 HDi, Biotrak Instrument, USA). Statistical analysis Descriptive statistics are presented. Comparison between the studied plant extracts was carried out using the non-parametric Kruskal-wallis test. SPSS version 10 was used for all statistical analysis. A p-value less than 0.05 was considered to be significant.