Chapter 8 SPATIAL AND TEMPORAL DYNAMICS OF OWNERSHIP PARCELS AND FOREST COVER IN THREE COUNTIES OF NORTHERN LOWER MICHIGAN USA, CA. 1970 TO 1990
Scott A. Drzyzga' and Daniel G. Brown2 'Department of Geography, Michigan State University, East Lansing, MI488, USA2
[email protected] 2School ofNatural Resources & Environment, University ofMichigan, Ann Arbor, MI 48109, USA
Keywords:
land ownership, forest fragmentation, spatial pattern analysis.
Abstract
This chapter explores the relationship between land ownership subdivision and forest fragmentation to better understand the ways humans and forests have interacted in a temperate forest region in the North Central USA. Geographic information technologies were used to assess the dynamics of landscape configuration of private land ownerships and forest habitats in three forested counties over a 20-year period. Spatial and temporal patterns of land parcel subdivision were analyzed using digitized plat maps, while patterns of forest cover and forest cover change were assessed using digital remotely sensed data. Changes in land parcel subdivision and forest cover were observed in an area surrounding a small and growing central place, and their coincident patterns were used to evaluate the degree to which these phenomena are linked. The results show no direct connection between fragmentation of ownerships and that of forests. This finding highlights the complex interactions that govern landscape change, and indicate a need for new models that incorporate growing "footloose" populations, that is populations whose livelihoods are not directly tied to the land on which they reside.
INTRODUCTION Historical observations of social and landscape change have provided important evidence of the interaction between society and environment (Blaikie and Brookfield 1987, Naveh 1991, Weins 1992, Blaikie 1995). The need for S. J. Walsh et al. (eds.), Linking People, Place, and Policy © Kluwer Academic Publishers 2002
156 improved understanding of these interactions is true in tropical regions (Walker and Homma 1996, Faminow 1998, Walker et al. 2000), where deforestation is an important source of global atmospheric carbon and is implicated in substantial biodiversity loss. A similar need also exists in forested temperate landscapes ofthe Northern Hemisphere, where land use changes associated with demographic changes and economic shifts (e.g., abandonment of agricultural lands) have been driving increases in forest cover (Casperson et al. 2000). Many rural areas in the U.S. are experiencing large increases in both residential (U.S. Department of Commerce 1972, 1982, and 1992) and seasonal populations (Stewart 1994, Stynes et al. 1997). At least some increases are driven by an increasingly "footloose" population, which, because of improved transportation, telecommunications infrastructure, and transformations in demographic and economic situations, is not as dependent on a specific land base or urban system for its livelihood. These population increases are feared by many who believe natural resources and aesthetic qualities associated with regenerating temperate forests will subsequently be destroyed. Such a concern raises a general need to better understand the interaction between humans and forests and a specific need to reveal how recent historical development processes have influenced contemporary landscape patterns in temperate forests. Potential impacts include forest fragmentation and consequent wildlife habitat effects, and more complicated management strategies for forest resources. Historical and contemporary processes affect landscapes over different spatial and temporal scales, but all can leave indelible patterns. These patterns are interesting, because they have implications for landscape organization and structure. For example, in the midwestern USA, many roads and land parcel boundaries coincide with public land survey system! (PLSS) section lines and intersect at section corners. These regular patterns influence patterns of land ownership subdivision and, in turn, the shape and ownership offorest patches. In essence, spatially structured land use decisions have produced conspicuously organized and structured land cover patterns. Therefore, a spatially explicit understanding of historical land uses is necessary for explaining contemporary land cover patterns. Land use and land cover are related, but they are not always equivalent. The association between them is neither the same for all locations nor constant in any one location over time. For example, in frontier regions where economic growth depends on an extractive economic base (e.g., the Brazilian Amazon), land use and land cover are often semantically equivalent. Land-use activity associated with logging leads to a deforested land cover (Lamb in 1997). Therefore, satellite images can often be used to detect land-use change through observations of the biophysical characteristics ofthe land. However, in regions with a service or information driven economy, like most of the contemporary United States and Europe, land use and land cover are less likely to be equivalent. Similarly, observable land cover patterns may reflect not only
157 current land use, but may also be the result of a particular historical trajectory of use. Spatial technologies associated with geographic information science (GISc), which include aerial photography, satellite remote sensing, geographic information systems, and spatial analysis, can make an important contribution to the study oflandscape phenomena, because they allow spatially explicit data to be stored, integrated, analyzed and visualized. Spatial technologies make possible detailed mapping and analysis of areas with large extents and numerous observations. Land cover, ownership, and use are examples of complex spatiotemporal phenomena that coexist over very large areas. GISc offers the unique ability to map, integrate and query, effectively and efficiently, observed coincidences between these landscape phenomena over multiple scales. In brief, our purpose is to assess and characterize historical dynamics of, and interactions between, private land ownership and forest cover changes in a forested region. We start by defining terms, establishing the setting, and describing the spatial model and technologies used to characterize the relationship between the two phenomena. Next, we examine our results and assumptions. Last, we identify a need for new models that should incorporate growing "footloose" populations, i.e., populations whose livelihoods are not directly tied to the land on which they reside. Our specific objectives are to: •
• • •
quantitatively describe the spatial and temporal patterns of land ownership subdivision in a forested region in Northern Lower Michigan, USA between 1970 and 1990; quantitatively describe the spatial and temporal patterns of forest cover and fragmentation during the same period; characterize the relationship between changes in parcels, forests cover, and forest fragmentation; and use these results to improve our understanding of the link between population development processes and contemporary landscape patterns.
DEFINITION OF TERMS The terms fragmentation (Brown and Vasievich 1996, Theobald et al. 1996) and parcelization (Barlowe 1978, Erickson 1995) have been used synonymously in past research to mean the division or subdivision of land ownership in a landscape. However, their meanings are different and future application of the results of this study requires a careful definition of terms. Land ownership parcelization refers to the subdivision ofland under a single ownership into smaller parcels under a diverse ownership. The Michigan Society of Planning Officials (MSPO) described forest fragmentation as the result of cutting forests into configurations where "edge species of plants and
158 animals have proliferated" and deep forest habitats and resident species have declined (Warbach and Norberg 1995:iv). This definition implies physical landscape change. However, the MSPO also describes forest fragmentation as a process of subdividing large forested patches among many parcels under diverse ownership. This process does not necessarily effect a loss of habitat or scenic area, but is an impediment to forest management. Forest management strategies are difficult to construct and implement when many landowner viewpoints must be considered. The second definition does not imply physical landscape change. The former, physical definition of forest fragmentation is employed in this study, recognizing that the political connotation of the term forest fragmentation is very important to some planners and planning agencies.
STUDY AREA AND BACKGROUND Grand Traverse, Kalkaska, and Crawford Counties (Figure 1 and Figure 2) were selected as suitable areas for study for several reasons. The three counties are representative of extreme cases in Northern Lower Michigan USA, as each experienced substantial population growth over the 20-years between 1970 and 1990, although not concurrently. The three counties are also expected to incur continued population growth through the next 20-years (Grand Traverse County Planning Commission, 1997; Warbach and Norberg, 1995). Table 1 lists population figures for the three-county region, Northern Lower Michigan USA (NLM), and the entire State. The %CHANGE figures in Table 1 demonstrate that population growth occurred more rapidly in NLM than in the state. In tum, the three selected counties grew more rapidly than all ofNLM. Brown and Vasievich (1996) documented in their sample study of the Upper Midwest, USA that Grand Traverse and Crawford Counties underwent parcelization from 1960 through 1990. Their study examined 136 sample sites across seventeen counties. Each county, including Grand Traverse and Crawford, was characterized by decreasing average parcel sizes. Grand Traverse, Kalkaska, and Crawford Counties were selected also because the three counties constitute one contiguous region, and land cover change phenomena may be studied at scales larger and smaller than the county scale. Historical land use practices fragmented the forest resource in this region. An initial public land survey, a booming late nineteenth century timber industry, agricultural development, and establishment of public land areas affected forest distributions, compositions, and structures directly and indirectly. Growing human populations and a variety of land use choices continue to influence remnant forests and forest patches. Yet, many areas are exhibiting signs of forest regrowth and succession. Recent forest inventories and analyses of the Northern Lower Peninsula have indicated a six percent increase in total forest area between 1980 and 1993 (Leatherberry 1994).
159
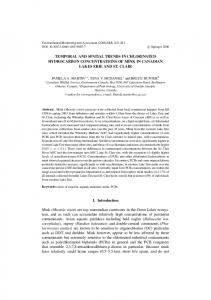
Figure 1. The State of Michigan, its regions, the study area, and large cities mentioned in the text.
Blue Lake
......... + Green
lake
. ........................! ···········....······1 f>.I~ois$
M.ple FoI~st
Crawford C ity of ~} Gmy!!ng
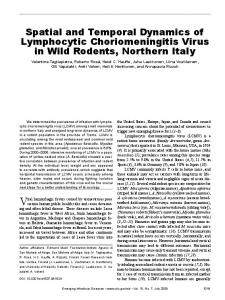
Figure 2. Political entities in the study region.
Traverse City, which is a relatively small city (population was 14,532 in 2000) located in Grand Traverse County, is the economic and retail center of northwest Lower Michigan. In it, the heaviest concentration of buildings and economic activity is located in the central business district (CBD), where many
160 commercial, retail and service establishments are located. The most important land use outside the center is housing. Just outside the CBD, apartment buildings and single family residences are distributed evenly along a rectangular street network. Beyond the regular network, low-density single-family lots extend into the countryside with parcel sizes generally increasing with distance from the CBD. Beyond the urban extent are regions dedicated to agricultural and forest uses. In summary, the general structure of services, employment, and housing forms a discemab1e annular pattern ofland uses around Traverse City. Table 1. Population counts and changes.
County
Grand Traverse Kalkaska Crawford Region NLMichigan State
1970 39175 5272 6482
1990 64273 13497 12260
Change
25098 8225 5778
'YoCHANGE 64 156 89
50929 383965 8881826
90030 538534 9295287
39101 154569 413461
77 40 5
Source: U.S. Department of Commerce: 1972, 1992.
The area around Traverse City is expected to continue a positive population growth trend into the year 2020 (Warbach and Norberg 1995). The Traverse City region attracts recreational development because of existing access to lake front areas, access to large population centers (e.g., Grand Rapids is 225 km, Detroit is 410 km, and Chicago is 510 km) gained from new highway construction, and proximity to public forests. Manson and Groop (1988) have characterized the area as a "retirement region" because primary population increases are associated with immigrating older persons; secondary increases are associated with local employment that serve the older community. Yet, residential population growth represents only a portion of total population growth in this region. Stewart (1994) and Stynes et al. (1997) have demonstrated that seasonal populations contribute substantially to rural landscape development in the Great Lakes region. Stynes et al. (1997) also demonstrated that the population of a Great Lakes county can be six or seven times the official resident population, because official census counts do not include seasonal homes or seasonal home owners in population totals. The period from 1967 to 1995 is unique to Michigan's landscape evolution, because the Subdivision Control Act (SCA) of 1967, a statewide minimum lotsize zoning law, was in effect and enforced during this period. In brief, the SCA provided for an expensive platting process to be imposed on landowners that subdivided land into parcels smaller than 4.05 ha (10 acres). Norgaard (1984) found that the statewide response was a proliferation of parcels just larger than 4.05 ha in size. Negative by-products of this proliferation are higher
161 infrastructure-per-capita costs and land cover fragmentation. This legislation affected both residential and seasonal home development. Therefore, the period between 1970 and 1990 should also be useful for studying landscape changes influenced by this piece of legislation. Similarities exist between the land cover characteristics and land use activities found in Lower Michigan forests and those found elsewhere. For example, Michigan forests are influenced by minimum lot-size zoning legislation, as are forests in other areas of the USA. Theobald et al. (1996) describe how existing minimum lot-size zoning ordinances in Colorado pave the way for creation of large lots with few houses, high infrastructure costs, and increased land cover fragmentation. Also, Michigan forests have been regenerating (or replaced with plantations) since the 1900s, but are now subject to the complex effects of multiple uses. Similar afforestation processes have been observed in the temperate forests of Central Europe; Hiittl et al. (2000) indicates the rigor of both the current regrowth trend and the set of demands placed on these forests by modern society (e.g., labor, primary production, and recreation). Scarascia-Mugnozza et al. (2000) report that similar demands are being placed on the declining forests in Mediterranean regions. New research (puric-Mlademovic et al. 2000) also indicates peri-urban development has caused a significant reduction in forest cover and increased forest fragmentation to occur in the Regional Municipality of York, United Kingdom. This kind of cause-and-effect relationship represents one of the principle concerns for Michigan planners (Wyckoff 1995), especially in the Traverse City region, which is the setting for this study. So, the human activities and ecological processes present in the study region share broad commonalities with those found in other temperate regions of the world.
METHODS Representing Historical Human Influences Human influence on the landscape can be expressed in terms ofparcelization because existing land parcels are subdivided as more new landowners move into an area. Plat map books (Rockford Map Publishers Inc., 1969-1991) were collected for the study area for the approximate years 1970, 1980, and 1990. When plat map books were unavailable for the exact dates, the closest available date was used as a surrogate. County plat map books contain detailed maps that show the spatial location and extent of parcels in geographic townships. Each parcel is labeled with the name of the owner and, in some cases, the approximate size of the parcel. The locations of roads, schools, cemeteries, and administrative boundaries are also identified. Patterns of land ownership and parcel boundaries were digitized into a GIS database using Arc/Info (ESRI Inc., Redlands, CA) software. Each digitized parcel map was registered and
162 georeferenced to the UTM coordinate system given ground control coordinate information obtained from surveyed section comers (MIRlS 1978). After digitization, all polygons in the parcel database were classified into one of five categories: privately-owned large parcels, privately-owned small tracts, public lands, open water, and other. Privately-owned large parcels are mapped individually in the plat map books. Private ownerships are maintained by either individuals, groups of individuals, or corporations. Privately-owned small tracts are collections of private lots that share a common boundary. Each lot is not mapped individually, rather, all contiguous lots are mapped as a single polygon. Because the distribution of parcel areas within small tract polygons cannot be discerned from the plat maps, we assumed average parcel sizes within each polygon to be equal to 0.20 hectares (0.5 acres). According to Kufour (1984), the average lot size within small tract areas tended between 0.12 and 0.20 ha in size between the years 1970 and 1980. Kufour (1984) also noted that lots tended to be larger, (0.40 ha) during the 1950s and 1960s. Because several older, small tract areas remain throughout the landscape, we used the larger, 0.20 ha estimate. Public land areas are those areas owned and maintained by public schools and government entities. Open water areas are permanent inland water features, such as lakes, reservoirs, and ponds. In Michigan, navigable open water areas are held in the public trust and cannot be privately owned. Any parcel that did not fit directly into any above stated ownership group was classed into the "other" category. These parcels include ownerships maintained by utility companies and all military lands.
Quantifying Human Influence A useful way to visualize land ownership parcelization is to calculate and compare parcel size frequency distributions for different dates. Changes between measured frequencies can be used to infer temporal changes on the landscape. So, such distributions were calculated and graphed for all three dates. Another useful way to quantify land ownership parcelization is to calculate and compare average parcel sizes for different dates. Average parcel sizes, were calculated using an average parcel size index (APS) similar to that used by Brown and Vasievich (1996). The APS index is a measure of average parcel size for a given area and sensitive to parcel area changes. The geometric mean was used to calculate the APS index because the distribution oflarge parcel areas within any sampled area tends to be positively skewed. The APS index is derived using the following equation:
163 APS where: Plarge
=
= the proportion of private land area classified as large parcels = the proportion of private land area classified as small tracts
Psmall ~lnA
= the mean of natural log transformed large parcel areas (m2) = the assumed size (m2) of all lots in small tract areas
nla'gi!
2000 10000 = a constant to convert meter to hectares
The calculated geometric mean of large parcels and the assumed geometric mean of small parcels within small tracts are weighted according to the proportion of private land area each class covers within a sample unit and then summed into a single measure.
Representing Historical Landscapes Three pairs of Landsat Multispectral Scanner (MSS) satellite imagery were collected that cover the study area for the approximate years 1973, 1985, and 1991. Each satellite image was registered, georeferenced, and distributed as part of the North American Landscape Characterization (NALC) data set at a spatial resolution of 60 m (Lunetta et al. 1998). Table 2 lists our image inventory. Slight registration errors were detected and corrected using PCI ImageWorks (pCI, Richmond Hill, Ontario) workstation software and known UTM coordinate system information obtained for regional road networks stored in vector GIS format (MIRIS, 1978). Table 2. Inventory ofNALC imagery used for target dates. 1970
1980
1990
West East
West East
West East
22/29 21129
22/29 21129
22/29 21129
Date acquired
6/09173 8/01175
6/28/85 8/08/85
Sun elevation
60 53
59 53
56 52
Sun azimuth
128 127
124 131
133 129
Path/Row
7115191
8/09/91
All NALC images are distributed with a 60 meter pixel resolution.
Clouds in the images were identified and removed through on-screen polygon digitizing according to their popcorn shapes and corresponding displaced shadows. The cloud and cloud-shadow polygons were then used to "mask" the images, thus removing pixel values associated with these features.
164 In an effort to further reduce the amount of non-essential variation between corresponding images, each individual scene was clipped by the areal extent of the study area plus a 1.5 kilometer buffer zone. The histogram matching method (Jensen 1996, Homer et al. 1997, Vogelmann et al. 1998) was used to improve the comparability of spectral response values in adjacent images for mosaicking purposes. Regions of spatial overlap were selected and the distribution of brightness values in one image was normalized to match the distribution of brightness values in the other image. This normalization, or matching, was carried out for each spectral band and each date. After each pair of masked and clipped images were histogram matched and mosaicked, a composite cloud mask, which was generated by aggregating all clouded areas within all six images, was used to mask the three resultant image mosaics. This masking was done in order to maintain a consistent area of analysis throughout the experiment. Our primary remote sensing task was to identify and distinguish all forested areas from non-forested areas. The target classification scheme included five classes: forested areas, not forested areas, open water, clouds, and background. The ISODATA clustering algorithm (Tou and Gonzalez 1977) was used to identify statistically homogenous areas within each landscape mosaic. The four MSS image bands, plus a fifth Normalized Difference Vegetation Index (NDVI) band, were used as inputs to the classification. The NDVIband, a mathematical combination of MSS bands 2 and 4 (Jensen 1996), has been found to be a sensitive indicator of the presence of green vegetation (Lillesand and Kiefer 1994). Vegetated areas, like trees and forest canopies, will generally yield higher NDVI values than bare soils, urban surfaces, water, or clouds. The algorithm converged on a solution set of 72 clusters for each mosaic. Subsequent to cluster analysis, three sets of 16 aerial photograph mosaics (each set was obtained for the approximate dates 1970, 1980, and 1990) were used to aide cluster identification and accuracy assessment. The photos had already been scanned at 2 m resolution, georeferenced, and mosaicked into images corresponding to the 5 x 5 km sample areas in Grand Traverse and Crawford Counties used by Brown et al. (2000). The temporal sets of photographs were randomly divided into two subsets of eight by maximizing the geographic extents covered by each. The first subset for each date was used to identify and classify clusters and assign them to historic land cover types. The second subset was set aside for use in testing the quality of the final classification maps (Drzyzga 2000). For accuracy assessment, stratified random sampling was used to select pixel locations within derived land cover areas that were also represented by historical aerial photographs. This process was stratified so that small, but potentially important, areas were not undersampled (Lillesand and Kieffer 1994). Next, all selected pixel locations were attributed with both image and reference class information. Finally, error matrices were calculated to summarize the
165 classification accuracy at each date (Table 3). This method is often preferred to the post classification training set method, because the random method allows for the selection of pixels that represent borders between adjacent land cover categories. In a study of forest fragmentation, boundaries between forested and non-forested land cover categories are important ecological features and should be considered in any accuracy assessment. The post classification training sets method tends to avoid such boundaries as homogeneous areas are preferred. A water mask was created using published 1:100,000 Digital Line Graph hydrography data (U.S. Department of the Interior 1993) to remove pixels associated with water from each classified image. In reality, open water boundaries are rarely static in nature - even over geologically short ten and twenty year periods. However, we assumed constancy of the presence and extent of open water within the study area in order to isolate changes between forested and non-forested land covers. Table 3. Error matrices and summary statistics for NALC image mosaics.
1973
Airphoto Reference Data NF FOR ROW
NF FOR COL PROD
284 81 365 77.8
59 440 499 88.2
1985
NF
FOR
NF FOR COL PROD
275 56 331 83.1
29 499 528 94.5
1991
NF
FOR
NF FOR COL PROD
231 20 251 92.0
28 529 557 95.0
343 521 864 Khat = PCC= ROW
304 555 859 Khat = PCC= ROW
259 549 808 Khat = PCC=
FOR NF USER PROD Khat PCC
Pixels as land Forested Pixels as land Not Forested User's accuracy Producer's accuracy Estimate of Kappa Statistic Percent Classified Correctly
USER
82.8 84.5
66.5 83.8 USER
90.5 89.9
78.8 90.1 USER
89.2 96.4
86.3 94.1
166
Q.
1973
b.1985
c.1991 Figure 3. Forest cover data for (a) 1973, (b) 1985, and (c) 1991. Forested areas shown in green hue or gray tone. Inland waters shown in black. Buffer omitted from display.
167
Finally, the forest cover data were converted into a vector GIS format and overlayed with the parcel data. Spatial overlay allowed further partitioning of the forest data into private and non-private categories. The data were partitioned to ensure changes in privately owned parcels could be compared to changes in privately owned forests. All subsequent references to changes in forest cover and forest fragmentation are limited to changes observed on privately owned lands. Figures 3a, b, and c represent the three final forest cover data sets.
Quantifying Forest Cover For any given region, the total area as forested was estimated by summing all polygon areas classified as forested. Also, the proportion ofland as forested was estimated by dividing the sum of privately owned forest areas by the sum of all non-water and non-cloud, private areas. The amount ofland as private remained nearly constant over the twenty-year period. Therefore, calculated changes in the proportion of land as forested can be attributed to observed changes in forested area (the numerator) and not to changes in the amount ofland as private (the denominator).
Quantifying Forest Fragmentation Landscape ecology is based upon the premise that landscape patterns are indicative of ecological processes (Forman and Godron 1986, Turner 1989, Gustafson 1998) and quantitative metrics allow measurable links to ecological processes to be determined (Frohn 1998). In the landscape ecology literature, spatially distinct and contiguous areas within a landscape class are referred to as patches. Patches can be quantitatively described in terms of size, shape, interior core area, and complexity (Forman and Godron 1986, Milne 1991, Turner and Gardner 1991, Baker and Cai 1992, Li and Reynolds 1993, McGarigal and Marks 1995, and Riitters et al. 1995). Studies of forest fragmentation often use metrics to describe interior core areas and edge effects (Merriam and Wegner 1992, Villard et al. 1992, Fahrig and Merriam 1994). Interior core areas, sometimes referred to as interior habitat areas, are internal patch areas where some natural species and ecosystems can function independently and better sustain themselves. These interior areas contain requisite energy, nutrients, materials, and gene pools necessary for selfperpetuation. Edges are portions of an ecosystem (forest patch) near the perimeter where influences of surrounding areas prevent natural interior environmental conditions (Forman 1995) and can be considered habitat by other species. Those forest areas influenced by the effects of non-forest edges are often called disturbed forest areas. Thus, patch size and shape can influence
168 population dynamics and survival as two patches of the same area but with different amounts of edge may produce core areas of differing quality and species composition (Saunders et al. 1985, Saunders et al. 1991). Gustafson (1998), however, is critical ofthe current set oflandscape metrics often used in the landscape ecology literature and of the lack of any means to interpret them consistently. He states, "[t]here is seldom a one-to-one relationship between index values and pattern (that is, several configurations may produce the same index value)" (p.150). In the same paper he argues ... "[v]ery few pattern indices produce values that are useful by themselves. Their most instructive use is in comparing alternative landscape configurations, either the same landscape at different times or under alternative scenarios, or different landscapes represented by using the same mapping scheme and at the same scale" (p.152). So, we constructed a new landscape index that can be a) useful by itself, b) useful for describing conditions of forest fragmentation, and c) have a direct relationship with degrees of fragmentation. The core fragmentation (CF) index (Drzyzga 2000) can be derived with the following equation, which is expressed here in condensed terms: CF =
~-CORE~
COREmax
The CF index is interpreted as the proportion of the maximum potential core area (COREmax) of a patch or class that is not core area (COREmax - COREobs) because of shape induced edge effects. The index is constrained between zero and one. Calculated CF values approaching a value of one indicate a highly fragmented landscape with all forested areas being influenced by edge effects. Urban forests, with few core areas would generally fit into this category. Calculated CF values approaching zero indicate a forest unfragmented and subjected to minimal edge effects. Such areas would include interior areas of very large forest stands.
Sampling Landscapes with Political Units Land use planning in the USA is often based on a local decision process that is directed by local legislation. Under such legislation local planning boards are given the authority to develop ordinances to regulate land uses, protect natural resources, and limit congestion of human populations. Land-use regulation in Michigan occurs at the township level, therefore townships are important organizational units for land and ecological planning. For this reason, each digital landscape was sampled using township units (see Figure 2). Sampling in
169 this way allows for parcel data to be aggregated in meaningful ways and, perhaps, an opportunity to uncover spatial patterns associated with township behaviors.
Sampling Landscapes with Concentric Zones First-hand observations indicate that the spatial structures of land uses and land consumption around Traverse City appear annular with respect to the CBD. Given this general structure, we sampled the region using concentric zones that radiate from the CBD (Figure 4). Of course, this sampling method borrows from the oldest theories oflandscape organization (von Thiinen 1842) and urban structure (Burgess 1925), and these theories suffer gross assumptions about the behavior of individuals acting on a landscape. However, given our observations, we proceeded with this basic sampling scheme and the idea of making informed adjustments during future research based on our results.
Figure 4. Concentric zones around Traverse City, Michigan.
Land ownership and land cover data were divided into several distance bands of equal width (3 kIn) and APS, percent forest, and CF index values were calculated for each band to characterize the distributions of parcelization and forest structure around Traverse City. The spatial patterns ofland consumption, forest cover, and forest fragmentation radiating from Traverse City can be visualized by plotting calculated index values against the middle distance value of each band and interpolating values between known points. To estimate changes in the potential extent of urban land uses around Traverse City, we compared each APS value to a threshold value of 4.05 ha. We chose a parcel size threshold value of 4.05 ha, because the equivalent in acres is used by Michigan lawmakers to distinguish lands available for development from open lands unavailable. Starting from the center of the city and moving outward, the urban extent can be marked at the first distance that
170 average parcel size values exceed the threshold value. Movement ofthe urban extent can be tracked over time by plotting this relationship for successive dates and observing positional changes in the calculated intersection. Should results indicate the extent of developable areas associated with Traverse City increased over time, those areas that came under urban pressures may have experienced decreases in forest cover and increases in forest fragmentation. Conversely, should the extent of developable areas have decreased over time, those areas relinquished from urban pressures may have experienced increases in forest cover and decreases in forest fragmentation. Population figures reported for the Traverse City region from 1970 to 1990 indicate a positive population growth trend. This trend leads to the hypothesis that the urban extent of Traverse City increased over time and consequently, fragmentation increased in pressured areas within it.
RESULTS Parcelization Calculated APS values show that regional average parcel sizes decreased (see Table 4) from 9.6 ha in 1970, to 4.9 ha in 1980, and to 4.1 ha by 1990. Changes between index values also indicate that average annual parcelization rates decreased over time. These trends coincided temporally with residential population growth trends. Care should be taken, however, in interpreting this temporal coincidence as a causal relationship. Spearman's rank-order correlation coefficients between township population growth rates (average number of persons per year) and parcelization rates (average change in parcel size per year) indicate that township parcelization rankings were statistically unrelated to residential population growth rankings (Table 5). Furthermore, correlation results of lagged rankings suggest that changes in land subdivision were not related statistically to earlier residential changes. These statistically insignificant correlations do not necessarily discount the role new resident populations played in the land subdivision process, but suggest that other factors must have played a large role. Seasonal populations are not accounted for in census counts and were not accounted for in this simple test for correlation. Stewart (1994) and Stynes et al. (1997) have shown how seasonal home development and seasonal populations have contributed to rural landscape development in the Great Lakes region. It is likely that new second or seasonal homeowners also influenced the subdivision process. These results suggest that a measured change in residential population alone may not serve as an adequate indicator of potential land ownership change for this region.
171 Table 4. Average parcel size (APS, in hectares), percent forest, and core fragmentation (CF) index values for counties and townships by date.
1970 Region totals
Crawford Beaver Creek Frederic C. of Grayling Grayling Lovells Maple Forest South Branch Grand Traverse Acme Blair East Bay
Fife Lake Garfield Grant Green Lake Long Lake Mayfield Paradise Peninsula Traverse City Union Whitewater Kalkaska Bear Lake Blue Lake Boardman Clearwater Cold Springs Excelsior Garfield Kalkaska Oliver Orange Rapid River Springfield
APS 1980 1990
Percent Forest 1973 1985 1991
CF Index 1973 1985
1991
9.6
4.9
4.1
54.0
55.7
58.7
0.662 0.524 0.543
5.7 7.8 6.2 3.4 3.4 6.8 10.5 5.6 12.2 10.8
3.3 3.9 3.4 7.0 2.4 4.3 5.1 3.0 5.8 6.3 5.0 3.6 5.6 3.3 9.5 4.8 3.8 10.3 7.8 4.9 0.4 8.6 5.6 5.4 3.8 4.0 6.9 5.9 3.2 6.3 5.1 5.1 5.7 6.1 4.4 6.5
3.0 3.1 2.9
74.1 69.5 73.0 28.3 78.0 80.7 57.6 74.3 43.8 31.6 41.0 46.9 48.9 27.7 56.7 59.9 42.7 41.5 46.2 29.2 16.3 63.0 42.7 53.8 76.6 72.6 41.1 53.0 78.2 49.1 54.7 47.6 60.9 47.1 43.1 44.0
77.6 75.3 77.5 36.4 75.3 83.7 63.7 84.2 40.2 26.0 36.6 44.2 55.6 21.4 44.6 59.1 40.7 27.4 48.2 25.1 27.5 72.6 42.0 60.9 85.5 76.1 49.0 61.9 81.6 58.0 60.5 52.0 66.1 55.8 52.3 52.1
75.6 70.2 77.5 23.7 71.9 81.7 64.4 83.0 44.2 34.1 39.6 49.3 58.2 25.0 49.0 61.9 44.6 31.1 49.8 27.4 24.6 75.4 49.0 65.9 87.2 79.9 54.5 66.5 83.8 64.3 64.4 59.6 72.0 60.9 56.4 59.2
0.597 0.405 0.461 0.620 0.439 0.534 0.555 0.376 0.421 0.710 0.600 0.715 0.543 0.441 0.509 0.636 0.368 0.435 0.607 0.497 0.544 0.631 0.310 0.339 0.728 0.662 0.669 0.792 0.699 0.752 0.723 0.670 0.654 0.724 0.684 0.691 0.713 0.549 0.563 0.862 0.870 0.867 0.611 0.601 0.607 0.605 0.541 0.552 0.762 0.730 0.715 0.779 0.770 0.784 0.710 0.627 0.618 0.848 0.855 0.870 0.957 0.992 0.978 0.691 0.508 0.506 0.694 0.576 0.607 0.647 0.501 0.492 0.601 0.313 0.295 0.525 0.538 0.506 0.805 0.614 0.606 0.591 0.487 0.491 0.454 0.399 0.367 0.682 0.419 0.439 0.690 0.530 0.535 0.729 0.608 0.578 0.567 0.365 0.364 0.706 0.501 0.502 0.6090.5210.512 0.713 0.576 0.550
11.8
7.1 16.9 6.8 17.9 10.9 8.2 23.1 22.5 6.9 0.7 15.9 11.7
10.7 7.3 5.4 11.6 11.6 6.5 12.4 9.5 9.9 11.3 17.5 9.0 13.0
2.2 3.9 4.3 3.3 4.3 4.3 3.7 2.8 5.4 2.3 7.6 3.7 2.5 8.1 6.5 3.0 6.7 4.5 4.8 3.0 3.0 5.8 4.6 2.9 5.3 5.3 4.5 5.7 6.0 4.2 5.7
172 Changes in parcel size frequency distributions were calculated and compared to infer changes that occurred on the landscape (Figure 5). At first glance, one can see each distribution is skewed, is multi-modal, and has peaks occurring in the 4, 8, 16, 32, and 65 hectare bins. These peaks portray the effects of recursive halving or quartering of survey sections - results typical oflandscapes surveyed according to the PLSS. Table 5. Spearman's rank correlation coefficients that characterize the relationships between township population growth and parcelization rates. Average annual population growth rates 1970s 1980s
Average annual parcelization rates for
1970s
0.05 (n=33)
1980s
0.24 (n=31)
0.21 (n=31)
All correlation coefficients were determined to be not significantly different from zero using a 95 percent confidence interval.
----1990 ............ 1980 --1970
o
o
4
8
12
16
20
24
28
32
36
40
44
48
52
56
60
64
..
Average Parcel Size (ha) Figure 5. Frequency distributions for private parcels. Numbers of parcels with area values less than Iha omitted for display. Omitted values are; 55874 (1970), 89697 (1980), and 94936 (1990).
Figure 5 reveals large increases in the number and aggregate extent of small parcels and coincident decreases in the number and aggregate extent of large parcels over time. (Numbers of parcels less than 1 ha in size were calculated by dividing the total area classified as small tracts by 0.2 ha, the assumed average
173 parcel size in small tract areas.) In 1970, parcels smaller than 1 ha, in aggregate, consumed 6% (11415 ha) of private land, while parcels larger than 65 ha consumed more than 19% (43710 ha). By 1990, parcels larger than 65 ha covered only 4% (10620 ha) in aggregate, while parcels smaller than 1 ha consumed 10% (19740 ha). Newly created parcels were carved out oflarger parcels given the finite amount of private land. On this landscape however, many newly created parcels seem to have been carved out of the largest large parcels. Figure 5 also reveals large increases in the number and aggregate extent of parcels 4 to 5 hectares in size. These increases likely reflect the influence the SCA had on the parcelization process during this time. These parcels are important for three reasons. First, many parcels of this size now exist; second, they accounted for a relatively large area in aggregate (5%) by 1990; and third, we suspect that many land cover changes have occurred on these parcels. For example, the possibility exists that large parcels, perhaps once held in agriculture, were subdivided into these 4.05+ ha parcels. If this is true, then the likelihood exists that subsequent residential development was concentrated on only a small portion of each parcel (e.g., a driveway, house and lawn), thereby leaving the balance of each to regenerate from an open field condition into a young forest condition. This scenario might support the forest growth trend reported by Leatherberry (1994). Regional Forest Ownership Parcelization
Although we defined fragmentation with respect to a type of physical landscape configuration, the ownership connotation is important to some planners and planning agencies. A useful way to recognize and visualize private forest parcelization is to calculate and compare forested parcel size frequency distributions for different dates. For our purposes, a forested parcel is a parcel that holds at least 50 percent of its area as forest. Parcels in small tract areas are not considered because without specific boundary data, the spatial coincidence between individual lots and forest polygons cannot be calculated. Figure 6 illustrates frequency distributions of forested parcel areas. Each distribution displayed in Figure 6 is positively skewed, is multi-modal, and has peaks occurring in the 4, 8, 16,32, and 65 hectare bins, like each total private parcel distribution. Forested parcel distributions are similar to total parcel distributions (Figure 5), because many parcels hold an areal majority as forest cover. Changes between measured parcel size frequencies can be used to infer changes in forest ownership parcelization. For example, Figure 6 reveals large increases in the number and aggregate extent of small, forested parcels and coincident decreases in the number and aggregate extent of large forested parcels over time. Additional spatial queries revealed that in 1970, forested parcels smaller than 5 ha but not including small tracts (n=1300) contained 3%
174
2000·
?;'
!
I
---- 1990 ············1980 -----1970
1200
800
Average Parcel Size (ha) Figure 6. Frequency distributions of forested parcel sizes. Numbers of lots with area values less than Iha not calculated.
(3100 ha) of privately owned forest, while forested parcels larger than 65 ha (n=287) contained more than 26% (30000 ha). By 1990, forested parcels larger than 65 ha (n=187) contained only 19% (21300 ha) of forest, while forested parcels smaller than 5 ha (n=5190) consumed 13% (19430 ha). Obviously, the number of forest ownerships increased as thousands of new landowners gained control over private forests. It is no wonder that forest managers are concerned about how to best implement new management strategies, especially when so many forest owner viewpoints must be recognized and considered. Figure 6 also reveals large increases in the number and aggregate extent of parcels 4 to 5 hectares in size. Again, increases in the number of parcels that fall into this category likely reflect the influence that the SCA had on the parcelization process. Parcelization Results for Townships
The APS index was used to estimate the average size of parcels for each county and township (Table 4). In every case but one (i.e., the City of Grayling), APS values decreased over time. Temporal changes in APS values indicate that average annual parcelization rates were greater during the 1970s than during the 1980s. Although change magnitudes varied over space, parcelization increased almost everywhere. Almost all small tract areas mapped within the City of Grayling on the 1970 map had, by 1980, been cartographically reclassified by the publisher (Rockford
175 Map Publishers Inc. 1969-1991) into polygons associated with the incorporated city. Subsequently, no small tract areas were used in the calculation of the 1980 APS index and the resultant value did not measure their influence. No APS values were calculated for the City of Grayling and Traverse City for 1990 because all private parcels had been cartographically reclassified into city-owned parcels by 1990. Hence, each respective value was replaced with a no data entry in Table 4. Parcelization Results for Concentric Zones
Land consumption patterns were summarized for the area around Traverse City by calculating APS index values for a set of concentric zones radiating from the geometric center of the City (Figure 7). Based on our lmowledge of the applicable land use law, we assumed 4.05 ha to be the largest parcel size 18
M •• M
-"
-----0-
G)
12
14
~a:I
0G)
co
!Ql
1970
-0-1980
Ii .s:: .1:::1
Threshold
--A-1990
J
-::
6
~
30
Midpoint distance from Traverse City (km) Figure 7. APS values for concentric zones by date.
associated with developable parcels. The approximate extent of potential urban land uses could be estimated for each date by comparing APS values calculated for all 1970, 1980, and 1990 distance bands to the threshold value. Figure 7 clearly shows that the first distance at which average parcel size values exceeded the threshold value increased over time. In 1970, the first intersection occurred between the first and second bands. In 1980, the first intersection occurred between the second and third bands. By 1990, the intersection occurred between the fifth and sixth bands. Movement of this intersection away from the city suggests the approximate urban extent of Traverse City increased over time. This movement can be characterized as a form of urban sprawl.
176 The parcel size gradient flattened over time. Such flattening indicates locations farther from the city subdivided faster than locations closer to the city. This trend can be interpreted to mean places farther from Traverse City gained better access to the city and its amenities, and therefore attracted new landowners, or proximity to the city became less important over time. Either of these reasons, or a combination of both, may explain why adjacent townships like Acme, East Bay, and Garfield experienced large increases in resident populations during the same period that Traverse City experienced small losses. Whatever the cause, the parcel landscape became more homogenous over time.
Regional Forest Changes Regional percentages of private land as forested were calculated for each date. The percentage of forested private land increased over time from 54.0 percent in 1970, to 55.7 percent in 1980, and to 56.7 percent by 1990. Because the amount of private land remained almost constant over time, differences between percentages show regional forests increased over time. Also, average annual changes suggest the region experienced higher regrowth rates during the 1970s than during the 1980s. These regrowth trends coincide temporally with residential population growth trends. CF indices were calculated to estimate fragmentation conditions for each of the three image dates. Regional CF values decreased from 0.66 in 1973 to 0.52 in 1985 but increased slightly to 0.54 by 1991. In general, changes between dates show forest fragmentation decreased between 1973 and 1991. The longterm trend is, however, insensitive to the shift from a period of defragmentation to a period of fragmentation. This shift provides evidence to support WyckofPs (1995) concern that continued development may ultimately increase fragmentation in this region. Forest Results for Counties and Townships
In most townships, we observed mixed trends of forest growth and loss (Table 4). Townships such as Bear Lake, Blue Lake, Union, and Fife Lake exhibited 18-year growth trends. Only Grayling Township exhibited an eighteen-year trend of forest loss. These mixed results show the forest recovery trend is an aggregate trend and does not apply to all areas within the region. These results also indicate that forest growth occurred in many townships that exhibited increases in both population and parcelization. Therefore, the association between land ownership change and forest cover change is neither simple nor perfectly indirect. Grayling Township is the largest township in Crawford County and it contains many public land areas. The large amount of forest loss in a township that contains so many private lands adjacent to protected areas was surprising. Additional research revealed several large forest fires occurred in areas in or
177 around Grayling Township between 1985 and 1991 (U.S. Forest Service, 1997). For example, the Stephan Bridge Road fire of 1990 burned 2450 ha of private and public forest in Crawford County (Winter and Fried 1997). Most of the forest losses associated with the Stephan Bridge Road fire occurred in Grayling Township thus, they contributed to the loss trend observed between the 1985 and 1991 satellite images. The forest fragmentation index (CF values) was calculated for the region, each county, and each township (Table 4). No dominant fragmentation trend existed over the entire eighteen-year period. Crawford and Grand Traverse Counties exhibited trends of defragmentation from 1973 to 1985 and trends of fragmentation from 1985 to 1991. Most townships within these two counties, with exceptions like Blair, Long Lake, and Union Townships, exhibited similar trends. Kalkaska County demonstrated an eighteen-year defragmentation trend even though townships like Clearwater, Excelsior, and Garfield exhibited increased forest fragmentation between 1985 and 1991. Grayling Township exhibited an increase in fragmentation after 1985, probably due to changes in forest amount and structure caused by fire. Forest Results for Concentric Zones
The spatial structures of forest cover around Traverse City can be visualized by plotting percent forest values against zone midpoints (Figure 8). In general, percentage values increased with increasing distance from the city. These results are quite reasonable as lesser amounts of forest can be expected to exist in locations closer to the city as more land in these locations was dedicated to anthropogenic land uses. However, some interesting temporal changes can be observed. For example, the spatial structure of forest cover changed between 1973 and 1985 as some areas experienceOforest declines while others did not. These spatial differences occurred even though all areas exhibited increases in land ownership subdivision. However, the general structure remained the same between 1985 and 1991. CF values were calculated and plotted for each concentric band in order to characterize the spatial structure offorest fragmentation (Figure 9). In general, CF values tended to decrease with an increase in distance from the city. This general structure is reasonable because higher degrees of forest fragmentation tend to exist in areas with relatively little forest or many forest edges, like in urban areas. However, specific temporal changes indicate that the spatial structure of forest fragmentation changed between 1973 and 1985. In areas beyond the 1985 urban extent, forest fragmentation decreased during a period of forest loss. Also, it appears fragmentation decreased at an increasing rate with an increase in distance. The general structure remained almost constant between 1985 and 1991, even though all areas exhibited forest growth.
178
57
r
oo
l!!
..e tJ)
ro
"0
.::
..!i!
~t
~
I
~ .;::
a.
.Q}::
27
1::: !l)
0.
12
t
~1991
l
·-