Wetlands Ecology and Management 6: 221–240, 1999. © 1999 Kluwer Academic Publishers. Printed in the Netherlands.
221
Spatial and temporal patterns of sediment and nutrient accumulation in shallow lakes of the Upper St. Johns River Basin, Florida M. Brenner1 , L.W. Keenan2 , S.J. Miller2 & C.L. Schelske1 1 Department
of Fisheries and Aquatic Sciences, University of Florida, 7922 NW 71st Street, Gainesville, FL 32653, U.S.A.; E-mail:
[email protected] 2 St. Johns River Water Management District, P.O. Box 1429, Palatka, FL 32178, U.S.A. Received 15 July 1997; accepted in revised form 5 May 1998
Key words: Florida, lake, 210 Pb dating, macrophytes, nutrients, paleolimnology, river, sediment, wetland
Abstract We used paleolimnological methods to investigate spatial and temporal patterns of bulk sediment and nutrient (C, N, P) accumulation in Lakes Hell ‘n’ Blazes (A = 154 ha, zmax = 240 cm), Sawgrass (A = 195 ha, zmax = 157 cm) and Washington (A = 1766 ha, zmax = 322 cm), in the Upper St. Johns River Basin, Florida. The study was designed to evaluate long-term changes in sedimentation and nutrient storage in the basin, and was one component of a larger project addressing flood control, wetland restoration, and water quality improvement. These three study lakes are wide, shallow waterbodies in the upper reaches of the St. Johns River channel. Sediment mapping indicates soft, organic deposits are distributed uniformly throughout Lakes Hell ‘n’ Blazes and Sawgrass. In contrast, much of Lake Washington is characterized by sandy bottom, and organic sediment is largely restricted to the north end of the lake. Lakes Hell ‘n’ Blazes and Sawgrass are effective sediment traps because dense submersed macrophytes and their associated epiphytes reduce flow velocity, intercept suspended particles, and utilize dissolved nutrients. Abundant Hydrilla, combined with short fetch, prevents resuspension and downstream transport of sediments. Larger Lake Washington is probably wind-mixed and resuspended organic sediments are redeposited to downstream sites. 210 Pb-dated sediment cores show that organic sediment accumulation began in all three lakes before 1900, but that bulk sediment and nutrient accumulation rates have generally increased since then. The increases are probably attributable, in part, to anthropogenic activities including 1) hydrologic modifications that reduced flow rates in the channel, 2) discharge of nutrient-rich waters from urban, agricultural and ranching areas, and, 3) introduction and periodic herbicide treatment of the exotic macrophytes Eichhornia and Hydrilla.
Introduction The Upper St. Johns River Basin lies in an extensive floodplain marsh, principally in Brevard and Indian River Counties, east-central Florida (Figure 1). Surface waters in the marsh flow into tributary streams that feed the main channel of the St. Johns River that meanders northward, traversing > 500 km before discharging into the Atlantic Ocean near Jacksonville. The headwaters of the river pass through a series of lakes that constitute wide, shallow basins in the channel. Principal lakes that occupy the river channel from south to north include Hell ‘n’ Blazes, Sawgrass, Washington, Winder and Poinsett. These lakes cover
71.3 km2 , including southernmost Blue Cypress Lake, which is not connected directly to the river by channel flow. The previously vast wetland once covered nearly 1800 km2. It constitutes the primary water source for the river and has been exploited increasingly since the turn of the century. The region is characterized by rich histosol soils that are ideal for ranching, citrus production and row crops. Agricultural interests began draining marshland on a large scale around 1910 (Sincock, 1958). Construction of the Fellsmere Grade and State Road 60 across the St. Johns River floodplain began before 1930, when the combined population of Brevard and Indian River Counties was only about
Article: wetl97-13 Pips nr. 185523 (wetlkap:bio2fam) v.1.1 wet97-13.tex; 6/05/1999; 22:00; p.1
222
Figure 1. Map of the Upper St. Johns River Basin, showing the locations of Lake Hell ‘n’ Blazes, Sawgrass Lake, and Lake Washington. Inset map shows the location of the Upper St. Johns River Basin in Florida.
20,000 (Florida Statistics, 1995). State Road 512 was built by 1943, and by the end of World War II, further draining had reduced the floodplain area in the basin from ∼ 1760 km2 to ∼ 1270 km2 (Sincock, 1958). In the mid-1950s, canal construction and damming were undertaken as part of the Central and Southern Florida Flood Control Project that had been authorized by the U.S. Congress (Hall, 1987). By 1957 the area in floodplain had been reduced to 725 km2 . A sandbag dam was placed across the Lake Washington outlet in 1961. Severe drought struck the region over the next three years, and by 1965 the remaining floodplain area ( 260 km2 ) had shrunk to about 15% of its original size (Hall, 1987). In 1966, the Upper St. Johns River Project was begun largely to address flood control problems, but was halted in the mid-1970s to evaluate the environmental impacts of project construction. At the same
time, the St. Johns River Water Management District undertook a comprehensive re-study of the area. By 1980, nearly 80% of the 3720 km2 in the entire Upper St. Johns River Basin had been converted to pasture (70.6%), agricultural use (5.0%), urban development (3.4%) or silviculture (0.1%), with the balance in wetlands (18.5%) or open water (2.3%) (SJRWMD, 1980). Drought struck again in 1981, the same year in which the exotic aquatic macrophyte, Hydrilla verticillata, was first reported in the basin. By 1990, the population in Brevard and Indian River Counties had grown to more than 489,000, which is a nearly 25-fold increase in just 60 years. The remaining wetlands in the Upper St. Johns River Basin still provide habitat for rare and endangered species, including wood storks (Mycteria americana), snail kites (Rostrhamus sociabilis plumbeus), bald eagles (Haliæetus leucocephalus leucocephalus)
wet97-13.tex; 6/05/1999; 22:00; p.2
223 and Florida sandhill cranes (Grus canadensis pratensis). Egrets, herons and ibis are plentiful. The wetlands, streams and lakes are also exploited by local inhabitants for multiple uses. Fishing, hunting, birding, boating and airboating are common recreational activities. Irrigation water is withdrawn from surrounding management areas, wells, and farm retention ponds. Lake Washington provides potable water for southern Brevard county. Development and exploitation of the Upper St. Johns River ecosystem has modified the environment in several ways. Construction of roads, berms, and dikes compartmentalized portions of marsh, thereby altering water flow patterns. In many areas, water is channelized and some flow is diverted away from the St. Johns River into the Indian River Lagoon. The river gradient is low, averaging ∼ 1.9 cm km−1 over its length (Aldridge et al., 1998). Blue Cypress Lake, the southernmost headwater lake in the system, lies only 5.59 to 8.14 m above sea level, depending on stage. Water withdrawal and diversion from the ecosystem reduced water levels in the marsh, resulting in river flow rates that are considerably lower than predisturbance rates (Lowe et al., 1984). Drying of the marsh permitted the expansion of woody vegetation into areas previously occupied by herbaceous, wetmarsh plants, and aerial photographs document the loss of open-water habitat in Lake Hell ‘n’ Blazes between 1920 and 1953. It was estimated that by 1980, flow into the St. Johns River from the Upper Basin had been reduced to about 55% of its pre-development level (Tai and Rao, 1982). Recently, there has been concern that modification of the ecosystem has had negative impacts on the environment. Fishkills are attributed to daily and seasonal reductions in oxygen concentration in the river water (Lowe et al., 1984). Biological oxygen demand (BOD) is naturally high, but is exacerbated by inundation of the seasonally dry marsh. Further oxygen consumption probably occurs when organic sediments that accumulate in canals during dry weather are discharged into the river as a consequence of increased rainfall and rising water levels. High nutrient concentrations in lakes of the Upper St. Johns River Basin indicate eutrophic conditions that may be enhanced by pumping from agricultural lands and discharge of stormwater (Lowe et al., 1984). Total nitrogen and total phosphorus concentrations in Lake Hell ‘n’ Blazes average 1.32 and 0.05 mg L−1 , respectively. Comparable or higher mean nutrient concentrations are reported for Sawgrass Lake
(N = 1.37 mg L−1 , P = 0.04 mg L−1 ), Lake Washington (N = 1.56 mg L−1 , P = 0.05 mg L−1 ), Lake Winder (N = 1.48 mg L−1 , P = 0.10 mg L−1 ), and Lake Poinsett (N = 1.49 mg L−1 , P = 0.09 mg L−1 ). Despite high total nutrient concentrations, chlorophyll a concentrations are fairly low (Hell ‘n’ Blazes = 5.3 mg L−1 , Sawgrass = 7.5 mg L−1 , Washington = 3.7 mg L−1 , Winder = 11.0 mg L−1 , Poinsett = 18.0 mg L−1 ). Relatively low algal standing crops are probably a consequence of light limitation due to dissolved color (range in lakes = 106–125 Pt L−1 ) in combination with relatively short retention times. Algal production may also be limited by competition for available nutrients from macrophytes and associated epiphytes. In addition to fishkills, declines in the local sport fishery have been blamed on accumulation of organic sediment on lake bottoms (Cox et al., 1976). Accrual of organic deposits is thought to have reduced available fish spawning areas. Organic matter accumulation has been attributed to several factors. First, it was suspected that organic deposits originated in part from exotic hyacinth (Eichhornia crassipes) mats that were periodically controlled by herbicide application. More recently, submersed Hydrilla has proliferated in the lakes and is subject to periodic control measures. This plant also promotes the settling of organic particulates that would otherwise move through the lakes with channel flow. Organic sediment accumulation has also been thought to be caused by flow reductions and weir construction that restrict flushing and downstream transport of organic particulates. Whereas floating islands or other debris partially restricted flow in the past, these natural jams were removed and replaced by more effective weir structures in the 1950s. Smaller lakes like Hell ‘n’ Blazes and Sawgrass are thought to serve as settling basins for suspended material, because studies showed suspended solid concentrations are higher in inflow waters than in outflow waters (Belanger et al., 1983). Larger Lake Washington, on the other hand, traps little of the incoming suspended solid load. Preliminary sediment mapping in 1971 (Cox et al., 1976) and 1982 (Belanger et al., 1983) consisted of measuring organic sediment accrual along a single longitudinal or transverse transect in lakes of the Upper St. Johns River Basin. The combined results of the two studies showed moderate accumulation of organic deposits in the channel basins, ranging from 20–102 cm in Lake Hell ‘n’ Blazes, 13–41 cm in Sawgrass Lake, 0–64 cm in Lake Washington, 0–18 cm in Lake Winder, and 0–48 cm in Lake Poinsett. In an-
wet97-13.tex; 6/05/1999; 22:00; p.3
224
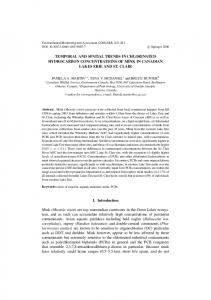
Figure 2. Outline maps of Lake Hell ‘n’ Blazes (a), Sawgrass Lake (b), and Lake Washington (c) showing locations of sampling sites.
other study, a single 210 Pb-dated core from Lake Hell ‘n’ Blazes indicated that ∼ 40 cm of organic sediment had accumulated at the core site between 1882 and 1982 (Lowe et al., 1984). Sedimentation rates were generally low from ∼ 1882 to 1935, but increased in the period between 1935 and 1952. Accumulation slowed in the 1950s and 1960s, but was again high in the 1970s. The early sediment studies (Cox et al., 1976, Belanger et al., 1983) suggested two alternative models of deposition in lakes of the Upper St. Johns River Basin (Lowe et al., 1984). Model 1 proposed that sediments are deposited in upstream lakes, but accrue only temporarily before they are resuspended and transported to downstream sites. Model 2 suggested that organic sediment accrual is slow but permanent in small upstream lakes with accumulation increasing in recent years. Model 2 also postulated that accumulation in large, downstream lakes is minimal and perhaps temporary. Investigations in the region continue today under the auspices of The Upper St. Johns River Project. It is a $ 195-million effort being conducted by the U.S. Army Corps of Engineers and the St. Johns River Water Management District. Two objectives of the project are flood control and wetland restoration. Now about 90% completed, the plan incorporates the use of restored floodplain wetlands for stormwater storage (Campbell et al., 1984). The total project area covers ∼ 645 km2 , about 200 km2 of which lie in pre-
viously drained floodplain. Another goal of the project is maintenance and improvement of water quality. The Florida Department of Environmental Protection requires the Florida Water Management Districts to establish maximum allowable levels for nutrient discharges into all watersheds and selected waterbodies. Nutrient dynamics throughout the Upper St. Johns River Basin are being studied to achieve targeted water quality goals. Data are being compiled on past and present rates of sediment and nutrient accumulation in lakes of the Upper Basin as part of this effort. In 1995, we used paleolimnological methods to examine spatial and temporal patterns of organic sediment and nutrient accumulation in Lakes Hell ‘n’ Blazes, Sawgrass and Washington. We measured sediment thickness at selected sites in each lake to estimate the spatial distribution of soft organic sediment. 210 Pbdated sediment cores were used to evaluate changing bulk sediment and nutrient (total C, total N, total P) accumulation rates during the last century at selected locations in each waterbody. We also estimated longterm, lakewide phosphorus storage in Lakes Hell ‘n’ Blazes and Sawgrass. One goal was to determine which of the two models proposed by Lowe et al. (1984) best described sedimentation processes in the lakes of the Upper St. Johns River Basin. We also wanted to test whether historical changes in sedimentation and nutrient accumulation in the ecosystem could be temporally correlated with human activities in the Upper Basin.
wet97-13.tex; 6/05/1999; 22:00; p.4
225
Table 1. Core site, core designation, water depth, soft sediment depth, length of retrieved core, and coring locations in Lake Hell ‘n’ Blazes, Sawgrass Lake, and Lake Washington. Site (#)
Core (#)
Lake Hell ‘n’ Blazes 1 25-IX-95-1 2 25-IX-95-2 3 25-IX-95-3 4 25-IX-95-4 5 25-IX-95-5 6 25-IX-95-6 7 25-IX-95-7 8 25-IX-95-8 Sawgrass Lake 1 13-VII-95-1 2 13-VII-95-2 3 13-VII-95-3 4 13-VII-95-4 5 13-VII-95-5 6 13-VII-95-6 7 13-VII-95-7 8 13-VII-95-8 Lake Washington 1 2-XI-95-1 2 2-XI-95-2 3 2-XI-95-3 4 2-XI-95-4 5 3-XI-95-5 6 3-XI-95-6 7 3-XI-95-7 8 3-XI-95-8 9 3-XI-95-9 10 3-XI-95-10 11 3-XI-95-11 12 3-XI-95-12 13 3-XI-95-13 14 3-XI-95-14 15 3-XI-95-15 16 3-XI-95-16 17 30-XI-95-17 18 30-XI-95-18 19 30-XI-95-19 20 30-XI-95-20 21 30-XI-95-21 22 30-XI-95-22 23 30-XI-95-23 24 30-XI-95-24
H2 O Depth (cm)
Soft sediment (cm)
Core length (cm)
Site location (N Latitude) (W Longitude)
240 220 230 240 220 235 230 200
60 75 117 84 85 99 60 > 150
63 70 106 88 65 102 68 **
28◦ 010 26.200 × 80◦ 470 55.900 28◦ 010 34.800 × 80◦ 470 48.900 28◦ 010 13.900 × 80◦ 470 46.600 28◦ 010 13.100 × 80◦ 470 32.200 28◦ 000 59.600 × 80◦ 470 49.600 28◦ 000 57.900 × 80◦ 470 38.500 28◦ 000 47.600 × 80◦ 470 50.100 28◦ 000 49.800 × 80◦ 470 39.200
140 140 144 150 138 157 138 157
92 114 110 122 93 96 64 107
64 64 80 88 69 68 44 84
28◦ 040 3000 × 80◦ 470 1000 28◦ 040 2000 × 80◦ 470 1100 28◦ 040 3400 × 80◦ 460 5200 28◦ 040 2600 × 80◦ 460 4900 28◦ 040 0900 × 80◦ 460 5000 28◦ 040 3900 × 80◦ 460 3100 28◦ 040 2300 × 80◦ 460 30.500 28◦ 040 3500 × 80◦ 460 09.500
322 250 316 310 255 300 300 320 260 310 270 320 300 250 310 300 236 240 260 220 205 220 200 230
101 0 94 28 9 60 0 66 20 35 0 20 0 28 0 0 18 16 24 5 5 5 0 30
51 32 80 34 17 60 ** 60 19 12 ** 24 ** 20 17 ** 29 10 21 15 16 18 10 40
28◦ 090 01.600 × 80◦ 440 26.600 28◦ 090 16.300 × 80◦ 450 01.600 28◦ 090 45.000 × 80◦ 440 29.800 28◦ 100 00.600 × 80◦ 450 04.400 28◦ 100 01.800 × 80◦ 450 32.800 28◦ 100 04.600 × 80◦ 440 30.800 28◦ 090 39.000 × 80◦ 450 00.500 28◦ 090 26.200 × 80◦ 440 28.800 28◦ 090 14.900 × 80◦ 440 07.200 28◦ 090 00.400 × 80◦ 440 49.200 28◦ 080 37.400 × 80◦ 440 58.900 28◦ 080 40.000 × 80◦ 440 39.300 28◦ 080 38.600 × 80◦ 440 12.500 28◦ 080 20.600 × 80◦ 450 02.500 28◦ 080 22.700 × 80◦ 440 37.600 28◦ 080 20.300 × 80◦ 440 13.400 28◦ 070 56.300 × 80◦ 440 15.100 28◦ 070 47.600 × 80◦ 440 34.400 28◦ 070 48.500 × 80◦ 440 55.800 28◦ 070 25.000 × 80◦ 440 57.600 28◦ 070 26.300 × 80◦ 440 38.600 28◦ 070 29.800 × 80◦ 440 16.900 28◦ 070 12.500 × 80◦ 450 10.300 28◦ 070 09.400 × 80◦ 440 55.200
∗∗ No core retrieved
wet97-13.tex; 6/05/1999; 22:00; p.5
226 Field methods
Laboratory methods
We visited Sawgrass Lake on 13 July, 1995 and Lake Hell ‘n’ Blazes on 25 September, 1995. Sampling sites had to be accessed by airboat because of the Hydrilla infestation. We used an outboard motorboat at Lake Washington because the waterbody was free of vegetation when sampled on 2 and 3 November, 1995, and again on 30 November, 1995. We visited eight sites in Lake Hell ‘n’ Blazes (Figure 2a) and Sawgrass Lake (Figure 2b), and 24 sites in Lake Washington (Figure 2c) to measure water depth and soft sediment thickness. Sites were located at widely spaced intervals in the limnetic zone to evaluate spatial distribution of sediments within lakes. We measured water depth at each site by lowering a Secchi disk on a metered rope to the sediment surface. Next, we forced metal coring rods through the organic deposits until they were met with resistance by the underlying inorganic sands or clays. Distance from the water surface to hard bottom was measured and soft sediment thickness was estimated by subtracting the water depth from the total depth from the water surface to the hard bottom. At each site in Sawgrass Lake, seven of eight sites in Lake Hell ‘n’ Blazes, and 20 of 24 sites in Lake Washington, a sediment/water interface core was retrieved using a piston corer with a 7.6-cm diameter, clear polycarbonate core barrel (Fisher et al., 1992). Site 8 in Lake Hell ‘n’ Blazes was near an island and possessed > 150 cm of soft sediment. The site was not cored because sediment accumulation was not representative of the greater limnetic zone and it appeared that much of the organic debris came from, or was trapped by the island. Sites 7, 11, 13, and 16 in Lake Washington lacked soft sediment. Surficial sand deposits at the sites were not retrieved. Core designations reflect the lake name, date (day-month-year), and site number. Latitude and longitude at coring sites were determined with a Global Positioning System (GPS). Coring location, water depth, soft sediment thickness, and core length were recorded at each station (Table 1). Following sediment retrieval, core tubes were plugged at the base with an extruder piston. Cores were extruded in a vertical position by pushing upward on the piston. Profiles were sectioned at 4-cm intervals and soft sediment was collected in a sampling tray fitted to the top of the core barrel. Sediment from each interval was transferred to labeled Whirl-PakTM bags for transport to the laboratory.
Wet mass of samples was determined by weighing bagged samples to the nearest 0.01 g on a Fisher ScientificTM S-400 digital balance, and subtracting the tare weight of Whirl-PakTM bags. Next, samples were dried at 60 ◦ C in a Grieve CorporationTM Model SC-350 industrial drying oven. Dry sample mass was computed by re-weighing bagged samples and subtracting the tare weight. Dried sediments were ground with a mortar and pestle and stored in 20-ml plastic scintillation vials. Organic matter (OM) content in sediments was estimated by weight loss on ignition (LOI) at 550 ◦ C (Håkanson and Jansson, 1983) in a Sybron ThermolyneTM muffle furnace. Sediment bulk density (g dry cm−3 wet) was computed from percent dry mass and organic/inorganic proportion using the formula of Binford (1990). Total carbon and total nitrogen were determined using a Carlo-ErbaTM NA 1500 C/N/S analyzer. Total phosphorus was measured using a TechniconTM Autoanalyzer II with a singlechannel colorimeter, following digestion with H2 SO4 and K2 S2 O8 (Schelske et al., 1986). Sediment constituents (OM, C, N, P) are expressed as amount per gram dry mass. We selected two cores from Lake Hell ‘n’ Blazes (25-IX-95-3 and 25-IX-95-7), three cores from Sawgrass Lake (13-VII-95-3, 13-VII-95-4, and 13-VII-958), and four cores from Lake Washington (2-XI-95-1, 2-XI-95-3, 3-XI-95-6, and 3-XI-95-8) for 210 Pb dating. We targeted longer cores to avoid measuring isotopic activities in truncated profiles, i.e., cores representing < 150 year of sediment accumulation (see Whitmore et al., 1996). Tared plastic SarstedtTM tubes were filled with dry sediment to a height of ∼ 30 mm to standardize sample geometry. Sample mass was determined and tubes were sealed with epoxy glue and permitted to set for at least 2–3 weeks to allow 214 Bi to equilibrate with in situ 226 Ra. Isotopic activities in samples were measured by direct gamma counting (Appleby et al., 1986; Schelske et al., 1994), using ORTECTM Intrinsic Germanium Detectors connected to a 4096 channel, multichannel analyzer. Total 210 Pb activity was obtained from the photopeak at 46.5 keV. Supported 210 Pb activity, i.e., 226 Ra activity, was estimated from the 214Bi peak at 609.3 keV. 137 Cs activity was determined from the 662 keV photopeak. 137 Cs was counted in the hope of identifying the ca. 1960 atmospheric fallout maximum from bomb testing (Krishnaswami and Lal, 1978). Isotopic activities are
wet97-13.tex; 6/05/1999; 22:00; p.6
227
Figure 3. Density, organic matter (LOI), total carbon, total nitrogen, and total phosphorus concentrations versus depth in Lake Hell ‘n’ Blazes cores 25-IX-95-3 and 25-IX-95-7. Number to right of the total P plot is the 210 Pb date at the designated depth.
expressed as decays per minute per gram dry sediment (dpm g−1 ). In Florida, supported 210 Pb activities can be high and variable over the lengths of cores (Brenner et al., 1994, 1995, 1996, 1997; Schelske et al., 1994). We therefore did not use the downcore, asymptotic total 210Pb activity to estimate supported 210 Pb activity. Instead, we measured supported 210 Pb activities (i.e., 226 Ra) in each sample and subtracted the values from total 210 Pb activities on a level-by-level basis. 226 Ra activities in the Upper St. Johns River lake sediments were low, typically < 3 dpm g−1 , but some values ranged between 3 and 6 dpm g−1 , requiring the level-by-level approach. Age/depth relations in the cores and bulk sediment accumulation rates were calculated using the c.r.s. (constant rate of supply) model, the appropriate model when changes in sediment accumulation rate are suspected (Appleby and Oldfield, 1983; Oldfield and Appleby, 1985; Binford and Brenner, 1986). Dates in cores correspond to the base of each 4-cm sample, and ages are expressed relative to the core collection date. Counting errors were estimated by first-order
approximation, assuming that gamma disintegrations are described by a Poisson distribution (Knoll, 1989). Age errors, expressed as one standard deviation about the age, incorporate error associated with total 210 Pb and 226Ra counts, background counts, and detector efficiency (Schelske et al., 1994). Accumulation rates (mg cm−2 yr−1 ) of sediment constituents OM, C, N, and P were computed for each stratigraphic interval by multiplying the bulk sediment accumulation rate (g cm−2 yr−1 ) times the concentration (mg g−1 ) of each constituent in the bulk sediment. 210 Pb dating models can generate sediment ages > 100 years old, but such old dates have large error terms associated with them. Errors arise from two sources. First, old samples have low activities and counting errors can be large, even after long count times. Second, the c.r.s. dating model systematically yields ‘too-old’ dates for the oldest sections of cores (Binford, 1990). Although dates prior to the turn of the 20th century are reported, only dates since 1900 are considered reliable, and discussion of accumulation rates and trends is restricted to the last ∼ 100 years.
wet97-13.tex; 6/05/1999; 22:00; p.7
228
Figure 4. Density, organic matter (LOI), total carbon, total nitrogen, and total phosphorus concentrations versus depth in Sawgrass Lake cores 13-VII-95-3, 13-VII-95-4, and 13-VII-95-8. Number to right of the total P plot is the 210 Pb date at the designated depth.
Results Water depth and soft sediment distribution Water depth in the limnetic zone of Lake Hell ‘n’ Blazes ranged from 200 to 240 cm (Table 1). Measured soft sediment accumulation at seven of eight sites was between 60 and 117 cm thick (Table 1). Retrieved profiles ranged from 63 to 106 cm long. Core lengths were similar to measured soft sediment thickness at each site, indicating that the complete soft sediment lens had been recovered. In most cases, the coring drive was stopped by underlying, impenetrable sands and clays. In Sawgrass Lake, water depth at the eight limnetic stations ranged from 138 to 157 cm (Table 1). Soft sediment thickness ranged from 64 to 122 cm.
Retrieved cores were between 44 and 88 cm long. In some cases, sediment piercing overestimated the thickness of organic sediments, probably because the metal rods penetrated underlying inorganic clays. At site 2, for example, soft sediment thickness was estimated to be 114 cm, but the core from site 2 was only 64 cm long, and had gray clay deposits at the base. Water depth at the 24 limnetic stations in Lake Washington varied from 200 cm to 322 cm (Table 1). Soft sediment distribution in Lake Washington was highly irregular. Seven stations had sand bottoms with no overlying organic deposits. Elsewhere, soft sediment accumulation was between 5 and 101 cm thick. At several sites with sand bottoms, intact cores were not obtained because sandy sediments fell out of the core barrel on retrieval. In some cases, it was possible
wet97-13.tex; 6/05/1999; 22:00; p.8
229
Figure 5. Density, organic matter (LOI), total carbon, total nitrogen, and total phosphorus concentrations versus depth in Lake Washington cores 2-XI-95-1, 2-XI-95-3, 3-XI-95-6, and 3-XI-95-8. Number to right of the total P plot is the 210 Pb date at the designated depth.
wet97-13.tex; 6/05/1999; 22:00; p.9
230
Figure 6. Isotope activities versus depth in Lake Hell ‘n’ Blazes cores 25-IX-95-3 and 25-IX-95-7. Accumulation rates of bulk sediment, organic matter, total carbon, total nitrogen, and total phosphorus versus date for Lake Hell ‘n’ Blazes cores 25-IX-95-3 and 25-IX-95-7.
wet97-13.tex; 6/05/1999; 22:00; p.10
231
Figure 7. Isotope activities versus depth in Sawgrass Lake cores 13-VII-95-3, 13-VII-95-4, and 13-VII-95-8. Accumulation rates of bulk sediment, organic matter, total carbon, total nitrogen, and total phosphorus versus date for Sawgrass Lake cores 13-VII-95-3, 13-VII-95-4, and 13-VII-95-8.
wet97-13.tex; 6/05/1999; 22:00; p.11
232 to penetrate the sands and plug the core barrel with deeper clay deposits. Physical and chemical properties of cores The two 210 Pb-dated cores from Lake Hell ‘n’ Blazes (25-IX-95-3 and 25-IX-95-7) display similar stratigraphic trends with respect to all variables (Figure 3). Organic sediments with low bulk density are underlain by high-density inorganic deposits near the base of each section. Uppermost organic sediments at sites 3 and 7 contain 585 and 688 mg g−1 OM, respectively. There is an abrupt shift in sediment type near the bottom of each section, and basal samples from sites 3 and 7 contain 361 and 63 mg g−1 OM, respectively. The balance of the sediment matrix is composed of inorganic sands and clays. Total carbon and total nitrogen concentrations track stratigraphic shifts in OM content, suggesting that C and N are bound primarily in the organic sediment fraction. Maximum total phosphorus concentrations were measured in samples at or near the tops of the cores, and total P concentrations display gradual declines with increasing depth in the profiles (Figure 3). The three 210 Pb-dated Sawgrass Lake cores (13-VII-95-3, 13-VII-95-4, 13-VII-95-8) possessed ∼ 60 cm of organic sediment that overlies inorganicrich deposits (Figure 4). Topmost, organic sediments have low bulk density that increases with depth in the profiles. Basal, inorganic deposits have high bulk density. Uppermost deposits in cores from sites 3, 4, and 8 are highly organic, containing 706, 732, and 777 mg g−1 OM, respectively. Basal deposits from the three profiles contain 71, 349, and 67 mg g−1 OM. Stratigraphic shifts in total C and total N concentration track OM content in the Sawgrass Lake cores (Figure 4), implying that sedimented C and N are bound largely in the organic sediment fraction. Total phosphorus concentrations are highest near the top of the Sawgrass profiles and tend to decline with increasing depth in the cores (Figure 4). Soft sediment distribution in Lake Washington was non-uniform, with the thickest deposits found in the northeastern area of the lake (Table 1). In the four cores chosen for 210 Pb dating (2-XI-95-1, 2-XI-95-3, 3-XI-95-6, 3-XI-95-8), OM concentration in surface deposits was similar, ranging from 606 to 631 mg g−1 . At site 1, OM tended to decrease with greater depth in the profile (Figure 5). Cores from sites 3, 6, and 8 display variable OM concentration downcore. Total carbon and nitrogen again track OM content, indicating that C and N are bound in the organic sediment
fraction. Total phosphorus concentration in surface deposits from Lake Washington was similar at all four sites, ranging from 0.627 to 0.669 mg g−1 . At sites 1 and 6, total P concentration tends to decrease with increasing sediment depth (Figure 5). At site 3, total P declines with depth to 52 cm, but P concentrations are higher in the bottom 30 cm of the profile (Figure 5). At site 8, total P concentration declines steadily from the surface to 40 cm (Figure 5). Total P concentration is maximal at 40–44 cm (2.257 mg g−1 ) and lowest in the sample from 52–56 cm (0.140 mg g−1 ). Other sites in Lake Washington lacked OM accumulation or possessed a thin layer of OM overlying inorganic sands or clays. In the latter case, near-surface sediments with fairly high OM, carbon, nitrogen, and phosphorus content were underlain at shallow depth by inorganic sands and clays. Sites with sandy surface deposits had high bulk density, but low OM and nutrient concentrations. Radioisotopes and sediment chronology Supported 210 Pb was reached at 76 cm in Hell ‘n’ Blazes core 25-IX-95-3 and at 56 cm in core 25-IX95-7 (Figure 6). Radium-226 activity was < 1.82 dpm g−1 in the core from site 3 and < 2.48 dpm g−1 in the core from site 7. Integrated unsupported 210 Pb activity was 40.0 dpm cm−2 at site 3 and 25.1 dpm cm−2 at site 7, which is equivalent to 210 Pb fallout rates of 1.25 and 0.78 dpm cm−2 yr−1 , respectively. Cesium137 did not display a distinct activity peak in either Hell ‘n’ Blazes profile. Abrupt increases in 137Cs activity, however, were recorded at 32 cm in the profile from site 3, and at 36 cm in the profile from site 7. Some 137 Cs activity was measured in the deepest levels of the 210 Pb-datable section of both cores. This is typical in Florida lakes, where the radionuclide is often found in sediments that predate 137 Cs injection into the atmosphere (Brenner et al., 1994; Schelske et al., 1994). Downward transport of highly soluble 137 Cs in Florida lake sediments may occur because cesium is not particle-reactive like 210 Pb. Furthermore, Florida lake sediments typically lack 2:1 lattice clays that might serve as binding sites. In Sawgrass Lake, supported 210 Pb levels were reached at 60 cm in the core from site 3, 56 cm in the core from site 4, and 48 cm in the core from site 8 (Figure 7). Radium-226 activities were generally < 2.0 dpm g−1 , but highest in surface (0–4 cm) deposits from site 4 (2.85 dpm g−1 ). 137 Cs activities were low in Sawgrass sediments (< 2.0 dpm g−1 ). In-
wet97-13.tex; 6/05/1999; 22:00; p.12
233 tegrated unsupported 210 Pb values at sites 3, 4, and 8 were 17.5, 21.7, and 19.7 dpm cm−2 , respectively. Calculated excess 210 Pb deposition rates at the three locations were 0.54, 0.68, and 0.61 dpm cm−2 yr−1 . In the cores from Lake Washington, supported 210 Pb activity was reached at 52 cm at site 1, 40 cm at site 3, 40 cm at site 6, and 44 cm at site 8 (Figure 8). Compared with sediment profiles from Lakes Hell ‘n’ Blazes and Sawgrass, Lake Washington sediments displayed higher and more variable 226 Ra activities. All cores from Lake Washington had stratigraphic levels with > 3 dpm g−1 226 Ra. Maximum 226 Ra activity was recorded at 48–52 cm in core 2-XI-953 (5.64 dpm g−1 ), below the supported/unsupported 210 Pb boundary. Integrated unsupported 210 Pb activity at the four Lake Washington sites was variable: 79.6 dpm cm−2 (site 1), 43.1 dpm cm−2 (site 3), 50.0 dpm cm−2 (site 6), and 53.5 dpm cm−2 (site 8), reflecting site-specific 210 Pb deposition rates of 2.48, 1.34, 1.56, and 1.67 dpm cm−2 yr−1 , respectively. Cores from Lake Washington failed to display a discrete 137Cs peak, but in all cases topmost sediments displayed higher 137 Cs activities than did basal deposits. Maximum 137Cs activities exceeded 5 dpm g−1 in all cores, with minimum values at or near zero in the lowest levels. Material accumulation rates At site 3 in Lake Hell ‘n’ Blazes, bulk sediment accumulation accelerated after the turn of the century (Figure 6). Highest rates of sediment accumulation occurred in the 1940s and 1950s and in the decade between 1984 and 1994. Accumulation rate trends for OM, C, and N are similar to trends for bulk sediment. Four-to-five-fold changes in the magnitude of bulk sediment accumulation exceed the < 2-fold shifts in constituent concentrations. Temporal changes in OM, C, and N accumulations are thus driven principally by changes in bulk sedimentation. Phosphorus is an exception, and displays generally increasing rates of accumulation with the passage of time (Figure 6), driven by both shifting bulk sedimentation rates and changing P content of the sediment. At site 7 in Lake Hell ‘n’ Blazes, bulk sediment accumulation also increased after the turn of the century (Figure 6). Maximum sediment accumulation occurred in the late 1940s, apparently associated with a brief event. High OM, C, N, and P accumulation occurred at the same time. Accumulation rates of bulk sediment, OM, C, and N dropped after ∼ 1950 and
remained rather stable since then. Phosphorus accumulation rates increased since ∼ 1950, and recent rates of P accumulation are comparable to the high value recorded for the late 1940s. At site 3 in Sawgrass Lake, bulk sediment accumulation varied appreciably through time (Figure 7). Following a brief period of high sediment accumulation around 1910, sedimentation rates declined, but climbed steadily to a maximum in the late 1940s. The late 1940s period of high sediment accumulation is contemporaneous with the period of rapid sediment accumulation in Lake Hell ‘n’ Blazes. By the early 1950s, bulk sediment and constituent accumulation rates fell to low values that have prevailed to the present time. Phosphorus is distinguished from the other nutrients in displaying relatively high accumulation rates during the last decade. At site 4 in Sawgrass Lake, bulk sediment accumulation increased slowly and steadily after the turn of the century, displaying a brief period of relatively high accumulation in the 1920s (Figure 7). Modern rates of bulk sediment, OM, C, and N accumulation are about three times higher than those recorded for the period around 1900. The contemporary phosphorus accumulation rate is nearly an order of magnitude higher than the rate ∼ 1900. At Sawgrass Lake site 8, bulk sediment accumulation increased slowly since the turn of the century (Figure 7). Similar to the pattern at site 4 in Sawgrass Lake, modern rates of bulk sediment, OM, C, and N accumulation are about 3-fold higher than rates measured for the period around 1900. Likewise, P sequestering on the lake bottom at site 8 has accelerated over time, and recent rates of P burial are about 10-fold higher than rates determined for the early 1900s. At site 1 in Lake Washington, bulk sediment accumulation has proceeded at a relatively rapid pace since the early 1900s (Figure 8). With the exception of very high rates recorded for the period 1911–1920 and again in the 1940s, there has been no discernible temporal trend in bulk sediment accumulation rate. Due to pronounced stratigraphic changes in the concentrations of OM and nutrients in core 1, these sediment constituents display a general trend of increasing accumulation through time. At Lake Washington site 3, bulk sediment accumulated at a rate of 36–38 mg cm−2 yr−1 throughout the first half of the century (Figure 8). Thereafter, bulk sediment deposition increased and was relatively constant (50–55 mg cm−2 yr−1 ) until 1993, after which maximal rates were recorded (104 mg cm−2
wet97-13.tex; 6/05/1999; 22:00; p.13
234
Figure 8a.
wet97-13.tex; 6/05/1999; 22:00; p.14
235
Figure 8b. Isotope activities versus depth in Lake Washington cores 2-XI-95-1, 2-XI-95-3, 3-XI-95-6, and 3-XI-95-8. Accumulation rates of bulk sediment, organic matter, total carbon, total nitrogen, and total phosphorus versus date for Lake Washington cores 2-XI-95-1, 2-XI-95-3, 3-XI-95-6, and 3-XI-95-8.
wet97-13.tex; 6/05/1999; 22:00; p.15
236 Table 2. Mean 20th century accumulation rates for bulk sediment, organic matter (OM), carbon, nitrogen and phosphorus at selected sites in Lake Hell ‘n’ Blazes (HB), Sawgrass Lake (SAW) and Lake Washington (WASH). Time intervals represent the period between the coring date (1995) and a 210 Pb date close to the turn of the century. Linear sedimentation rates are the cm of sediment accumulated since the early 210 Pb date divided by the years in the interval. Mass accumulation rates represent the integrated amount of material accumulated since the early 210 Pb date divided by the years in the interval. Lake
Core
Time
Sediment
Linear
Name
Site (#)
Interval (dates)
Depth (cm)
Sed rate (cm yr−1 )
Bulk
OM C N (mg cm−2 yr−1 )
P
HB HB SAW SAW SAW WASH WASH WASH WASH
3 7 3 4 8 1 3 6 8
1904-1995 1911-1995 1909-1995 1899-1995 1892-1995 1911-1995 1910-1995 1888-1995 1891-1995
60 44 52 44 32 44 32 32 32
0.66 0.52 0.60 0.46 0.31 0.52 0.38 0.30 0.31
47 41 39 32 20 113 48 75 37
35.2 28.5 29.0 20.9 15.3 39.4 24.7 20.2 22.1
0.021 0.014 0.010 0.011 0.009 0.032 0.020 0.020 0.018
yr−1 ). Relative shifts in OM, C, and N accumulation through time are similar to those for bulk sediment accumulation, while P displays a steady increase in accumulation throughout the century. At site 6 in Lake Washington, bulk sediment accumulation displays a gradual increase from ∼ 1888 to the present, with the exception of a period of higher sediment accumulation from 1935–1947 (Figure 8). Since the turn of the century, there has been a general increasing trend for organic matter, C, N, and P accumulation at site 6 in Lake Washington. During the last century bulk sediment accumulation has generally increased at site 8 in Lake Washington, with highest rates of accumulation measured for the period since 1992 (Figure 8). The highest rate of sedimentation occurred between 1947 and 1955. Temporal trends for OM, C, N, and P accumulation rates track bulk sediment accumulation rates. For each 210Pb-dated core, we calculated the mean linear sediment accumulation rate (cm yr−1 ) and mean mass accumulation rate (mg cm−2 yr−1 ) for various sediment constituents, since the turn of the century (Table 2). This permitted comparison of long-term sediment and nutrient sequestering among lakes and among sites within each lake. Within lakes, site-to site linear sediment accumulation varied less than 2-fold. Among all sites, the highest rate of linear sediment accumulation was measured at site 3 in Lake Hell ‘n’ Blazes (0.66 cm yr−1 ) and the lowest rate was recorded at site 6 in Lake Washington (0.30 cm yr −1 ).
Mass sedimentation rate
19.3 15.5 15.3 10.8 7.8 20.8 14.7 10.0 11.7
1.39 1.07 1.14 0.82 0.58 1.44 1.02 0.70 0.80
Within-lake, mass bulk sediment accumulation varied about 3-fold in Lake Washington and < 2-fold in Lakes Hell ‘n’ Blazes and Sawgrass. Among all sites, site 1 in Lake Washington registered the highest mean rate of mass accumulation (113 mg cm−2 yr−1 ) and the lowest rate was measured at site 8 in Sawgrass Lake (20 mg cm−2 yr−1 ). With respect to long-term, mean OM and nutrient accumulation rates, inter-site differences within lakes generally varied < 2-fold. Considering all sites, long-term mean accumulation for all sediment constituents displayed fairly small ranges: OM (15.3–39.4 mg cm−2 yr−1 ), C (7.8–20.8 mg cm−2 yr−1 ), N (0.58–1.44 mg cm−2 yr−1 ), and P (0.009–0.032 mg cm−2 yr−1 ).
Discussion Hell ‘n’ Blazes Cores from sites 3 and 7 in Lake Hell ‘n’ Blazes indicate that on a linear basis, a substantial portion of the organic sediment accumulated at the sites since ∼ 1900. At site 3, a 106-cm core was obtained, 60 cm of which was deposited since 1904. At site 7, the uppermost 44 cm of a 68-cm profile accumulated after 1911. Rates of material accumulation in the late 1940s were high, perhaps a consequence of an event such as a severe storm. They may, however, have been related to human activities in the marsh. Very recent rates of
wet97-13.tex; 6/05/1999; 22:00; p.16
237 mass sediment accumulation are higher than rates for the turn of the century. Relatively high P accumulation rates in the late 1940s were associated with the brief episode of high bulk sedimentation. In general, Lake Hell ‘n’ Blazes has experienced an order-of-magnitude increase in phosphorus accumulation on the lake bottom since ∼ 1900. Generally increasing P sequestering on the lake bottom during the 20th century may reflect increasing nutrient loading of the system. Modern rates of P sequestering at sites 3 and 7 are 0.054 and 0.035 mg cm−2 yr−1 , respectively. Measured soft sediment accumulation in the limnetic zone of Lake Hell ‘n’ Blazes is rather uniform, varying < 2-fold among sites. Uniform deposition is supported by similar integrated unsupported 210Pb accumulation at sites 3 and 7 (40.0 and 25.1 dpm cm−2 , respectively). The cores yield 210 Pb fallout rates of 1.25 and 0.78 dpm cm−2 yr−1 , close to the mean value of 1.01 dpm cm−2 yr−1 derived from a suite of Florida lake cores (Binford and Brenner, 1986). Because sediment distribution is spatially homogeneous in Lake Hell ‘n’ Blazes, we used P accumulation rates from the 210Pb-dated cores to estimate lakewide P accumulation. Mean, 20th century phosphorus accumulation rates at sites 3 and 7 were 0.021 and 0.014 mg cm−2 yr−1 , respectively. Assuming a mean lakewide P accumulation rate of 0.018 mg cm−2 yr−1 , on average 277 kg of P were buried on the bottom of the 154-ha lake each year. Since the turn of the century, 27,000 kg of P were stored in Lake Hell ‘n’ Blazes sediments. Sawgrass Lake Similar to Lake Hell ‘n’ Blazes, sediment distribution in Sawgrass Lake is fairly uniform. Likewise, much of the organic sediment in Sawgrass Lake accumulated during the 20th century. At site 3, the topmost 52 cm of 80 cm accumulated were deposited since 1909. At site 4, 44 of 88 cm were deposited since 1899. At site 8, the topmost 32 cm of the 84 cm retrieved were deposited in the last 104 years. Despite inter-site differences in temporal patterns of deposition in Sawgrass Lake, long-term mean accumulation rates of bulk sediment, OM and nutrients are similar among sites, varying less than 2-fold. Integrated excess 210 Pb accumulations at sites 3, 4, and 8 are also similar (17.5 dpm cm−2 , 21.7 dpm cm−2 , and 19.7 dpm cm−2 , respectively). Computed rates of 210Pb deposition at the three sites (0.54, 0.68, and
0.61 dpm cm−2 yr−1 ) are low relative to the mean of 1.1 dpm cm−2 yr−1 measured in other Florida lakes (Binford and Brenner, 1986), suggesting some sediment and associated 210 Pb is exported from the lake in outflow. Low variance among sites, nevertheless, supports the claim that P accumulation at the three sites is representative of the lake as a whole. Long-term, mean P accumulation rates at sites 3, 4, and 8 are similar (0.010, 0.011, and 0.009 mg cm−2 yr−1 , respectively). Assuming a mean, lakewide P burial rate of 0.010 mg cm−2 yr−1 , P accumulation on the bottom of this 195ha lake averaged 195 kg yr−1 since the turn of the century. Phosphorus storage on the lake bottom has amounted to ∼ 19,500 kg P since ∼ 1900. As in Lake Hell ‘n’ Blazes, recent P accumulation rates in Sawgrass Lake are much higher than rates inferred for the turn of the century. The most recent P accumulation rates recorded at sites 3, 4, and 8 (0.016, 0.037, and 0.036 mg cm−2 yr−1 ) exceed rates for the turn of the century by about an order of magnitude. In Lakes Hell ‘n’ Blazes and Sawgrass, generally increasing P accumulation in sediments through time probably reflects both greater nutrient loading and more efficient nutrient trapping. Higher nutrient loads would be expected to increase primary production and accelerate sediment accumulation. Proliferation of dense, submersed macrophytes also enhances nutrient sequestering. These plants slow water flow (Carpenter and Lodge, 1986), allowing more efficient uptake of dissolved nutrients by primary producers (Canfield et al., 1984). Submersed macrophytes also filter out suspended particles that are ultimately deposited on the lake bottom. They also reduce wind-generated turbulence (Dieter, 1990), thereby preventing sediment from being resuspended and flushed from the system. Lake Washington Organic sediment distribution in Lake Washington is non-uniform, with most deposits confined to the northeastern portion of the basin. Even where organic sediment accumulates, there is some inter-site variability in deposition, as reflected in the integrated excess 210 Pb accumulation at sites 1, 3, 6, and 8 (79.6, 43.1, 50.0, and 53.5 dpm cm−2 , respectively). Calculated excess 210 Pb deposition rates for the sites (2.48, 1.34, 1.56, and 1.67 dpm cm−2 yr−1 ) are high relative to the mean in Florida (1.1 dpm cm−2 yr−1 ), probably reflecting resuspension of organic sediment and its associated 210 Pb at sites throughout the basin, and subsequent focusing to the coring sites. With its large
wet97-13.tex; 6/05/1999; 22:00; p.17
238 area (1766 ha), generally shallow depth (2–3 m), and long fetch (> 6 km), Lake Washington’s non-uniform sediment distribution was not unexpected. Relatively large, shallow Florida lakes often display spatially heterogeneous sediment distribution, which is attributed to wind-induced resuspension and redeposition of unconsolidated organic surface deposits (Whitmore et al., 1996). Organic sediment accumulation is non-uniform throughout Lake Washington. Consequently, phosphorus accumulation rates derived from the 210 Pb-dated cores do not reflect lake-wide P burial rates. They are site specific, reflecting only the accumulation of P at locations where organic deposits have built up, allowing core retrieval and dating. Phosphorus accumulation rates derived from the cores overestimate lakewide P deposition. Long-term P sequestering rates measured at the four sites in Lake Washington (0.018, 0.020, 0.020, and 0.032 mg P cm−2 yr−1 ) are higher than values recorded at the three Sawgrass sites (0.009, 0.010, and 0.011 mg P cm−2 yr−1 ) and comparable, or slightly higher than rates measured in Lake Hell ‘n’ Blazes (0.014 and 0.021 mg P cm−2 yr−1 ) (Table 2). Inter-lake differences probably reflect sediment focusing in Lake Washington, that biases P accumulations on the high side. Because soft sediment accumulation is spatially heterogeneous in Lake Washington, we did not calculate lakewide, 20th century P storage. Although rates of P accumulation derived from the four cores cannot be generalized to the lake as a whole, they nevertheless illustrate site-specific, temporal changes in P burial. Phosphorus accumulation at all four sites has accelerated since the turn of the century. Modern rates of P accumulation are three (site 1) to ten (site 8) times higher than rates inferred for the turn of the century. Our data are consistent with sedimentation Model 2 of Lowe et al. (1984), that proposed slow, permanent accumulation of organic sediments and associated nutrients in small upstream Lakes Hell ‘n’ Blazes and Sawgrass. Organic sediment accrual began in these lakes before the turn of the century, and with the exceptions of Hell ‘n’ Blazes site 7 and Sawgrass site 3, sites displayed generally increasing nutrient accumulation since ∼ 1900. Also consistent with the predictions of Model 2, we found that organic sediment accumulation in large, downstream Lake Washington was limited to a small fraction of the basin area. Where sediments were permanently deposited in Lake Washington, they had accumulated at relatively high rates.
Paleolimnological techniques were used successfully to assess the spatial distribution of soft, organic sediment in Lakes Hell ‘n’ Blazes, Sawgrass and Washington. Spatial differences in total sediment accumulation among the lakes are largely a consequence of basin morphometry and macrophyte invasion. Upstream Lakes Hell ‘n’ Blazes and Sawgrass are small. Their maximum fetches (∼ 2 km) are considerably less than the maximum fetch on Lake Washington (> 6 km). Consequently, organic sediments buried on the bottom of the smaller lakes are not as prone to wind-driven resuspension and transport from the basin. Both hyacinths and Hydrilla have invaded Lakes Hell ‘n’ Blazes and Sawgrass, enhancing sediment and nutrient sequestering on the lake bottoms. The plants utilize dissolved nutrients in the water column and trap suspended solids, thereby accelerating organic matter deposition. They also inhibit windgenerated turbulence in the water column, guaranteeing that sediments are not resuspended, but remain in place. Lake Washington, with its long fetch, shallow depth and relatively macrophyte-free water column is subject to sediment resuspension and transport, accounting for its heterogeneous distribution of organic deposits. If submersed plants do not proliferate in the waterbody, most of the lake bottom should remain free of organic sediments in the future. 210 Pb-dated cores from the waterbodies enabled us to estimate baseline (i.e., pre-disturbance) rates of bulk sediment and nutrient accumulation on the lake bottoms, and evaluate historical changes in accumulation rates. Temporal shifts in organic sediment and nutrient accumulation in lakes of the Upper St. Johns River Basin are probably attributable to a suite of human-induced watershed modifications. Although organic sediment accumulation commenced prior to the turn of the century in all three lakes, most of the cores indicate that sediment and nutrient accumulation accelerated after 1900. Enhancement of organic deposition and nutrient burial is temporally correlated with land use intensification in the basin. Rapid population growth since 1900 probably increased watershed eutrophication via delivery of nutrient-rich waters from urban stormwater runoff and rural septic tanks. Furthermore, ranching, citrus production and row crop agriculture in reclaimed wetlands were likely sources of nutrient-rich runoff. Wetland drainage was also a factor contributing to accelerated sediment and nutrient accumulation in the lakes. Both wetland loss and water diversion projects have lowered flow rates in the St. Johns River channel,
wet97-13.tex; 6/05/1999; 22:00; p.18
239 thereby reducing the river’s capacity to flush accumulating organic deposits from the upstream waterbodies. Although canal construction diverted some water flow, it also permitted rapid delivery to the lakes of sediment-laden runoff that previously filtered slowly through the surrounding marsh. Weir installation, particularly in Lake Washington, prevented outflow from the lake during low-stage periods, prolonging hydraulic and nutrient retention times, and permitting accumulation of organic deposits at the lake’s north end. This study demonstrates the utility of paleolimnological techniques for inferring past rates of sediment and nutrient sequestering in wetland ecosystems, especially in cases where historical data are unavailable. The historical perspective provided by the ‘paleo’ approach can provide insights into pre-disturbance conditions in the ecosystem, help assess the magnitude of change that has occurred as a consequence of human activities, and assist in setting target conditions when wetland restoration projects are contemplated.
Acknowledgments This work was funded by the St. Johns River Water Management District. Conclusions and interpretations are not necessarily those of the supporting agency. We thank B. Gu, A. Chapman, and J. Kahne for assistance with field sampling. W. Kenney and J. Curtis helped with chemical analysis of sediments. J. Kahne and J. Cable assisted with 210 Pb dating. Comments by two anonymous reviewers were most helpful in revising of the manuscript. This is Journal Series No. R-05823 of the Florida Agricultural Experiment Station.
References Aldridge, F.J., Chapman, A.D., Schelske, C.L. and Brody, R.W. 1998. Interaction of light, nutrients and phytoplankton in a blackwater river, St. Johns River, Florida, U.S.A. Verh. Internat. Verein. Limnol. 26: 1665–1669. Appleby, P.G. and Oldfield, F. 1983. The assessment of 210 Pb data from sites with varying sediment accumulation rates. Hydrobiologia 103: 29–35. Appleby, P.G., Nolan, P.J., Gifford, D.W., Godfrey, M.J., Oldfield, F., Anderson, N.J. and Battarbee, R.W. 1986. 210 Pb dating by low background gamma counting. Hydrobiologia 143: 21–27. Belanger, T.V., Van Vonderen, S.D. and Carberry, T.J. 1983. Analysis of selected water quality factors in the St. Johns River Basin. Report to the St. Johns River Water Management District, Palatka, FL. 114 pp.
Binford, M.W. 1990. Calculation and uncertainty analysis of 210 Pb dates for PIRLA project lake sediment cores. J. Paleolimnology 3: 253–267. Binford, M.W. and Brenner, M. 1986. Dilution of 210 Pb by organic sedimentation in lakes of different trophic states, and application to studies of sediment-water interactions. Limnol. Oceanogr. 31: 584–595. Brenner, M., Peplow, A.J. and Schelske, C.L. 1994. Disequilibrium between 226 Ra and supported 210 Pb in a sediment core from a shallow Florida lake. Limnol. Oceanogr. 39: 1222–1227. Brenner, M., Whitmore, T.J., Curtis, J.H. and Schelske, C.L. 1995. Historical ecology of a hypereutrophic Florida lake. Lake Reservoir Managmt. 11: 255–271. Brenner, M., Whitmore, T.J. and Schelske, C.L. 1996. Paleolimnological evaluation of historical trophic state conditions in hypereutrophic Lake Thonotosassa, Florida, USA. Hydrobiologia 331: 143–152. Brenner, M., Schelske, C.L. and Whitmore, T.J. 1997. Radium-226 stratigraphy in Florida lake sediments as an indicator of human disturbance. Verh. Internat. Verein. Limnol. 26: 809–813. Campbell, D., Munch, D.A., Johnson, R., Parker, M.P., Rao, D.V., Marella, R. and Albanesi, E. 1984. St. Johns River Water Managemnt District. In: Fernald, E.A. and Patton, D.J. (eds), Water Resources Atlas of Florida. pp. 158–177. Florida State University Press, Tallahassee, FL. Canfield, D.E. Jr., Shireman, J.V., Colle, D.E., Haller, W.T., Watkins, C.E. II and Maceina, M.J. 1984. Prediction of chlorophyll a concentrations in Florida lakes: importance of aquatic macrophytes. Can. J. Fish. Aquat. Sci. 41: 497–501. Carpenter, S.R. and Lodge, D.M. 1986. Effects of submersed macrophytes on ecosystem processes. Aquatic Bot. 26: 341–370. Cox, D.T., Moody, H.L., Vosatka, E.D. and Hartzog, L. 1976. D-J F-25 Stream investigations completion report. Florida Game and Fresh Water Fish Commission, Tallahassee, FL. 848 pp. Dieter, C.D. 1990. The importance of emergent vegetation in reducing sediment resuspension in wetlands. J. Freshwater Ecol. 5: 467–473. Fisher, M.M., Brenner, M. and Reddy, K.R. 1992. A simple, inexpensive piston corer for collecting undisturbed sediment/water interface profiles. J. Paleolimnology 7: 157–161. Florida Statistics 1995. University of Florida. Bureau of Economic and Business Research. (abstract). Håkanson, L. and Jansson, M. 1983. Principles of lake sedimentology. Springer-Verlag, NY. 316 pp. Hall, G.B. 1987. Establishment of minimum surface requirements for the greater Lake Washington basin. St. Johns River Water Management District Technical Publication SJ 87-3, Palatka, FL. 74 pp. Knoll, G.E. 1989. Radiation detection and measurement. 2nd Edn. J. Wiley & Sons, New York. 762 pp. Krishnaswami, S. and Lal, D. 1978. Radionuclide limnochronology. pp. 153–177. In: Lerman, A. (ed.), Lakes: Chemistry, Geology, Physics. Springer-Verlag, New York. Lowe, E.F., Brooks, J.E., Fall, C.J., Gerry, L.R. and Hall, G.B. 1984. Technical Publication SJ 84-15. U.S. EPA Clean Lakes Program, Phase I. Diagnostic-feasibility study of the Upper St. Johns River chain of lakes. Volume I – diagnostic study. Department of Water Resources, St. Johns River Water Management District, Palatka, FL. 118 pp. Oldfield, F. and Appleby, P.G. 1985. Empirical testing of 210 Pbdating models for lake sediments. In: Haworth, E.Y. and Lund, J.W.G. (eds), Lake Sediments and Environmental History. pp. 93–124. U. Minnesota Press, Minneapolis.
wet97-13.tex; 6/05/1999; 22:00; p.19
240 Schelske, C.L., Conley, D.J., Stoermer, E.F., Newberry, T.L. and Campbell, C.D. 1986. Biogenic silica and phosphorus accumulation in sediments as indices of eutrophication in the Laurentian Great Lakes. Hydrobiologia 143: 79–86. Schelske, C.L., Peplow, A., Brenner, M. and Spencer, C.N. 1994. Low-background gamma counting: applications for 210 Pb dating of sediments. J. Paleolimnology 10: 115–128. Sincock, J.L. 1958. Waterfowl ecology in the St. Johns River Valley as related to proposed conservation areas and changes in the hydrology from Lake Harney to Ft. Pierec, Florida. Florida Game and Fresh Water Fish Commission Pittman-Robertson Project Report W-19-R, Tallahassee, FL. 89 pp.
St. Johns River Water Management District. 1980. Upper St. Johns River basin surface water management plan, volume 2. St. Johns River Water Management District, Palatka, FL. 500 pp. Tai, C.C. and Rao, D.V. 1982. Hydrologic change due to floodplain impoundment and encroachment by agricultural activities. In: Kruse, E.G., Burdick, C.R. and Yousef, Y.A. (eds), Environmentally Sound Water and Soil Management. pp. 193–200. American Society of Civil Engineers, New York, NY. Whitmore, T.J., Brenner, M. and Schelske, C.L. 1996. Highly variable sediment distribution: a case for sediment mapping surveys in paleolimnological studies. J. Paleolimnology 15: 207–221.
wet97-13.tex; 6/05/1999; 22:00; p.20