Chemometrics Pattern Recognition and Calibration Techniques Applied to. Volatile Components and Sensory Quality of Kenyan Black Teas. Tets u o AISHIMA,1 ...
Food Sct Technol., Int., I (1), 38-43, 1995
Chemometrics Pattern Recognition and Calibration Techniques Applied to Volatile Components and Sensory Quality of Kenyan Black Teas Tets u o
AISHIMA,1 Natsumi TOGAR12 and Phllip O. OwUOR3
1 Research & Development Division of Kikkoman Corporation, 399 Noda, 80 Taromaru, Glfu, Glfu 50]-25, Japan 3 Tea Research Foundation of Kenya, PO Box 820, Kericho, Kenya
Noda, Chiba 278, Japan
2 Glfu Women 's University,
Received April 21,
l 995
Multivariate analysis was applied to 35 volatile components and sensory scores of 16 Kenyan black teas made of tea leaves of two clones cultivated at eight areas. Although profiles of volatile components in black teas belonging
to a clone deviated according to their harvesting areas, cluster analysis and factor score plots clearly showed differences in the two clones. Multivariate calibration methods provided equations predicting sensory scores using
volatile components. Multiple linear regression analysis (MLR) selected 1-penten-3-01, (E,E)-2,4heptadienal and linalool oxide as effective components and the resulting multiple correlation coefficient (R) was 0.914. The optimum
number of principal cornponents indicated by cross-validation was three in the partial least squares (PLS) regression analysis with an R value of 0.946. A higher correlation of components eluted after linalool, i.e., c!-cedrene, 3,7-dimethyl-1;5,7-0ctatrien-3-01, cedrol and bovolide, to tea quality was suggested by factor loadings of
PLS. Principal component regression (PCR) with four principal components showed the lowest R (0.811) among the three calibration methods.
Keywords: black tea, aroma, chemometrics, pattern recognition, PLS
Although nearly 500 compounds have been identified in tea volatiles (Yamanishi, 1981; Flament, 1989), research on
assessing contributions of individual components to tea aromas was only recently systematically performed (Togari et ~l., 1995a). Several indices have been proposed to objectively express the aroma quality of black teas based on quantitative
gas chromatographic (GC) data of volatile components (Wickremansinghe et a/., 1973; Yamanishi et a/., 1978; Owuor et a/., 1988, Owuor, 1992; Mahanta et a/., 1988). Most research has attempted to correlate the ratios of unsaturated aliphatlc compounds eluted before linalool to linalool and/
food components to sensory evaluation since the late 60's. However, two multivariate calibration techniques such as principal component regression (PCR) analysis and partial least squares (PLS) regression analysis are becoming popular in order to overcome the disadvantages of MLR. Concerning tea research, MLR was used to relate water soluble components to the sensory quality of green tea tastes (Nakagawa et a/., 1981). Recently, artificial neural networks (ANN) suc-
ceeded in predicting black tea quality based on an HPLC data set (Tomlins & Gay, 1994). Multivariate statistical
searchers. Of course, all papers have shown the predictability
analysis was also applied to the near infrared reflectance (NIR) spectra of tea leaves for discriminating black tea quallties (Osborne & Fearn, 1988) and geographic origins (Grant et a/., 1988). Concerning the appllcations of chemometrics techniques to the volatile components of teas, green
of proposed models for their sample teas but most of them
tea, Oolong tea and black tea were clearly differentiated based
failed to show the fully acceptable reasons for the selection of
on their volatile components using chemometrics pattern
such key components. The dimculty is understandable when
recognition techniques (Togari et a/., 1995b). Further, highly
picking a few key components from the large number of
predictive equations for their sensory properties were calcu-
volatile components that appeared in capillary GC profiles by simply comparing their peak areas or heights. Recently, Guth and Grosch (1993) found that (Z)-3-hexenal, Iinalool and (Z)-octa-1,5-dien-3-0ne were highly potent aroma compounds in black tea using the aroma extract dllution methods
lated by both MLR and PLS regression but not PCR (Togari
or terpene alcohols eluted after linalool with sensory scores.
However, such key volatile components seemed to be intuitively selected or merely based on the experiences of re-
(AEDA). Many methodologies in chemometrics have been used to extract useful infoamation on samples or systems from complicated data matrices obtained from instrumental analysis such as capillary GC or various spectrometries (Aishima & Nakai, 1991). Multiple linear regression analysls (MLR) has been frequently applied to relate instrumental data of
et a/., 1995a).
In this research, multivariate pattern recognltion techniques were applied to the GC data of aroma components in black teas made of tea leaves from two clones cultivated at geographically different areas in Kenya. MLR, PCR and PLS regression analyses were applied to the GC data in order to establish predictive equations for sensory scores and to determine components contributing to tea quality.
Experimental Sam pl es
Black teas were made from the leaves ofclone
Chemometrics Analysis of Black Tea Aroma
39
5 4.
o3
~::
S C:f
S Cli 2 !-
CU (1)
~1 S16 S13
l •. ~J~ S7 Sample num
lll~: b~~z. S4 ~ = coco Lr) Peak number ~) S1 co Lo
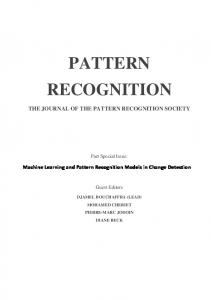
Fig. 1. Gas chromatographic (GC) patterns ofaroma components in black teas SI-16 correspond to KR6/8,T16/8. S16/8, KN6/8, KG6/8, CH6/8, K16/8, S061
8. KRTN, TITN, SITN. KNTN, KGTN, CHTN. KITN and SOTN. Peaks 1-35 refer to Table 2.
6/8 and TN 14-3 cultivated at eight different areas in Kenya
and then the factor axes were rotated using the varimax
such as Karirana, Timbell, Sitoi, Kangaita, Kagochi, Changoi, Kaimosi and Sotik (Owuor, 1992). All tea samples were manufactured by a miniature 'crush, tear and curl' (CTC) method (Owuor et a/., 1989). The 16 samples thus obtained
algorithm. Multivariate calibration Basic models of three multivariate analyses are shown below. When a sensory score and standardized GC peak areas of the ith sample are expressed by yi and xik, the MLR model is expressed by Eq. (1).
were abbreviated as follows; Karirana: KR6/8 and KRTN, Timbell: T16/8 and TITN, Sitoi: S16/8 and SITN, Kangaita:
KN6/8 and KNTN, Kagochi: KG6/8 and KGTN. Changoi: CH6/8 and CHTN, Kaimosi: K16/8 and KITN, and Sotik: S06/8 and SOTN. GC and sensory data All methodologies regarding
y b +blx,1+b2xi2+' ' '+' ' '+b~x,m+e (1) In Eq. ( l), regression coefficients (bi), the residual (ei) and
constant (bo) are calculated using the ordinary least squares method. In this research, stepwise MLR was used by setting F values as 3.84 and 2.9 for selecting and removing the criteria
sampling, GC analysis and sensory evaluation were described in a prevlous report (Owuor, 1992). The amounts of volatile components were expressed as the ratios of GC peak areas to
of variables, respectively.
those of standard peaks. The quantitative GC data set
In Eq. (2), tiq is the qth score related to the ith sample.
PCR and PLS models are expressed by Eq. 2. yi=b0+bl til + b2 ti2+' ' '+' + bqt,q+e (2)
composed of 35 volatile components in 16 black tea samples
Usually, q is much smaller than m. The pth score can be
(Fig. l) and their sensory scores were used.
expressed as a linear combination ofthe original m peaks in the ith black tea sample (Eq. (3)).
Pattern recognition Factor analysis (FA) and cluster analysis were performed by SPSS for Windows ver. 6.0 (SPSS, Chicago, IL, USA). Cluster analysis was applied to ratios of
tip= vplxil+vp2xi2+ +v x (3) "' "' pm+ im
In both PCR and PLS, the coefficients of { vpj} are
GC peak areas and thelr Z-scores. The Z-transformation
calculated so as to make (vpl' vp2, ' ' ' vp~) and (v v
standardized means and standard deviations of all variables
v ) orthogonal. However, there is a significant difference ""
to O and I .O, respectively, regardless of absolute magnitude of
original variables. Euclidian distances and cosines of vectors were used to express the similarities among the 1 6 GC profiles.
A cosine of two vectors corresponded to an angle of the two vectors scattered in the 35 dimensional hyperspace, If two vectors are exactly the same pattern then the angle should be
O' (cosine O'=1.0). On the contrary, if two vectors do not
' ~1' n2, ' ' ' ,
between PLS and PCR. In PCR, { vpj} are calculated only from GC data but both GC and sensory data are used for calculating { vpj} in PLS. Thus, better predictability may be
obtained for PLS because PLS can utilize all the information contained in both the GC data and sensory scores.
The most appropriate numbers of the prlncipal components (PC) and PLS components were determined by cross-
(cosine 90'=0). Centroid and Ward's methods were used to merge the resulting sub-clusters (SPSS; Norusis, 1993).
validation in PCR and PLS (Sharaf et a/., 1986). In crossvalidation, a part of the sample rows was randomly deleted from the data matrix and PCR or PLS was performed for the
Factors were extracted from the correlation matrix composed
reduced data matrix. The sensory scores of the deleted samples
of 35 variables using principal component analysis (PCA)
were predicted using the first PC (PC I ) to calculate the
correlate at all or are orthogonal, then the angle becomes 90'
T. AISHIMA et a/.
40
Table 1. Combinations of highly correlated peaks.
Peak number and component
r
0.963 0.958
0.926
18
a-Cedrene
7 ( Z )-2-Penten- I -ol
34 (E)-Geranic acid 4 (E)-2-Hexenal 32 Cedrol
26 Geraniol 2 l -Penten-3-01
c!-Cedrene
0.88 I
18
0.859
12 Linalool oxide (cis furanoid)
0.844
18
3 l
lO
Table 2. Factor loadings (>0.5)
( E )-2-Hexen- I -ol
34 Bovolide 28 Benzyl alcohol 35 Indole 34 Bovolide 34 Bovolide 32 Cedrol 35 Indole 29 2-Phenylethanol
Nonanal Hexanal
Phenylacetaldehyde 25 Nerol 21
8
Nonanal
lO
Heptanal Hexanal
30 fi-Ionone 18 c!-Cedrene 34 ( E)-Geranic acid
-O.6 1 4
-0.599 -0.598 -0.596 -0.593
Phenylacetaldehyde 20 ~-Cyclocitral 21
16 Benzaldeh yde
0.8 1 6
-0.722 -0.698 -0.697 -0.649 -0.623
14 Linalool oxide (trans furanoid)
33 Bovolide
c!-Cedrene
7 ( Z )-2-Penten- I -ol
0.824
3,7-Dimeth yl- I ,5 ,7-0ctatrien-3-01
19
2 l -Penten-3-01
0.889
0.82 l
Peak number and component
Hexanol
4 ( Z )-3- Hexenal
ll
( E )-2-Hexen- I -ol
eigenvalues and cumulative proportion in factors I to 3 with mean GC area ratios in the two clones and correlation coefficients
(r) with sensory scores.
Mean (Std. Dev.)
Factor loadings
No.
Component
Factor I Factor 2
Factor 3
6/8
TNl 4-3
t-Test
r
-O, 1 99
Hexanal
0.673
0.31 0.08'
O.45 0.05
**
2
l -Penten-3-01
0.886
O. 14 O.06:
0.21 0.06'
*
-0.793 * *
3
Heptanal (Z)-3-Hexenal
0.799
0.02 0.00:
0.05 O.02'
**
0.632
O. 17 0.05:
0.24 O.07'
-0.356 -0.454*
2.64 0.74'
3.2 1 i 0.8 1 '
-0.767 * *
O.03i 0.0 1 :
O.04 0.01 '
0.2 1 5
O. lOi 0.05'
O. 1 7i 0.05'
-0,769 * *
0.091 0.03'
0.061 0.02'
O. 1 51 0.06'
0.20 O.07
0.06i 0.0 l
O. 1 31 0.03
**
-0.500*
O. 14* 0.06
0.07* 0.02
**
-0,2 1 5
0.09+ O.04
O. I I + 0.02
0.04 0.01
0.05 0.01
0.28 0.12
0.47 0.09
O.05 0.03
0.05 0.02
O.05 0.01
0.09 0.02
0.92 0.28
l.19 0.32
0,546* 0,546*
0.65 O.56
0.61 0.51
O, 574* *
0.09 0.08
0.09 0.07
0.07 0.02
O. 12 0.04
0.662
0.77 0.21
l .06 0.24
0.878
0.07 0.03
0.08 0.03
0.02 0.02
0.03 O.02
O.66 O. 1 3
0.49 0.09
I
4
( E )-2-Hexenal
6 7 8
9 lO
o.683
0.569
Pentanol ( Z )-2-Penten- I -ol
0.502
0.9 1 8
0.573
Hexanol ( Z )-3-Hexen- I -ol
Nonanal
0.86 l
0.886
( E )-2-Hexen- I -ol
12
Linalool oxide (cis furanoid)
0.708
13
(E,Z)-2,4-Heptadienal
0.537
14
Linalool oxide (trans furanoid)
0.833
15
-0.535
0.536 0.685
( E , E )-2,4-Heptadienal
16
Benzaldehyde
17
Linalool
O.854 0.768
*
-0.224 -0.607 * *
-0.428* O. 1 82
**
O.323 O. 1 6 l
**
18
o!-Cedrene
19
3,7-Dlmethyl- I ,5,7-0ctatrien-3-01
20
~ -C yclocitral
21
22
Phenylacetaldehyde a-Terpineol
23
Linalool oxide (cis pyranoid)
24 25 26 27 28 29 30
Methyl sallcylate
0.546
Nerol Geraniol Geranyl acetone
0.847
0.06 0.03
0.04 O.02
0.7 14
l.22 0.60
O. 16 O.04
0.02 O.Ol
0.01 O.Ol
Benzyl alcohol
0.596
0.03 O.02
0.03 O.OI
2-Phenylethanol
0.644
0.00 0.01
0.02 0.00
**
0.002
P-Ionone
0.6 1 8
0.05 0.02
0.06 0.02
**
0.296
31
Nerolidol
0.09 0.04
0.06 0.02
0.359
32 33
Cedrol Bovolide
0.45 0.43
0.38 0.55
0,569*
0.03 0.01
0.03 0.01
0.533*
34 35
(E)-Geranic acid Indole
0.41 0.14
0.08 0.05
0,039
0.01 O.OO
0.03 O.02
O.268
-0.732 -0.769
O.680
-0.672 -0.506
-0.800
Cumulative %
32.8
** P