sary for the cartographer to âquantizeâ data by combining values into class intervals. As a simple illustration an automatic line plotter can be programmed to draw ...
Choropleth Maps Without
Q~SS
Intervals?
W. R. Tobler
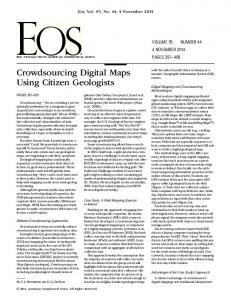
It is now technologically feasible to produce virtually continuous shades of grey by using automatic map drawing equipment. I t is therefore no longer necessary for the cartographer to “quantize” data by combining values into class intervals. As a simple illustration an automatic line plotter can be programmed to draw lines virtually any distance apart (Fig. 1). Thus, one can obtain any desired destiny of inked area to white area. For example, if the geographical data, symbolized by a, are normalized to lie in the range from zero to one, then an appropriate spacing of orthogonal lines of width w is given by s=(w/a.)
-
[l+(l-e@)V.].
Here an exponent ( x 1.4) of z has been chosen to approximate the nonlinear response of the human eye [13].The units of the spacing s are those of w. Comparable equations are easily obtained for dashed lines or for dotted maps. Automatic equipment that produces grey areas by modulation of light intensities can produce even more refined displays. There thus results a choropleth map on which the visual intensity is exactly proportional to the data intensity. Since no class intervals have been introduced, there is no quantization error [I, 2, 111. The much studied [5, 6, 7, 8, 9, 10, 121 and difficult problem of optimum class intervals is thus circumvented. Some cartographers will still wish to group their data into classes and will argue that they do this in order to simplify or enhance the map for the user. This, then, is a problem of map generalization and not necessarily one of chosing class intervals. I assume that, by definition, a generalization of a choropleth map is another choropleth map, not a smooth surface as might be built up from modelling clay. A choropleth map can be generalized in at least four ways. First, by combining
W.R. Tobkr is professor of geography at the University of Michigan.
264
/ Geographical Analysis
adjacent areal units (units that have similar values are made into new units whose value is some combination of the earlier values, or small units are eliminated, reducing the resolution of the data) ; secondly, by simplification of the boundaries of the areal units; thirdly, by changing the value of each unit in some manner which depends on the values of the adjacent units [17] ; fourthly, by quantizing the data more coarsely, i.e., by picking large class intervals, or by using some nonlinear class intervals. As an analogy, one may consider the ways of generalizing a topographic surface: by varying the spacing of the sampling points, by smoothing with a filter, or by choosing a larger or variable contour interval. The latter method is of course comparable to the choosing of class intervals for a choropleth map. Enlarging or modifying the contour interval, without simplifying the contours, does not necessarily improve the map, but may enlarge the quantization error. Taking samples at larger or different spatial intervals is equivalent to filtering using a different two-dimensional Dirac comb [ 3 ] and thus is a type of smoothing. The more general case is to modify the values of each unit in a controlled manner that depends on the values of adjacent units [14, 151. This is easily achieved by performing the choroplethic equivalent to taking a two-dimensional weighted moving average, as, for example, in binomial filtering [4, 16, 171. Either smoothing or emphasis can be obtained in this manner. The main argument in favor of using class intervals seems to be that their use enhances readability. This at least is the assertion. It seems equally plausible that this is also true of the three alternate map generalization methods cited above. If the assertion is in fact valid why then is grouping of greys into classes not also (e.g., in addition to spatial filtering) used to enhance aerial photographs, or television? Formulae for the optimal quantization of images are in fact given in the literature on picture processing, where the main difficulty stems from the conversion of continuous images into discrete signals, or relates to transmission band-width and noise reduction studies [I, 2, 111. Typically, a large number (26) of levels are recommended, compared with the small (22 to 28) number used for choropleth maps, though somewhat fewer levels are required for equally satisfactory colored pictures. It is thus not clear why the theory for pictures should differ from the theory for choropleth maps, since both have visual information processing as their ultimate objective. Presumably, both have some domain of validity, but the limits need further exploration. LITERATURE CITED 1. ANDREWS, H. C. Computer Techniques in Zmage Processing. New York: Academic Press, 1970. Pp. 136-51. 2. DIGIUSEPPE,J. L. A Survey of Pictorid Data Compression Techniques. Technical Report No. 16, Contract N. DA-49-083 OSA-3050, University of Michigan, Ann Arbor, University of Michigan, 1969. 3. GOODMAN, J. W. Introduction to Fowier Optics. New York: McGraw-Hill, 1968. Pp. 14-25. 4. HOLLOWAY, J. L. “Smoothing and Filtering of Time Series and Space Fields,” Advances in Geophysics, 4 (1958), pp. 351-89.
Research Notes and Comments / 265 5. 6. 7. 8. 9. 10. 11. 12. 13. 14.
G. F. “Generalization in Statistical Mapping,” Ann&, Association of American Geographers, 53 (1963), pp. 15-26. JENKS, G. F. and M. R. C o r n o x “Class Intervals for Statistical Map,” Znternationd Yearbook for Cartography, 3 (1963), pp. 119-34. JENKS, G. F. and F. C. CASPALL. “Error on Choroplethic Maps,” Ann&, Assodation of American Geographers, 61 (1971), pp. 217-44. MACKAY, J. R. “An Analysis of Isopleth and Choropleth Class Intervals,” Economic Geography, 31 (1955), pp. 71-81. MONMONIER, M. S. “Contiguity-Biased Class-Interval Selection,” Geographical Review, 62 (19721, pp. 203-28. ROBINSON, A. H. and R. D. SALE. Elements of Cartography. 3rd ed. New York: Wiley, 1968. Pp. 164-70. ROSENFELD, A. Picture Processing by Computer. New York: Academic Press, 1969. Pp. 2G28. S m , M. W. “Nested-Means Map Classes for Statistical Maps,” Ann&, Assoaation of American Geographers, 60 (1970), pp. 385-93. STOESSEL,0. C. “Standard Printing Screen System,” Proceedings, 1972 Fall Convention, American Congress on Surveying and Mapping, Columbus, Ohio, 1972, pp. 11149. TOBLER, W. R. “Numerical Map Generalization,” Michigan Inter-University Commvnity of Muthemuticd Geographers Paper No. 11, Ann Arbor, University Microfilms No. OPJENKS,
33067, 1966.
15. 16. 17.
-. “Of Maps and Matrices,” Journal of Regiond Science, 7 (1967), pp. 275-80. . “Geographical Filters and Their Inverses,” Geogruphicd Analysis, 1 (1969), pp. 234-53. -. “CHOROS:
A Computer Program to Apply Linear Neighborhood Operators to Choropleth Maps.” Ann Arbor, April, 1972. Available from the Geography Program Exchange, Computer Institute, Michigan State University, East Lansing, Michigan 48823, USA.