Sep 1, 2009 - For processing different types of spectral representation we use the standard .... a group of 24 chords: 12 for every semitone in major (C, C#, D,. D#, E, F, F#, G, G#, A, .... Image processing algorithms can di- minish the blur, but ...
Proc. of the 12th Int. Conference on Digital Audio Effects (DAFx-09), Como, Italy, September 1-4, 2009
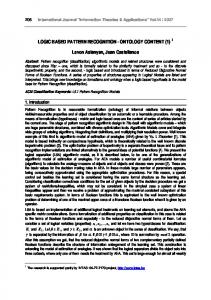
CHROMA AND MFCC BASED PATTERN RECOGNITION IN AUDIO FILES UTILIZING HIDDEN MARKOV MODELS AND DYNAMIC PROGRAMMING Alexander Wankhammer, Peter Sciri, Alois Sontacchi, Inst. of Electronic Music and Acoustics, Univ. of Music and Performing Arts, Graz, Austria {wankhammer,sciri,sontacchi}@iem.at ABSTRACT In this paper we present an algorithm to reveal the immanent musical structure within pieces of popular music. Our proposed model uses an estimate of the harmonic progression which is obtained by calculating beat-synchronous chroma vectors and letting a Hidden Markov Model (HMM) decide the most probable sequence of chords. In addition, MFCC vectors are computed to retrieve basic timbral information that can not be described by harmony. Subsequently, a dynamic programming algorithm is used to detect repetitive patterns in these feature sequences. Based on these patterns a second dynamic programming stage tries to find and link corresponding patterns to larger segments that reflect the musical structure. 1. INTRODUCTION Music is one of the oldest forms of human communication and expression of feelings or experiences. Therefore it carries a lot of properties that are strongly related to the culture it stems from. Although all components that form music - from a single narrating voice to a romantic orchestra performing a symphony - can be extremely different, one common component is the existence of repetitive parts. In the history of occidental music, the beginning of polyphony took place in the eras of late Middle Age and Renaissance [1]. Musical progression was now no longer dependent only on a single voice but had gained an additional dimension: harmony. While being a product of various contemporaneous melodies in Renaissance, Baroque composers have made strong use of harmonic relations to reinforce the dramatical progress [2]. This development has not ended until nowadays’ popular music. Therefore segment detection based on the semantic information offered by the harmonic progresion exploits the same basis of information as used in conventional musicological formal analysis. For processing different types of spectral representation we use the standard Short Time Fourier Transform (STFT) [3] as a basis of analysis. The resulting feature space is computed by means of the Constant-Q Transform (CQT) [4], [5], the chroma [6], [7], [8] and the Mel Frequency Cepstral Coefficients (MFCCs) [9], [10]. Many different approaches regarding segmentation of music have been published and discussed in literature. Levy and Sandler have proposed labelling and constrained clustering of spectral features in [11]. Aucouturier and Sandler have presented an approach using succession of timbres using MFCC in [12] whereas Wang et al in [13] exploit information gathered from the Constant-Q Trans-
form. Eronen uses a combination of MFCC and chroma features for chorus detection in [14] and Ong and Herrera have presented an algorithm in [15] that uses a set of low level descriptors to detect segment boundaries. Our model focusses on the usage of harmonies extracted from chroma vectors. Additionally it uses MFCC vectors to extend the information basis to timbral features that cannot be detected by means of chords. In the following section 2 we want to present the components of our approach. In section 3 we will discuss the extraction of chroma and MFCC features, followed by the determination of the beat and the corresponding beat synchronous chord sequence in sections 4 and 5. Pattern recognition through dynamic programming and the subsequent structural analysis will be the topic of sections 6 and 7. The evaluation of the algorithm will be discussed in section 8 concluding the results in section 9.
2. APPROACH The algorithm consists of the following sequential blocks (see figure 1): 1. Segment the signal into frames and calculate spectral features for every frame, 2. Perform beat detection and compute average values for all features belonging to one beat, 3. Use chroma vectors to estimate a chord sequence by using a Hidden Markov Model, 4. Perform pattern recognition of chord and MFCC sequences using dynamic programming, 5. Structural analysis: find and group similar repetitive patterns.
3. FEATURE EXTRACTION Obtaining information on the harmonic events causes the necessity of a spectral description of the signal. After resampling the signal to a frequency of fs = 11025Hz we use Hanning windowed blocks and an FFT length of N = 4096 to compute the STFT. With this set of parameters we obtain a frequency resolution of ~2,7Hz/bin. The hop size is set to k = 512 which allows for a temporal resolution of about 45ms.
DAFX-1
Proc. of the 12th Int. Conference on Digital Audio Effects (DAFx-09), Como, Italy, September 1-4, 2009
in [17].
Audio File
3.2. MFCC Beat Tracking
Pattern recognition: dynamic programming
Pattern recognition: dynamic programming
Many pop songs do not expose substantial harmonic changes in their progression - subdivisions are made by lyrical changes or variations in timbre. As lyrical changes can hardly be made recognizable to the computer with state-of-the-art methods, we need to focus on the timbral events. The Mel Frequency Cepstral Coefficients (MFCC) have successfully been utilized in audio and speech applications for many years and are a powerful method for describing timbral properties of a signal as reported in [12], [18] and [19]. The optimum number of MFCCs used in algorithm has been found to be 10 coefficients.
Repetition probability flux
Repetition probability flux
4. BEAT DETECTION AND AVERAGING
Beat synchronous chroma
Beat synchronous MFCC
Chord estimation: HMM
Summing repetitive fluxes Find peaks that indicate repetitions Refine roughly detected borders Figure 1: Flowchart of the algorithm
3.1. Chroma Extracting harmonic information directly from a spectrogram comes with a lot of problems, such as the fact that the logarithmic human perception of sound collides with the linear frequency resolution of the Frourier Transform. We therefore need to adapt the result of the STFT to a non-linear scale which matches the human perception of music. An appropriate auditory model to achieve this is the Constant-Q Transform (CQT) as presented in [4]. The CQT of a signal can be seen as a filterbank in which every single frequency band kcq represents one semitone of the equally tempered scale. Theoretically, this could be extended to quarter or 1/8-tone resolution. Using the semitone instead as a rasterization seems more appropriate as occidental music was developed upon this measure (even though there do occur notes like the harmonic seventh that are derived from the overtone scale and would fit a quarter tone scale more tightly [16]). To avoid misinterpretation of songs not played according to the standard pitch of 440Hz we perform a tuning step by detecting the center of energy within ±1 quarter-tone around the standard pitch. The energy of the corresponding STFT bins is summarized over time and the position of the peak determines the most probable tuning frequency. To receive the chroma vector we summarize the energy that is distributed over all the bins that belong to one tone - those can be addressed as c(kcq ) = mod(kcq , 12). Thus, chroma is measure for the spectral energy that is divided into the 12 semitones of the well-tempered scale despite of their their real-world frequencies as utilized by Bartsch and Wakefield
For further analysis we need a stable temporal representation of the extracted features. We therefore need to group data into sensible units. One unit that is very suitable for this purpose is the beat. The beat is often defined as the rhythm or tempo one would intuitively start tapping with a foot or finger while listening to a piece of music. It can therefore be seen as the elementary temporal unit of a song. By defining an offset at the beginning and the end of every beat, we can achieve suppression of transient events which improves the desired stability. The chosen offset is set to 1 frame (about 45ms). In our approach we use a method proposed by Ellis in [21] that allows detecting beats within an audio file and has been proven to perform in a very adequate way. As an additional constraint we define a range of possible beatsper-minute values between 70 and 200 BPM which turned out to be reasonable for the used test set. Values under the lower threshold are doubled and values above the upper threshold are divided by 2. For the resulting time intervals we perform averaging of the block features STFT, CQT, chroma and MFCC. 5. CHORD DETECTION: HIDDEN MARKOV MODELS Using chroma vectors to estimate chords in audio signals has been proposed in various papers e.g. [8], [17] or [22]. A-priori likelihoods derived from musical theory can be used to improve analysis by introducing Hidden Markov Models (HMMs). A Hidden Markov Model can formally be defined as λ = {Q, A, O, B, π}
(1)
where the describing parameters are: Q . . . set of available states A . . . transition probabilities O . . . observations B . . . observation or emission probabilities π . . . initial probabilities A large-scale study on the performance of approaches for chord estimation utilizing HMMs [7] published by Papadopoulos discussed the possibilities of predefining the model or using the EM algorithm to perform self training. Though our tests have shown
DAFX-2
Proc. of the 12th Int. Conference on Digital Audio Effects (DAFx-09), Como, Italy, September 1-4, 2009
that in some cases a self-trained HMM can perform much better than an untrained HMM, the overall results did not show much significance when analysing structure due to the very high amount of smoothing that inherently comes with self-trained HMM. They will therefore not be used in this approach.
start
C
C
C
C
C#
C#
C#
C#
D
D
D
D
D#
D#
D#
D#
B
B
B
B
c
c
c
c
c#
c#
c#
c#
d
d
d
d
d#
d#
d#
d#
b
b
b
b
o1
o2
o3
oN
stop
Figure 2: A chord sequence as a Markov chain: transition probabilities are indicated by the lines between states (on behalf of simplicity only the final trellis marked by the gray colored state is displayed). The set of available states Q is defined by musical theory as a group of 24 chords: 12 for every semitone in major (C, C#, D, D#, E, F, F#, G, G#, A, A#, B) and the corresponding 12 chords in minor. The enharmonic equivalents do not carry information for our algorithm and are therefore ignored. The transition probability matrix A can also be derived from musical theory. Transitions between certain chords have an implicit probability due to their relation on the circle of fifth. We used the model of the hypertorus as introduced in [23] by Li and Bello to describe this knowledge in mathematical form. Observation probabilities (also called emission probabilities) are modelled as a multivariate Gaussian Mixture Model (GMM) which are a weighted combination of multivariate Gaussians that can be described by the mean vector µ ~ and the covariance matrix Σ. We determined the mean vectors by accumulating the energy of the tones of a chord and its first n harmonics as proposed by [7]. This is done for every of the 24 chords. The covariance matrices we use consider the correlation of the tones that form a chord. An extended approach could also consider introducing harmonics to the covariance matrices. For additional reading on the determination of the GMM parameters, refer to [7]. To finally estimate the most probable sequence of chords we use the extracted and averaged chroma sequence as observation vectors for the Hidden Markov Model. The Viterbi algorithm finds the sequence of HMM states that matches the observed sequence best [24]. The result of the chord detection step is a beat synchronous
concatenation of chord symbols corresponding to the schema depicted in figure 2. 6. DYNAMIC PROGRAMMING To gain some insight into the underlying harmonic and timbral structure of the song, we need a method to decide whether a given sequence of chords or MFCC vectors is repeated in an other part of the song. Since repetitions may not be perfect, repetitions with small deviations need to be detected as well. To accomplish this task of approximate pattern matching a simple algorithm based on dynamic programming is used. Generally, dynamic programming is a technique to solve problems that exhibit the properties of overlapping subproblems as described by Bellman in [25] and is used in cases of pattern recognition as published by Chen in [26] and Chai in [27]. The chord sequence computed by the Hidden Markov Model needs to be relabeled according to the relations of its chords on the circle of fifths. More specifically, the symbols are assigned integer values that can be used to calculate the distance between two successive chords. In order to guarantee accuracy regarding music theory, those values are chosen according to the “doublenested circle of fifths” as proposed in [7]. The basic principle of our method is the recursive estimation of a least-cost path that indicates the repetition of a certain pattern. In our algorithm a pattern V of length M is compared with the following rest of the sequence. This is performed for the entire sequence in i steps by shifting the pattern V by the hop size k at every iteration. This pattern can be one-dimensional (chord sequence) or multi-dimensional (MFCC vectors). To measure the similarity of a pattern to all observations we define the following normalized distance for the one dimensional case (eq. 2) and the varied cosine distance for the multidimensional case (eq. 3) :
dc (vm , vr ) =
1 12
|vm − vr | 12 − mod 12 |vm − vr |
dM F CC (v~m , v~r ) = 0.5 − 0.5
if
|vm − vr | ≤ 12 else (2)
v~m • v~r |v~m ||v~r |
(3)
As additional parameters for the algorithm, a cost of deletion or insertion1 factor e can be defined which determines the impact ambiguities that do not match the investigated pattern. For the computation of the dynamic programming matrix Di for the i-th pattern we perform an iterative, recursive calculation that includes the distance and the cost factor: 8
else
1 L
PL[i]
r=1
d[i, r]
1. the j-th segment is compared to the rest of the song using chroma vectors as a representation of spectral events, and beats as the time basis. The last row of the dynamic programming matrix exposes certain minima.
(6)
2. the (j + k)th segment is attached in a loop to the segment j where k = 1 at the first iteration. Again the prolonged segment is compared to the rest of the song.
where L[i] denotes the “length” of a column, which is defined as the number of elements 6= 0 that decreases with i. In other words, a value d[i, r] of a column r that is less or equal the mean of the column is set to zero. This can be interpreted as an adaptive threshold that suppresses all except the most prominent peaks in the difference function. Subsequently, the entire column is summarized in the flux function φ[i]: L[i] X ˆ r] φ[i] = d[i, (7)
10
cost function
8
r=1
The resulting function φ[i] depicts the maximal changes in the matching matrix as local maxima.
6
4
2
1
0 0.9
50
100
150
200 [beats]
250
300
350
0.8
0.7
Figure 6: Matching functions of variable length segments (taken from “Beatles - Don’t Bother Me”, j = 2). Bottom-up: only jth segment (k = 0), k = 1, k = 2, k = 3
φ
0.6
0.5
0.4
3. the iteration of k is stopped if the following condition is fulfilled: the merged segment length exceeds a significant border - it contains data that should not be part of it. Thus, the probability or position of its repetition will change (see figure 6 at the topmost line, where the deep valley is suddenly flattened).
0.3
0.2
0.1
0 0
20
40
60
80 i [hop]
100
120
140
160
Figure 5: Summarized repetition probability flux of “Alanis Morisette - Head Over Feet”. The dashed vertical lines indicate predefined borders whereas the triangulars mark the detected borders. A peak picking algorithm detects those maxima using some limitations i.e. an adaptive sliding-median threshold with ajustable window length, a minimum distance between two peaks and an optional maximum number of detected peaks. As a result we receive a first, rough estimate for segment borders which are located at the positions of the peaks in the flux function. 7.2. STAGE II: Refinement The rough detection step often results in a large amount of segments that can be identified as repeating patterns in the song. However, many of them are quite short excerpts that would not be declared as a musical unit like verse or chorus. This is due to the fact that the detection of repetitive elements on a basis of 8 beats only carries a limited amount of information about the large scale musical structure of a song. Thus, we need to combine multiple segments into larger units that should then match segments like verse or chorus. This is done in an iterative approximation starting at j = 1 and using again dynamic programming to measure the similarity:
4. the next iteration begins at segment j = j + k The deep valleys indicate very distinct detections of repetitions. Figure 6 displays four iterations of the algorithm for the jth segment. As we can see the first three lines exhibit a very clear valley at 48 beats. In the fourth step we prolonged the segment too much, so that it already contains a part of the following musical unit. The flattening of the valley tells us that the merged segment is not repeated at the position of the valley. Thus, we can assume that we have exceeded a critical length and have to stop the iteration. This method enables us to combine multiple short segments into more meaningful units that fit the musically perceived segmentes much more accurately. 8. EVALUATION In order to evaluate the performance of the algorithm the resulting segmentation is compared to a ground truth. This testing corpus is similar to the one used by Levy and Sandler in [11] and consists of 32 pop songs.2 One half is formed by 16 works by The Beatles as they have emerged to a standard in evaluation of similar tasks. The other half consists of 16 more recent pieces by artists like Björk, Britney Spears, Eminem, Madonna and Michael Jackson.
DAFX-5
2 http://www.elec.qmul.ac.uk/digitalmusic/downloads
Proc. of the 12th Int. Conference on Digital Audio Effects (DAFx-09), Como, Italy, September 1-4, 2009
Defining a ground truth for musical segmentation is a very crucial task. People define transitions between segments very differently e.g. repetitions within a verse can be annotated as one large or two smaller parts. The body used here has been defined by either professional musicians and/or musicologists for the MPEG-7 working group. Performing the evaluation on basis of the ground truth needs a certain amount of allowed deviation. In this case we followed literature and picked a trust interval of 3s. Subsequently the performance of the algorithm is measured by precision p, recall r and the f-value f which are calculated by relations between correctly detected borders trueP os, incorrectly detected borders f alseP os and missed borders f alseN eg: p=
trueP os trueP os + f alseP os
(8)
r=
trueP os trueP os + f alseN eg
(9)
2pr p+r
(10)
f=
Generally we could observe that the entire system is vulnerable to the used set of parameters. A certain setup can perform perfectly on some songs but have less appropriate results for the rest of the corpus. Changing the parameters slightly leads to accurate results in another group of songs while the formerly perfect group loses accuracy. 10. FURTHER DEVELOPMENT A very promising path to continue this work is to improve the performance of the second stage. Many songs have exposed unusually high accuracy after applying the refinement step. The short segments detected by the first stage could be combined to meaningful larger elements that coincided with the reference segmentation very accurately. However, these results did not hold for the entire testing set. We therefore need to enhance the portability of the second stage to many different songs of diverse genres. 11. REFERENCES
The calculated values are depicted for different corpora in table 1.
[1] Cristle Collins Judd, Tonal Structures in Early Music, Taylor and Francis, 2000. [2] Manfred F. Bukofzer, Music in the Baroque Era - From Monteverdi to Bach, READ BOOKS, 2007.
Table 1: Performance measures after stage I. Corpus Beatles Recent Overall
precision p 0.50 0.70 0.62
recall r 0.83 0.73 0.77
f 0.61 0.70 0.65
[3] Jont B. Allen and Lawrence R. Rabiner, “A unified approach to short-time fourier analysis and synthesis,” Proceedings of the IEEE, vol. 65, no. 11, 1977. [4] Judith Brown, “Calculation of a constant q spectral transform,” J. Acoustic Soc. Am., vol. 89 (1), January 1991. [5] Judith Brown and Miller S. Puckette, “An efficient algorithm for the calculation of a constant q transform,” J. Acoustic Soc. Am., vol. 92(5), November 1992.
9. CONCLUSION The combination of chords and MFCCs is able to detect small musical units in a very accurate way. However, these segments do not match larger musical structures immediately. As visible in table 1 the recall value is quite high and guarantees a detection of almost every border whereas the precision value is relatively low. When examining the results by listening to segmented audiofiles, the system is able to generate very distinct segments that can also be very suitable as a loop because of its beat-synchronous cutting. The task of stage II is to combine shorter patterns into larger segments. This leads to a decrease of recall, but for some songs it leads to a very significant rise of precision. However, stage II comes with the danger of discarding too many - perviously correctly detected - borders. As already mentioned previously, absolute or platonic ground truth for segmentation of music does not exist. For instance, there are many different ways to perceive transitions between a verse and a chorus. There is, for example, no clear definition whether the chorus begins on the first beat, even though it has a pickup in the previous measure or if an immediate repetition of the chorus causes two segments or only one. Due to this missing ground truth, the evaluated values have to be handled with a lot of care - the Beatles corpus, for instance, shows some ambiguities and inconsistencies concerning the separation of verses into smaller units.
[6] Geoffroy Peeters, “Chroma-based estimation of tonality from audio signal analysis,” Proceedings of the International Conference on Music Information Retrieval (ISMIR), Victoria, Canada, 2006. [7] Helene Papadopoulos and Geoffroy Peeters, “Large-scale study of chord estimation algorithms based on chroma representaion and hmm,” in CBMI, 2007. [8] C. Harte and M. Sandler, “Automatic chord identfication using a quantised chromagram,” Proceedings of the 118th AES Convention, Barcelona, Spain, 2005. [9] V. Tyagi and C. Wellekens, “On desensitizing the melcepstrum to spurious spectral components for robust speech recognition,” Proceedings of the IEEE Acoustics, Speech, and Signal Processing (ICASSP ’05), 2005. [10] Ashish Ghosh, Rajat K. De, and Sankar K. Pal, Pattern Recognition and Machine Intelligence: Second International Conference, PReMI 2007, Kolkata, India, December 18-22, 2007 : Proceedings, Springer, 2007. [11] M. Levy and M. Sandler, “Structural segmentation of musical audio by constrained clustering,” Audio, Speech, and Language Processing, IEEE Transactions on, vol. 16, no. 2, pp. 318–326, Feb. 2008.
DAFX-6
Proc. of the 12th Int. Conference on Digital Audio Effects (DAFx-09), Como, Italy, September 1-4, 2009
[12] Jean-Julien Aucouturier and Mark Sandler, “Finding repeating patterns in acoustic muscial signals: Applications for audio thumbnailing,” AES 22 International Conference on Virtual, Synthetic and Entertainment Audio, 2002. [13] Muyuan Wang, Lie Lu, and Hong-Jiang Zhang, “Repeating pattern discovery from acoustic musical signals,” Proceedings of the International Conference on Multimedia and Expo (ICME), 2004. [14] Chorus Detection with Combined Use of MFCC and Chroma Features and Image Processing Filter, 2007. [15] B. Ong and P. Herrera, “Semantic segmentation of music audio contents,” 2005. [16] Robert Holford Macdowall Bosanquet, An Elementary Treatise on Musical Intervals and Temperament, Kessinger Pub Co, August 2008. [17] M.A. Bartsch and G.H. Wakefield, “To catch a chorus: using chroma-based representations for audio thumbnailing,” 2001, pp. 15–18. [18] Antti Eronen, “Comparison of features for musical instrument recognition,” 2001, pp. 19–22. [19] Chih-Wen Weng, Cheng-Yuan Lin, and Jyh-Shing Roger Jang, “Music instrument identification using mfcc: Erhu as an example,” . [20] Hiroko Terasawa, Malcolm Slaney, and Jonathan Berger, “A timbre space for speech,” Proceedings of Interspeech 2005, Lisbon, Portugal, 2005. [21] Daniel P. W. Ellis and Graham E. Poliner, “Identifying cover songs with chroma features and dynamic programming beat detection,” in ICASSP, 2007. [22] Geoffroy Peeters, “Musical key estimation of audio signal based on hidden markov modeling of chroma vectors,” in Proceedings of the 9th International Conference on Digital Audio Effects (DAFx-06), 2006. [23] Ernest Li and Juan Pablo Bello, “Key-independent calssification of harmonic change in musical audio,” in AES 123rd Convention, 2007. [24] Andrew J. Viterbi, “Error bounds for convolutional codes and an asymptotically optimum decoding algorithm,” IEEE Transactions on Information Theory, vol. 13, no. 2, pp. 260– 269, April 1967. [25] Richard Ernest Bellman, Dynamic Programming, Courier Dover Publications, reprint, illustrated edition, 2003. [26] Chi hau Chen, Pattern recognition and artificial intelligence, Academic Press, 1976. [27] Wei Chai and B. Vercoe, “Structural analysis of musical signals for indexing and thumbnailing,” May 2003, pp. 27–34.
DAFX-7