S. Sathiya et al. / International Journal of Engineering and Technology (IJET)
Pattern Recognition Based Detection Recognition of Traffic Sign Using SVM S. Sathiya #1, M. Balasubramanian #2, S. Palanivel *3 #
Assistant Professor ,Department of Computer Science and Engineering, Annamalai University, India 1
[email protected] 2
[email protected] * Professor, Department of Computer Science and Engineering, Annamalai University, India 3
[email protected]
Abstract—The objective of this work describes a method for Traffic sign detection and recognition from the traffic panel board(signage). It detect the traffic signs especially for Indian conditions. Images are acquired through the camera and it is invariant to size then it is scaled. It consist of the following steps, first, it detect the traffic sign, if it has sufficient contrast from the background then we use sobel edge detection technique and morphological dilation. Second, extract the detected traffic sign from the board using row count and column count. Third, to extract the feature using DCT, DWT and Hybrid DWTDCT. In training phase, DCT 20 highest energy coefficients are extracted, In DWT 300 features extracted from each traffic sign and in Hybrid DWT-DCT 20 features are extracted. Finally recognition are performed through SVM. The application is to improve the efficiency of transportation networks through applications of communication visually impaired person wear the camera to identify the traffic destination board. Experimental results show that state-of-the-art algorithms obtains highly competitive performance and is especially efficient to different levels of corruptions. The performance of Traffic Sign recognition is evaluated for Traffic Sign board image and the system achieves a recognition rate of 86% using DCT, 90% using DWT and 96% using Hybrid DWT-DCT and SVM. Keyword-Row count, Column count, DCT, DWT, Hybrid DWT-DCT, SVM. I. Introduction Identification of traffic signs correctly at the right time and at the right place is very important for car drivers to insure themselves and their passengers’ safe journey. However, sometimes, due to the change of weather conditions or viewing angles, traffic signs are difficult to be seen until it is too late. Recent increases in computing power have brought computer vision to applications. On the other hand, the increase in traffic accidents accompanying the increasing amount of traffic has become a serious problem for society. The occurrence of traffic accidents is particularly high under special road conditions, such as at the entrance to a one-way street, sharp curves, and intersections without traffic signals. One possible countermeasure is to install ”STOP”, ”NO LEFT TURN” and other traffic signs in order to notify the driver of the road conditions and other traffic information. However, there remains the possibility that the driver will depending on his/her state of mind, fail to notice the sign while driving, a serious accident is possible if the driver fails to notice a sign such as ”DO NOT ENTER”, ”STOP”, or ”ONLY DESIGNATED DIRECTION PERMITTED”. It is said that a driver who is operating a vehicle is relying 80-90% on visual information to understand the environment outside the vehicle [1]. Predictions state that approximately 40% of traffic accidents could be prevented by reducing forward inattention among the drivers [2]. It is possible that accidents can be prevented by utilizing an automatic road sign recognition system to provide traffic information to the driver, including information about the road in front of the vehicle. Traffic signs have also distinct shapes like circles, triangles, rectangles and octagons. These systems assist drivers to drive safely. Reduce drivers ’burden of making decisions and Increase drivers’ awareness about safe driving. I. Related Work Enormous approaches have been proposed in the literature for still-image based traffic sign detection and recognition such as Gabor, wavelet, LDA, PCA, Harr-like feature, HOG, Histogram. In [1], This system uses affine transformation coefficients as genetic algorithm parameters for sign detection. For the classification phase, the results show that neural networks are better than others, for this specific application. The processing times and error rates show that this system can be used as a part of complex real-time applications. A recognition accuracy of about 87% has been achieved. [2] proposes, a colour-based segmentation method is used to scan the scene in order to quickly establish ROI. Sign candidates within ROIs are detected by a set of Haar wavelet features obtained from Ada Boost training. Then, the Speeded Up Robust Features (SURF) is for the sign recognition. A recognition accuracy of over 90% in real-time has been achieved. [3] the Multi-Scale Retinex ISSN : 0975-4024
Vol 6 No 2 Apr-May 2014
1147
S. Sathiya et al. / International Journal of Engineering and Technology (IJET)
(MSR) algorithm for robust light and dark adaptation under harsh illumination environments and the SVM algorithm for robust traffic sign classification. Introduce the problem of traffic sign recognition (TSR) which has seen much activity in the recent decade. TSR is an exciting field with great promises for integration in driver assistance systems and that particular area deserves to be explored further. Traffic sign recognition such as Principal component Analysis(PCA) or Ada Boost [4]. PCA or Ada Boost, our approach offers a more adequate description of signs and involves effort less tainting. Upon this description we have managed to build an efficient road sign recognition system. [5] Local Contour Patterns and Hough-Transform-based approaches for circle and line detections. Here traffic sign detection, relying only on shape information, that analyses a 752x480 gray scale image in 40 ms in a Intel 8400 CPU, with a very good performance in real driving conditions. [6] Characteristics of traffic signs are colour and shape information which are used both by the driver and to develop traffic sign recognition systems. And further developing existing behaviour model of visions. CIECAM97 has been applied to extract colour information and to segment and classify traffic signs. Whilst shape features are extracted by the development of FOSTS model. The recognition rate is up to 95%. The goal of the proposed system is to assist the driver while driving like [7,8,9]. In contrast, there are several approaches [11] and [12] that entirely ignore colour information and instead of colour information, use only shape information from gray scale images. For example, [11] proposed a system that used local radial symmetry to high-light points of interest in each image and detect different shapes like octagonal, square and triangular road signs. ROI detected by using colour and shape information. Shape detection is done by pattern matching. Then ROI(s) is used in block invariant feature extraction, where Trace Transform is used. All information from preprocessing and invariant feature extraction block is used in sign type classification. Potential of this system is discussed in [14,15] detects candidate regions as maximally stable extreme regions (MSERs). Histogram of oriented gradient (HOG) features are extracted and Recognition is based on a cascade of support vector machine (SVM). [19] detects the traffic sign according to colour and shape classification using Linear SVM and content recognition using Gaussian Kernel SVMs. Result shows 93.24%, 7.85% and 44.90% are recognition success probabilities. A. Outline of Work The still image based traffic sign recognition system from signage’s are described in this paper consist of four modules. Detection of traffic panel sign, segmentation, feature extraction and reorganization of traffic signs using SVM. Detection and extraction of signage are described in Section2. Traffic sign feature extractions are described in Section 3. Recognition of traffic signs using SVM are described in Section4. Experimental results are described in Section 5. And conclusion in Section 6. Block diagram of proposed work is shown in Figure 1 II. Detection and Extraction of Traffic Sign Board The Unique identification of traffic sign by their prior knowledge like shape and their intensity value. Detection of traffic sign from outdoor image is the complex task; it can be done by using different steps. The whole work is done by using gray scale images. So detection is based on the edge information, shape information, Morphological operations and filtering. Acquired image is in RGB format, it should be converted into gray scale image. It can be easily converted by using the following formula 1 to find the intensity value instead of RGB, I = 0.2989 * R + 0.5870* G + 0.1140* B ----------------- (1) I is an image intensity values ranging from 0-255, Where R, G and B are the red, green, blue components respectively.
ISSN : 0975-4024
Vol 6 No 2 Apr-May 2014
1148
S. Sathiya et al. / International Journal of Engineering and Technology (IJET)
Figure 1. Block diagram of proposed work.
A. Edge Detection In this stage intensity variations are detected from an input image. If the foreground (traffic sign) has sufficient contrast compared with the background then use edge detection and morphological operations. To extract the traffic sign from the background then calculate the gradient mask and a threshold. First, edges are detected using sobel operator to find the threshold. The mask is slid or superimposed over an area of the input image, changes that pixel’s value and then shifts one pixel to the right and continues to the right until it reaches the end of a row. It then starts at the beginning of the next row. The Gx mask highlights the edges in the horizontal direction while the Gy mask highlights the edges in the vertical direction. After taking the magnitude of both, the resulting output detects edges in both directions. After applying edge detection, region between two different gray intensity values of traffic sign and its background are shown. |G| =Gx2 + Gy2 ---------------------------- (2) B. Thresholding Thresholding method is used for partitioning an image into required number of partitions. Thresholding is used in most of the methods for determining a threshold value as a criterion to select required region of interest. Threshold value for an image is selected based on the required region of interest. Different regions are obtained for various threshold values. Popular and commonly used Otsu’s thresholding method is adapted for global thresholding in an image. The main aim of Otsu’s automatic threshold is to select an optimum threshold value. After thresholding the output produced here is the binary gradient image. All pixels above a determined (threshold) grey level are assumed to belong to the object, and all pixels below that level are assumed to be outside the object. The selection of the threshold level is very important; as it will affect any measurements of parameters concerning the object (the exact traffic sign object boundary is very sensitive to the grey threshold level chosen). C. Morphological Operations There are several morphological operations are performed here to get a processed output. The steps involved here are. First Dilation, The binary gradient mask shows lines of high contrast in an image. These lines do not quite delineate the outline of the object of interest. Compared to the original image, you can see gaps in the lines surrounding the object in the gradient mask. These linear gaps will disappear, if the Sobel image is dilated using linear structuring elements. Here used to find the grown edges. It should be clear to find the required traffic sign in the given image. Detected regions are enhanced by using morphological dilation operation, Second one is Filling the Holes, The dilated gradient mask shows the outline of the image quite nicely, but the holes(noise) in the interior of the image is still appears. To reduce the noise, use hole filling algorithm. The connected borders ISSN : 0975-4024
Vol 6 No 2 Apr-May 2014
1149
S. Sathiya et al. / International Journal of Engineering and Technology (IJET)
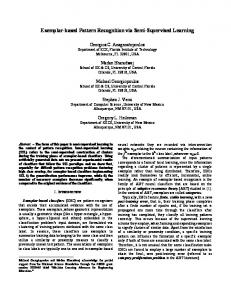
are removed to give a needed portion as an output, Next, Extract the Traffic Sign Board; The segmented sign are extracted by remove connected objects on its border, if it finds the whole regular object. Remaining area contains noise; it can be removed for further operation. Next it Smoothen the Traffic sign Board (signage), finally, the obtained traffic sign board is to be smoothen as that the segmented object should look natural as compared with the original image. This can be done eroding the signage object. Here we create a diamond shape structuring element for the accuracy of the image. D. Extraction of traffic sign Segmentation is used to crop required part of an image automatically. It is based on pixels relationship with their nearby neighbourhood in an image. Basically, segmentation methods are classified based on pixels relationship properties. Here our method of segmentation is by removing the unused row and column to get image clarity. By removing the unwanted area in the image the traffic sign looks clear and accurate. First, unwanted horizontal spaces are removed by fixing a specific threshold. And it count each row intensity values then it compare with threshold, if white present leave that row, otherwise remove that corresponding row. Likewise horizontal spaces are removed. Again it repeated to remove vertical unused area. Automatically cropped image are shown in Figure 2. III. Feature Extraction for Segmented Image The task of the feature extraction is to acquire the most relevant information from the original data and represent that information in a lower dimensionality space. Four methods are used to extract the features, namely, DCT, DWT and Hybrid DWT-DCT.
Figure 2. Traffic sign board extraction (a) Original image (b) Detected road sign (c) Row-wise segmented image (d) Column-wise segmented image
A. Feature extraction using DCT Discrete cosine transform (DCT) is a feature extraction technique for segmented traffic signage signs are proposed. It is a powerful transform to extract more important features for traffic sign recognition. DCT applied to all the signs, important features of the coefficients are selected to represent feature vectors in a zigzag manner or by zonal masking. After applying DCT, 20 top highest energy coefficients are extracted by 2DDCT. First coefficient is a DC coefficient and the remaining 19 coefficients are AC coefficients. It is possible to reconstruct the same as the given input(Inverse DCT). To keep consistency with matrix notation, pixel locations (and image sizes) are described using row(s) first, then column(s). Here segmented traffic signs are given as input image block are given as f(y, x), where y, x = 0, 1, 2..N − 1, we decompose it into 2D DCT basis functions. The result is an NXN matrix C(v, u) containing DCT coefficient. N −1 N −1
c(v, u) =
(2 y + 1)vπ (2 x + 1)uπ cos -----------(3) 2N 2N
α (v)α (u )∑∑ f ( y, x) cos y =0 x =0
For v,u = 1,2,....N-1
α (v ) =
1 for v=0 and α (v) = N
2 v=1,2,…,N-1 -------------------(4) N
Equation 3 is a forward DCT formula and Equation 4 is the values of(u) and (v). The coefficients are ordered according to Zigzag pattern, it reflecting the amount of information stored. For block located at (b,a), the DCT vector is composed in Equation 5, X = [c 0 (b,a) C 1 (b,a) .....c M-1 (b,a) ]-------------------(5)
ISSN : 0975-4024
Vol 6 No 2 Apr-May 2014
1150
S. Sathiya et al. / International Journal of Engineering and Technology (IJET)
Where M is the number of retained coefficients. That is, M = 20 , and denote the nth DCT coefficient. B. Feature extraction using DWT DWT is applied to Traffic Sign image and it gives four coefficients such as Approximation, Vertical, Horizontal and Diagonal coefficients. Then approximation coefficients are passed to DCT, these coefficients are quantised. 20 highest energy coefficients are used as feature vector. The input signal x(n) is decomposed into two sets of coefficients called approximation coefficients (denoted by CA) and detail coefficients (denoted by CD). These coefficients are obtained by convolving the input signal with a low-pass filter (for CA) or a high-pass filter (for CD) and then down sampling the convolution result by 2. The size of CA and CD is half of the size of the input signal for Periodic extension mode, and half of the sum of the input signal’s size and the filter’s size for Zeropadded extension mode. Note that the filters are determined by the chosen wavelet. The filtering or decomposition process is shown in Figure 3 Lo D and Hi D are low pass and high pass decomposition filters, respectively.2 # 1 or 1 # 2 represents down sampling by 2. CA and CD are the approximation and detail coefficients.
Figure 3.Two dimensional Wavelet decomposition.
1.Daubechies wavelet Daubechies wavelet is based on the use of recurrence relations to generate progressively finer discrete samplings of an implicit mother wavelet function; each resolution is twice that of the previous scale. Segmented traffic sign are used to extract feature, segmented traffic sign for feature extraction are shown in Figure 4a. The features are extracted from segmented traffic sign board. In training phase, 300 features are extracted from each traffic sign(Input image 320x240). It can be extracted iteratively four times, that is, input is 320x240 then it is decomposed into 160x120, 0x60, 40x30 and finally 20x15. Totally 300 features are used for Traffic sign recognition. Figure 4b shows first level of decomposition of segmented traffic sign. The individual objects are passed through the filter, which contains the four partitions, Approximation coefficients gives better representation than others.
(a)
(b)
Figure 4. a)Segmented Traffic sign for feature extraction and b) First level decomposition of segmented traffic sign Speed breaker.
C. Feature Extraction using Hybrid DWT-DCT Figure 5 shows the block diagram of proposed hybrid DWT-DCT. Original image of size NXN is decomposed using the 2D DWT, low frequency coefficients (Approximation detail) are composed further, the level of decomposition is depends on size of processing
ISSN : 0975-4024
Vol 6 No 2 Apr-May 2014
1151
S. Sathiya et al. / International Journal of Engineering and Technology (IJET)
Figure 5. Block diagram of Hybrid DWT-DCT
block obtained. The size of input image is 320x240, 300 features are extracted from each traffic sign, it require four decomposition steps to extract 300 feature (20 x 15). Then the Approximation details (CA) are passed to the DCT, these coefficients are quantized and 20 highest energy coefficients are extracted from the quantized matrix. High frequency coefficients are discarded(HL, LH, HH).Figure 6 shows the four level of decomposition of Traffic sign using DWT. Figure 7 shows the zigzag pattern of Hybrid DWT-DCT and corresponding plot.
Figure 6. Four level of decomposition of Traffic sign
IV. Traffic sign Recognition Using SVM Support vectors machine[16,17] is based on the Principle of Structural Risk Minimization (SRM). It is classification model. Support vector are
(a)
(b) Figure 7. a) DCT Quantisation matrix b) Plot for Hybrid DWT-DCT.
ISSN : 0975-4024
Vol 6 No 2 Apr-May 2014
1152
S. Sathiya et al. / International Journal of Engineering and Technology (IJET)
used to find hyper plane between two classes. Support vectors are the training samples that define the optimal separating hyper plane. Support vectors are close to the hyper plane. Like RBFNN, Support vector machines can be used for pattern classification and nonlinear regression. For linearly separable data, SVM finds a separating hyper plane, which separates the data with the largest margin. Support vector machines (SVM) are adopted to classify the inner part of road signs. Traffic symbols are recognized using HOG features and a cascade of linear SVM classifiers in [15] and in [19] shape classification using Linear SVMs. A.SVM principle Support Vector Machine (SVM) can be used for classifying the obtained data. SVM are a set of related supervised learning method. Let us denote a feature vector by x =(x1, x2,.., xn) and its class label by y such that y = +1,−1. Therefore, consider the problem of separating the set of n raining patterns belonging to two classes, Table 1. Types of SVM inner product kernels.
Types of kernels Polynomial
Gaussian
Sigmoid
Inner Product Kernel K(xT , x i ) (xTx i + 1)P
− xT − x i exp 2 2σ Tanh(
2
Details Where x is input patterns, xi is support vectors, σ 2 is variance, 1 _ i _ Ns, Ns is number of support vectors,
β 0, β1
(β (x x ) + β )
are constant values.
p is degree of the polynomial
T
0
i
1
Figure 7. Architecture of the SVM(Ns is the number of support vectors),
(X i , Y i ), X i ∈ Rn, y = +1,−1, i = 1, 2, ..., n
--------(6)
Figure 8.Maps 2-dimensional input space to higher 3-dimensional feature space. (a)Nonlinear problem.(b) Linear problem.
ISSN : 0975-4024
Vol 6 No 2 Apr-May 2014
1153
S. Sathiya et al. / International Journal of Engineering and Technology (IJET)
An example for SVM kernel function
φ (x) maps two dimensional input space to higher
three dimensional feature space is shown in Figure 8. Given a set of images corresponding to N Traffic sign for training, N SVMs are trained. Each SVM was trained to distinguish between all images of a single traffic sign and all other characters in the training set. During testing, the class table y of a face pattern x can be determined using Equation 7,
n, if dn(x) + t > 0 --------------------(7) 0, if dn(x) + t > 0
Y=
Where, d n (X) = max di(X)i =n 1 The distance from x to the SVM hyper plane corresponding to traffic sign i. the classification threshold is t, and the class label y=0 stand for unknown. During testing, the distance from x to the SVM hyper plane is used to identity the subject. Inner product kernel maps input space to higher dimensional feature space. Inner product kernel, K(x,x )=
φ ( x), φ ( xi) where x is input patterns, i is support vectors.
V. Experimental Results Performance of the traffic sign recognition using DCT, DWT and Hybrid DWT-DCT with SVM are achieved for different test samples. In this paper, we presented an image processing technique, designed for the detection, extraction and recognition of traffic sign from road ways. The DCT, DWT and Hybrid DWT-DCT features are extracted from each segmented traffic sign board and given as input to SVM model. Image is acquired through special digital camera, it is detected by using edge detection, thresholding, dilation, smoothing, connected component, hole filling. The next step is to extract the detected portion and avoid the unwanted portion of an image by using row-wise segmentation and column-wise segmentation. Then the features are extracted from each segmented portion of traffic sign board using DCT, DWT and Hybrid DWT-DCT. Finally segmented traffic sign is recognized from numerous trained traffic signs. For training, 50 different traffic signs samples are used. A. Traffic sign Recognition using DCT and SVM In training phase, DCT is applied to all segmented traffic sign images, and features are extracted to form feature vectors in a zigzag manner or by zonal masking. These important coefficients are in from left top to zigzag manner. After applying DCT to each segmented character, 20 top highest energy coefficients are extracted, which is used as feature vector. First coefficient is a DC coefficient and the remaining 19 coefficients are AC coefficients. After applying DCT the matrix is taken as a zigzag format. Top values are having more important than others. This paper, 20 top coefficients are considered as a feature vector for a traffic sign. In testing, DCT is applied to test segmented characters, 20 highest energy coefficients are extracted from given test traffic sign, and given as input to SVM model. Finally, SVM recognize the traffic sign. B. Traffic sign Recognition using DWT and SVM In training phase, DWT is applied to all segmented traffic sign board and features extracted to form feature vectors, and 300 discrete wavelet features are extracted from each traffic sign using DWT. In training phase, the performance of traffic sign board is evaluated for traffic sign board image. In testing, DWT is applied to test segmented traffic sign, 9 features are extracted from given test traffic sign, and given as input to SVM model. Finally, SVM recognize the traffic sign. C. Traffic sign Recognition using Hybrid DWT-DCT and SVM In training phase, 2D DWT is applied to all segmented Traffic signs images it produce CA, CV, CH and CD. Then DCT is applied for approximation coefficients(CA) of DWT and first 20 highest energy DCT coefficient is chosen as feature vector of each segmented Traffic sign. For testing, Hybrid DWT-DCT is applied to test Traffic sign and the resultant features are given as input to SVM model. Finally SVM recognize the Traffic sign. D. Performance measures Measures of the quality of recognition are built from a confusion matrix which records correct and incorrect reorganization of each class. Figure 9 presents a confusion matrix for recognition, where tp are true positive, fp false positive, fn false negative, and tn true negative counts.
ISSN : 0975-4024
Vol 6 No 2 Apr-May 2014
1154
S. Sathiya et al. / International Journal of Engineering and Technology (IJET)
Figure 9. Confusion Matrix for Recognition.
1. Accuracy Accuracy assesses the overall effectiveness of the algorithm. It is given by, Accuracy =
tp + tn ----------- (8) tp + fp + fn + tn
2. Sensitivity/Specificity Two measures that separately estimate a recognition performance on different classes are sensitivity and specificity. Sensitivity =
tp --------------- (9) tp + fn
Specificity =
tn --------------10) fp + tn
3. Precision/recall/F-score The measures of choice calculated on the positive class are: Precision =
tp = Sensitivity-------- (11) tp + fp Table 2. Confusion Matrix.
Features
TP
TN
FP
FN
DCT
20
23
4
3
DWT
23
22
2
3
25
23
2
1
Hybrid DWT-DCT
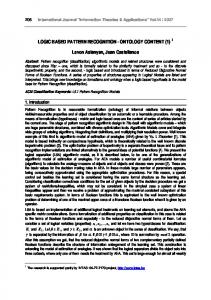
Table 3. Performance Measure(Precision, Recall(Sensitivity), Accuracy, Specificity, F-Score.)
Features
Precision
Recall
DCT
0.83
0.86
0.86
0.85
0.84
DWT
0.92
0.88
0.90
0.91
0.89
Hybrid DWT-DCT
0.92
0.96
0.94
0.92
0.93
ISSN : 0975-4024
Accuracy
Vol 6 No 2 Apr-May 2014
Specificity
F-Score
1155
S. Sathiya et al. / International Journal of Engineering and Technology (IJET)
Precision is same as sensitivity given in Equation. Recall =
( β 2 + 1) * Pr ecision * recall tp , F-Score = --------(12) tp + fn β 2 + precision + recall
All three measures distinguish the correct recognition of labels within different classes. They concentrate on one class (positive examples). Recall is a function of the correctly recognized examples (true positives) and the misrecognised examples (false negatives). Precision is a function of true positives and examples misrecognised as positives (false positives). b is the bias applied to favour any particular class. The F-Score is evenly balanced when b = 1. It favours precision when b > 1 and favours recall otherwise. The performance of the system achieves about 96% recognition rate. The performance of Traffic sign recognition using different SVM kernels with DCT, DWT and Hybrid DWT-DCT are given in the table 4. The experimental results show that the Gaussian kernel gives better performance when compared to other kernels. VI. Conclusion In this paper, we have examined the usage of the Gaussian kernel of Support Vector Machines (SVM) in recognition of Traffic sign for driver assistance. The performance of these models was investigated for recognition of Traffic sign. Morphological operations were used to detect and features are extracted by DCT, DWT and Hybrid DWT-DCT. And train the model to categorize the Traffic sign. Experimental results show that the Hybrid DWT-DCT gives better performance than others for Traffic sign recognition. This work indicates that SVM with Hybrid DWT-DCT can be effectively used for Traffic sign recognition to help drivers. Even though by now some progress has been achieved, there are still remaining challenges and directions for further research, such as, developing better recognition algorithms and integration of recognition to reduce both false positives and false negatives and achieves better recognition rate.
Figure 10. Performance chart for SVM (Precision, Recall(Sensitivity), Accuracy, Specificity, F Score.)
Model
Feature DCT
SVM
DWT Hybrid DWT-DCT
Recognition Rate(%) 86% 90% 96%
Table 4. Performance chart for SVM (Recognition Rate.)
ISSN : 0975-4024
Vol 6 No 2 Apr-May 2014
1156
S. Sathiya et al. / International Journal of Engineering and Technology (IJET)
Figure 11. Performance chart for SVM (Recognition Rate.)
VII. References [1] [2] [3] [4] [5] [6] [7] [8] [9] [10] [11] [12] [13] [14] [15] [16] [17] [18] [19]
Kemal Kaplan,2012. ”Real time traffic sign detection and classification method for intelligent vehicles”, July 24-27, IEEE International Conference on Vehicular Electronics and Safety. Long chen,2011. Traffic sign detection and recognition for intelligent vehicle”, IEEE Intelligent Vehicles Symposium. June 5-9, IEEE Intelligent Vehicles Symposium. Jun Young, 2012. ”A 92-mw real-time traffic sign recognition system with robust illumination adaptation and support vector machine”, Vol.47, No:11, IEEE Journal of solid-state circuits. A.Mogelmose, 2012. ”Traffic sign Detection and Analysis: Recent Studies and Emerging Trends”, Sep 16-19, 15th International IEEE Conference on Intelligent Transportation Systems. V.N.Manjunath Aadha, 2012. ”A Robust Multilingual Detection approach based on transvele entropy”, 4, 232-237, Elsevier-C3IT. Francisco Parada- Loira, 2010. ”‘Local Contour Patterns for Fast Traffic Sign Detection”, 21-24,2010 IEEE Intelligent Vehicles Symposium University of California, San Diego, CA, USA. Gao, X.W.,2006. Recognition of traffic signs based on their colour and shape Features extracted using human vision models. 17, 675685, Journal of Vision Communication and Image Representation. Gary Burnett, 2012. ”Designing touchpad user-interfaces for right-hand drive vehicles: an investigation into where the touchpad should be located”, 9, 874-887, Behaviour & Information Technology. Nikolaos Gkikas, 2012. The impact of verbal interaction on driver lateral control: An experimental assessment, 31, 605-616, Behaviour & Information Technology. Gary Burnetta, 2011. Designing touchpad user-interfaces for vehicles: which tasks are most suitable?. Vol 30,403-414, Behaviour & Information Technology. Loy.G, 2004.Fast shape-based road sign detection for a driver assistance system.7075, IROS. P. Paclik, 2000.Road sign classification without color information. ASIC, Lommel, Belgium. S. Maldonado-Bascon, 2008.Traffic sign recognition system for inventory purposes. pp. 590595, IEEE Intelligent Vehicles Symposium 2008, Eindhoven, Netherlands. M. Fifik,, 2010.Real Time Recognition System for Traffic Sign Detection and Classification. May 24-28, MIPRO. Jack Greenhalgh, 2012. Real-Time Detection and Recognition of Road Traffic Signs. VOL. 13, NO. 4, IEEE Transaction on Intelligent Transportation Systems. J.C.Burges Christopher, 1998. A tutorial on support vector machine for pattern recognition, 52,121-167. Suchitra Shrestha, 2010. Hybrid DWT-DCT Algorithm for Biomedical Image and Video Compression Applications, pp. 280-283, Proc. of the 10th IEEE International Conference on Information Sciences, Signal Processing and their Applications. Suchitra Shrestha, 2010. A sub-sample based hybrid DWT-DCT algorithm for medical imaging applications, Cyber Journals: Multidisciplinary Journals in Science and Technology. Saturnino Maldonado-Bascon, 2007. Road-Sign Detection and Recognition Based On Support Vector Machines, Vol 8, No.2, IEEE Transaction on Intelligent Transportation Systems.
ISSN : 0975-4024
Vol 6 No 2 Apr-May 2014
1157