Churrasco: Supporting Collaborative Software Evolution Analysis Marco D’Ambros a , Michele Lanza a a REVEAL
@ Faculty of Informatics - University of Lugano, Switzerland
Abstract Analyzing the evolution of large and long lived software systems is a complex problem which requires extensive tool support due to the sheer amount of data that needs to be processed. In this paper we present Churrasco, a tool to support collaborative software evolution analysis. After describing the tool and its architecture, we provide a usage scenario of Churrasco on a large open source software system. Key words: Software Evolution Analysis, Collaborative Analysis, Visualization
1. Introduction Software evolution analysis is concerned with the causes and the effects of software change. There is a large number of approaches, which all use different types of information about the history and the (evolving) structure of a system. The overall goal is on the one hand to perform retrospective analysis, useful for a number of maintenance activities, and on the other hand to predict the future evolution of a system. Such analyses are intrinsically complex, because modeling the evolution of complex systems implies (1) the retrieval of data from software repositories, such as CVS or SVN, (2) the parsing of the obtained raw data to extract relevant facts and to minimize the noise that such large data sets exhibit, and (3) the population of models that are then the basis for any analysis. Tools supporting software evolution analysis should hide these tasks from the users, in order to let them focus on the actual analysis. Moreover, such tools should provide means to break down the quantity and complexity of information, typical for large and long lived software systems. Email addresses:
[email protected] (Marco D’Ambros),
[email protected] (Michele Lanza).
1
We define the following requirements for software evolution analysis tools: – Meta-model flexibility. Several, and largely similar, approaches have been proposed to create and populate a model of an evolving software system, considering a variety of information sources, such as the histories of software artifacts (as recorded by a versioning system), the problem reports stored in repositories such as Bugzilla [9], e-mail archives, user documentation [2], etc. Even if these are comprehensive for modeling the evolution, they are “hard-coded” in the sense that their creators took deliberate design choices which were in accordance with their research goals. Software evolution tools should be flexible with respect to the underlying meta-model: If it is changed or extended, the tool should adapt itself to the new meta-model. – Tool accessibility. Researchers have developed a plethora of evolution analysis tools and environments. One commonality among many prototypes is their limited usability, i.e., often only the developers themselves know how to use them, which hinders the development and/or cross-fertilization of analysis techniques. There are some exceptions, such as Kenyon [1] or Moose [8], which have been used by a large number of researchers over the years. Researchers also investigated ways for exchanging information about software systems [11, 16], approaches which however are seldom followed up because of lack of time or manpower. Software evolution tools should be easily accessible. They should be usable from any machine running any operating system, without strings attached. – Modeling results. Results of analyses and findings on software systems produced by tools are written into files and/or manually crafted reports. Analysis results should be incrementally and consistently stored back into the analyzed models. This would allow (1) other kinds of analyses to benefit from the result of a previous analysis (crossfertilization of ideas/results), (2) the creation of a benchmark for analyses targeting the same problem, and (3) to combine techniques targeting different problems. – Support for collaboration. The need of collaboration in software development is getting more and more attention. Tools which support collaboration, such as Jazz for Eclipse [10], were only recently introduced, but hint at a larger trend that is taking place. Software evolution analysis is not different: It should be a collaborative activity, and therefore software evolution tools should support collaboration, by allowing different users to collaboratively analyze a system. We present Churrasco [4], a tool which fulfills these requirements. It hides all data retrieval and processing tasks from the users, to let them focus on the actual analysis. It provides an easily accessible interface over a web browser to model the data sources to be analyzed. It copes with modeling and populating problems by providing a flexible and extensible object-relational persistency mechanism. Any data meta-model can be dynamically changed and extended, and all the data is stored in a centralized database. Churrasco provides an extensible set of collaborative visual analyses and supports collaborative analysis by allowing users to annotate the analyzed data. Churrasco stores the findings into a central DB to create an incrementally enriched body of knowledge about a subject system, which can be exploited by subsequent users.
2
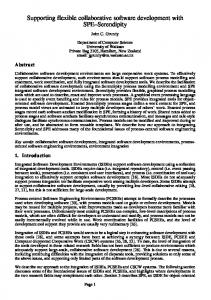
Churrasco Components
Target System
External Components
Bugzilla Repository
Source Code
1
Web Portal
4
SVN Repository
Importer
Visualizer
Extensible Evolutionary meta-model Versioning system meta-model
Defect meta-model
EMOF description
EMOF description
FAMIX meta-model
...
EMOF description
EMOF description
Database
Object relational mapping module
3
SVN
System Complexity
Bugzilla bugs & activities
Evolution Radar
SVN Module
Bugzilla Module
MOOSE Reengineering Environment
Annotation Module
2
6 Meta-base
Annotation meta-model
5
EMOF description
Visualization Module
(GLORP)
Fig. 1. The architecture of the Churrasco framework.
2. Churrasco and its Architecture Churrasco’s architecture (Figure 1) features the following internal components: (i) The Extensible Evolutionary meta-model describes the internal representation of software systems’ evolution, which can be extended using the facilities provided by the Meta-base module. (ii) The Meta-base supports flexible and dynamic object-relational persistency. It uses the external component GLORP, providing object-relational persistency, to read from/write to the database. The meta-base also uses the Moose reengineering environment [8] to create a representation of the source code (C++, Java or Smalltalk) based on the FAMIX language independent meta-model [7]. (iii) The Bugzilla and SVN modules retrieve and process the data from SVN and Bugzilla repositories. (iv) The Web portal represents the front-end of the framework accessible through a web browser. (v) The Visualization module supports software evolution analysis by creating and exporting interactive Scalable Vector Graphics 1 (SVG) visualizations. (vi) The Annotation module supports collaborative analysis by enriching any entity in the system with annotations. It communicates with the web visualizations to depict the annotations within the visualizations. 2.1. The Meta-base The Meta-base [6] is the core module of Churrasco, which provides flexibility and persistency to any meta-model in general, and to our evolution meta-model in particular. It takes as input a meta-model described in EMOF and outputs a descriptor, which defines the mapping between the object instances of the meta-model, i.e., the model, and tables in the database. EMOF (Essential Meta Object Facilities) is a subset of MOF 2 , a meta-meta-model used to describe meta-models. The Meta-base uses an implementation 1
http://www.w3.org/Graphics/SVG/ MOF and EMOF are standards defined by the OMG (Object Management Group) for Model Driven Engineering. For more details about MOF and EMOF consult the specifications at: http://www.omg.org/docs/html/06-01-01/Output/06-01-01.htm
2
3
of EMOF called Meta 3 . The Meta-base ensures persistency with the object-relational module GLORP [12] (Generic Lightweight Object-Relational Persistence). The Metabase provides flexibility by dynamically and automatically adapting to any provided meta-model, by generating descriptors of the mapping between the database and the meta-model. This allows the Churrasco users to dynamically both modify and extend the meta-model of the evolution of the system. To see an example of how to describe a meta-model and use the meta-base to generate the mapping descriptors, we refer the interested readers to [6].
2.2. The SVN and Bugzilla Modules The SVN and Bugzilla modules retrieve and process data from, respectively, Subversion and Bugzilla repositories. They take as input the URL of the repositories and then populate the models using the Meta-base. The modules are initially launched from the web importer (discussed later) to create the models, and then they automatically update all the models in the database every night, with the new information (new commits or bug reports). The SVN module populates the versioning system model, by checking out (or updating) the project with the given repository, creating and parsing SVN log files. The checked out system is then used to create the FAMIX model of the system with the external component Moose. The Bugzilla module retrieves and parses all the bug reports (in XML format) from the given repository. Then it populates the corresponding part of the defect model. It then retrieves all the bug activities from the given repository. Since Bugzilla does not provide this information in XML format, HTML-pages have to be parsed and the corresponding part of the model is populated. Finally, it links software artifacts with bug reports. To do this it combines the technique proposed in [9] (matching bug report ids and keywords in the commit comments) with a timestamp based approach. The algorithm starts by looking into bug activities and extracting the bug-fixing ones, i.e., activities in which the status changed to resolved, verified or closed. For this activities the algorithm takes the timestamp and the author and then it looks for a commit performed by the same author in a temporally close timestamp. The underlying idea is that the author fixes the bug, commits the changes and changes the bug report status to “fixed”. For the comparison between SVN and Bugzilla authors (two different accounts denoting the same person), we use a set of heuristics. The time required to import and process SubVersion and Bugzilla repositories mostly depends on the time needed to checkout the SVN repository and download the bug reports and activities. Checking out the entire ArgoUML SVN repository took about 20 minutes, while downloading the bug reports (and bug activities) took more than 5 hours 4 . Parsing and processing the data (SVN log files, bug reports and activities) took less than 10 minutes.
3
http://smallwiki.unibe.ch/moose/tools/meta/ Retrieving the bug activities is the bottleneck of the entire process, since we have to do a remote query per each activity we want to retrieve.
4
4
2.3. The Web Portal The web portal is the front-end interface provided by Churrasco. It allows users both to create the models, and to analyze them by means of two web-based visualizations.
(a) The importer page.
(b) The projects page. Fig. 2. The Churrasco Web Portal.
Figure 2(a) shows the importer web page of Churrasco, ready to import the gcc software system. All the information needed to create the model is the URL of the SVN repository and, if available, the URLs of the bugzilla repository (one for bug reports, one for bug activities). Since, depending on the size of the software system to be imported, this can take a long time, the user can also indicate the e-mail address to be notified when the importing is finished. Figure 2(b) shows the projects web page of Churrasco, which contains a list of projects available in the database, and for a selected project, information such as the number of files and commits, the time period (time between the first and last commit), the number of bugs etc. The page provides actions to the user, i.e., links to the visualizations and to the database contents. 5
Width metric
Height metric
Class A Color metric (greyscale) Inheritance relation Class B
(a) Evolution Radar.
(b) System Complexity.
Fig. 3. The principles of the Evolution Radar and System Complexity visualizations.
2.4. The Visualization Module The visualization module is responsible for creating interactive visualizations within the Churrasco web portal, to support the analysis of the evolution of a software system. At the moment there are two visualizations available: (i) The Evolution Radar [3, 5] supports software evolution analysis by depicting change coupling information both at the file and module level. Change coupling is the implicit dependency between two or more software artifacts that have been observed to frequently change together during the evolution of a system. Figure 3(a) shows the principle of the Evolution Radar. The visualization shows the dependencies between a module, represented as a circle and placed in the center of a pie chart, and all the other modules in the system represented as sectors of the pie chart. In each sector, all the files belonging to the corresponding module are represented as colored circles and positioned according to the change coupling they have with the module in the center (the higher the coupling the closer to the center). (ii) The System Complexity [13] supports the understanding of object-oriented systems, by enriching a simple 2D depiction of classes and inheritance relationships with software metrics (see Figure 3(b)). The size of the nodes is proportional to the number of attributes (width) and methods (height), while the color represents the number of lines of code. Both visualizations are created by the visualization module in two steps: (1) first the visualizations are generated by the Evolution Radar tool or by the Mondrian framework [14] (residing in Moose) and then (2) their web versions are created using the Episode framework [15] residing within Churrasco’s visualization module. To make the visualizations interactive within the web portal, Episode attaches callbacks to the figures. Figure 4 shows an example of a System Complexity visualization rendered in the Churrasco web portal. The part marked as “A” is the view where all the figures are rendered as SVG graphics. The figures are interactive: Clicking on one of them will highlight the figure, generate a context menu and show the figure details in the application control panel (marked as “B”). This panel, different from visualization to visualization, provides the control (on top) to apply, modify and interact with the visualization, and shows the information (at the bottom) about the selected figure (which entity it represents and the properties of the metrics used in the view). 6
B
A
C
Fig. 4. A screenshot of the Churrasco web portal.
2.5. The Annotation Module Churrasco’s annotation module supports collaborative analysis: The idea is that each model entity can be enriched with annotations, and these annotations can be used (1) to store findings and results incrementally into the model and (2) to let different users collaborate in the analysis of a system in parallel. Annotations can be attached to any model entity, and each entity can have several annotations. The annotation is composed of: The author who wrote it, the creation timestamp and the text. The part marked as “C” in Figure 4, called collaboration panel, shows how the annotations are used in the Churrasco web portal. The collaboration panel, which has the same structure in all the visualizations, is composed of three parts: The first one, on top, lists all the people who annotated the visualizations, i.e., people collaborating in the analysis. When one of these names is clicked, all the figures annotated by the corresponding person are highlighted in the view, to see on which part of the system that person is working on. The second part of the collaboration panel, in the middle, lists all the annotations of the selected figure, showing the author, the date and time and the text. The last part of the panel, at the very bottom, is used to create a new annotation to attach to the selected figure. Since the database behind Churrasco is centralized, when a new annotation is added it is immediately visible to all the people using the web visualization. This allows different users to simultaneously work on the same system and to collaborate in the analysis. 7
3. Churrasco in Action
6
8
7 5
Annotations
1 Model namespace (Marco's View)
Fig. 5. The web portal of Churrasco visualizing the system complexity of the Model namespace of ArgoUML.
We show Churrasco’s use through the following scenario: the authors of this article, working on different machines in different locations, study the evolution of ArgoUML (http://argouml.tigris.org/), a UML modeling tool, composed of ca. 1800 Java classes, developed over the course of ca. 7 years. The users first create the evolutionary model by indicating the URL of the ArgoUML SVN repository in the importer page of Churrasco (bug information is not needed in this example scenario). Once the model is created and stored in the centralized database, they start the analysis with a system complexity view of the system. Each user renders the visualization in his web browser, and attaches annotations to interesting figures in the visualization. The annotations are immediately visible to the other user on the left side of the browser window. While Michele is analyzing the entire system, Marco focuses (creating an ad-hoc view) on the Model namespace, which contains several classes characterized by large number of methods and many lines of code. The entities annotated by Marco in the fine-grained 8
Entire system (Michele's View)
2
3
2006 - 2007
4
2
(a) The system complexity view of the entire ArgoUML system.
(b) An Evolution Radar of ArgoUML, for the period 2006-2007.
Fig. 6. Two visualizations of the ArgoUML system rendered in the Churrasco web portal.
view are then visible to Michele in the coarse-grained system complexity. Marco has the advantage of a more focused view, while Michele can see the entire context. Figure 5 shows Marco’s web view, while Michele’s view is depicted on Figure 6(a) (only the view, without the entire web page). Marco selected the FacadeMDRImpl class (marked as 1), and is reading Michele’s comments about that class (marked as 2 in Michele’s view). In the meantime, Michele highlighted all the figures annotated by Marco (marked as 2, 3, 4). There are two examples of collaboration here: (i) Marco, focusing on the Model namespace, annotates that the class FacadeMDRImpl (marked as 1) shows symptoms of bad design: it has 350 methods, 3400 lines of code, only 3 attributes, and it is the only implementor of the Facade interface (marked as 5). Michele adds a second annotation that Marco’s observation holds also with respect to the entire system, and that FacadeMDRImpl (marked as 4) is the class with the highest number of methods in the entire system. (ii) Marco sees that several classes in the Factory hierarchy (marked as 6) implement the Factory interface and also inherit from the AbstractUmlModelFactoryMDR class (marked as 7) belonging to another hierarchy. This is not visible in Michele’s 9
view (where Factory is marked as 2 and AbstractUmlModelFactoryMDR as 3), who discovers that fact by highlighting the entities annotated by Marco and then reading the annotations.
B
2004 - 2005
A
Diagram module
C
1
Annotations
Fig. 7. The web portal of Churrasco visualizing an Evolution Radar of ArgoUML, for the period 2004-2005.
Both now want to find out whether these design problems have always been present in the system. They analyze the system history in terms of its change coupling using the Evolution Radar. This visualization is time-dependent, i.e., different radar views are used to represent different time intervals. Figure 7 shows an evolution radar visualization corresponding to the time interval October 2004 – October 2005, while Figure 6(b) shows the radar corresponding to October 2006 – October 2007. They both represent the dependencies of the Diagram module (in the center) with all the other modules in ArgoUML, by rendering individual classes. Marco is looking at the time interval 2004/05 (figreffig:argoRadar). He selects the class UMLFactoryImpl (marked as 1), belonging to the Model module, because it is close to the center (high coupling with the Diagram module in the center) and because it is large (the size maps the number of commits in the corresponding time interval). Marco attaches to the class the annotation that it is potentially harmful, given the high coupling with a different module. In the meantime Michele is looking at the time interval 2006/07 (Figure 6(b)). He highlights the classes 10
annotated by Marco and sees the UMLFactoryImpl class. In Michele’s radar the class is not coupled at all with the Diagram module, i.e., it is at the boundary of the view (marked as 2). Therefore, Michele adds an annotation to the class saying that it is probably not harmful, since the coupling decreased over time. After reading this comment, Marco goes back to the system complexity view, to see the structural properties of the class in the system. The UMLFactoryImpl class (marked as 8 in Figure 5) has 22 methods, 9 attributes and 600 LOC. It implements the interfaces AbstractUmlModelFactoryMDR and UMLFactory. After seeing the class in the system complexity, Marco adds another annotation in the radar saying that the class is not harmful after all. This information can then be used by other users in the future. Suppose that Romain wants to join the analysis with Marco and Michele, or to start from their results. He can first see on which entities the previous users worked, by highlighting them, and then reading the corresponding annotations to get the previously acquired knowledge about the system. This simple scenario shows how (1) the knowledge about a system, gained in software evolution analysis activities, can be incrementally built, (2) different users from different locations can collaborate, and (3) different visualization techniques can be combined to improve the analysis. 4. Conclusions We have presented Churrasco, a tool which supports collaborative software evolution analysis and visualization. The main features of Churrasco are: – Flexible meta-model support. The meta-model used in Churrasco to describe the evolution of a software system can be dynamically changed and/or extended, by means of the meta-base component. – Accessibility. The tool is fully web-based, i.e., the entire analysis of a software system, from the initial model creation to the final study, can be performed from a web browser, without having to install or configure any tool. – Modeling of results. Churrasco relies on a centralized database and supports annotations. Thus, the knowledge of the system, gained during the analysis, can be incrementally stored on the model of the system itself. – Collaboration. We have shown, through a simple, but real, scenario, how Churrasco supports collaborative software evolution analysis. Acknowledgments. We gratefully acknowledge the financial support of the Swiss National Science foundation for the project “DiCoSA” (SNF Project No. 118063).
References [1] J. Bevan, J. E. James Whitehead, S. Kim, M. Godfrey, Facilitating software evolution research with kenyon, in: Proceedings of ESEC/FSE 2005, ACM, 2005. [2] D. Cubranic, G. Murphy, Hipikat: Recommending pertinent software development artifacts, in: Proceedings 25th International Conference on Software Engineering (ICSE 2003), ACM Press, New York NY, 2003. [3] M. D’Ambros, M. Lanza, Reverse engineering with logical coupling, in: Proceedings of WCRE 2006 (13th Working Conference on Reverse Engineering), IEEE CS Press, 2006.
11
[4] M. D’Ambros, M. Lanza, A flexible framework to support collaborative software evolution analysis, in: Proceedings of CSMR 2008 (12th IEEE European Conference on Software Maintenance and Reengineering), IEEE CS Press, 2008. [5] M. D’Ambros, M. Lanza, M. Lungu, The evolution radar: Visualizing integrated logical coupling information, in: Proceedings of MSR 2006 (3rd International Workshop on Mining Software Repositories), 2006. [6] M. D’Ambros, M. Lanza, M. Pinzger, The metabase: Generating object persistency using meta descriptions, in: Proceedings of FAMOOSR 2007 (1st Workshop on FAMIX and Moose in Reengineering), 2007. [7] S. Demeyer, S. Tichelaar, S. Ducasse, FAMIX 2.1 — The FAMOOS Information Exchange Model, Tech. rep., University of Bern (2001). [8] S. Ducasse, T. Gˆırba, O. Nierstrasz, Moose: an agile reengineering environment, in: Proceedings of ESEC/FSE 2005, 2005, tool demo. URL http://www.iam.unibe.ch/~scg/Archive/Papers/Duca05fMooseDemo.pdf [9] M. Fischer, M. Pinzger, H. Gall, Populating a release history database from version control and bug tracking systems, in: Proceedings International Conference on Software Maintenance (ICSM 2003), IEEE Computer Society Press, Los Alamitos CA, 2003. [10] R. Frost, Jazz and the eclipse way of collaboration, IEEE Software 24 (6) (2007) 114–117. [11] S. Kim, T. Zimmermann, M. Kim, A. Hassan, A. Mockus, T. Gˆırba, M. Pinzger, J. Whitehead, A. Zeller, TA-RE: An exchange language for mining software repositories, in: Proceedings Workshop on Mining Software Repositories (MSR 2006), 2006. URL http://www.iam.unibe.ch/~scg/Archive/Papers/Kim06aTARE.pdf [12] A. Knight, Glorp: generic lightweight object-relational persistence, in: Proceeding of OOPSLA 2000 (Addendum), ACM Press, 2000. [13] M. Lanza, S. Ducasse, Polymetric views—a lightweight visual approach to reverse engineering, Transactions on Software Engineering (TSE) 29 (9) (2003) 782–795. URL http://www.iam.unibe.ch/~scg/Archive/Papers/Lanz03dTSEPolymetric.pdf [14] M. Meyer, T. Gˆırba, M. Lungu, Mondrian: An agile visualization framework, in: ACM Symposium on Software Visualization (SoftVis 2006), ACM Press, New York, NY, USA, 2006. URL http://www.iam.unibe.ch/~scg/Archive/Papers/Meye06aMondrian.pdf [15] M. Primi, The episode framework - exporting visualization tools to the web, Bachelor’s thesis, University of Lugano (Jun. 2007). [16] S. Tichelaar, S. Ducasse, S. Demeyer, FAMIX: Exchange experiences with CDIF and XMI, in: Proceedings of the ICSE 2000 Workshop on Standard Exchange Format (WoSEF 2000), 2000. URL http://www.iam.unibe.ch/~scg/Archive/Papers/Tich00mFamixCdifXmi.pdf
12