Visualizing Multiple Evolution Metrics Martin Pinzger, Harald Gall∗ Department of Informatics Univ. of Zurich, Switzerland
Michael Fischer† Distributed Systems Group TU Vienna, Austria
Abstract
1998]. However, often the visualizations themselves are hard to interpret, and in the case of evolutionary data, they often succeed in obscuring the relevant information.
Observing the evolution of very large software systems needs the analysis of large complex data models and visualization of condensed views on the system. For visualization software metrics have been used to compute such condensed views. However, current techniques concentrate on visualizing data of one particular release providing only insufficient support for visualizing data of several releases. In this paper we present the RelVis visualization approach that concentrates on providing integrated condensed graphical views on source code and release history data of up to n releases. Measures of metrics of source code entities and relationships are composed in Kiviat diagrams as annual rings. Diagrams highlight the good and bad times of an entity and facilitate the identification of entities and relationships with critical trends. They represent potential refactoring candidates that should be addressed first before further evolving the system. The paper provides needed background information and evaluation of the approach with a large open source software project.
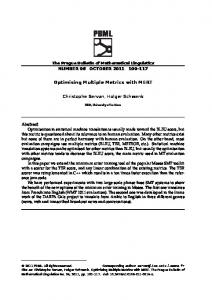
Figure 1: A comparison of 7 Mozilla modules between release 0.92 (on the left) and release 1.7 (on the right).
Keywords: software evolution analysis, evolution metrics, software visualization, Kiviat
1
Michele Lanza‡ Faculty of Informatics Univ. of Lugano, Switzerland
For example, in Figure 1 we see a polymetric visualization [Lanza and Ducasse 2003] of 7 Mozilla modules of two versions (0.92 on the left, 1.7 on the right) of Mozilla. The nodes represent modules with the number of contained classes for the width, number of contained files for the height, and number of contained directories for the color. The edges represent abstracted invocation relationships between the modules (the width of the edges represents the weight, i.e., the number of grouped relationships). By using this visualization technique we gather that nodes (i.e., modules) differ in size and that the nodes of both graphs are basically connected with nearly every other node. But, comparing the two graphs is not straight forward and differences are difficult to spot. Thinking of larger graphs and n releases spotting the differences and trends of node and arc metrics is even more complex if not impossible. The problem of the polymetric visualization technique used in Figure 1 is in comparing the two slightly different graphs. It results from having at least one graph per release. Consequently, polymetric visualization is suitable for visualizing the information (structure and metrics) of one release but not for visualizing the information of n releases. In this paper we concentrate on the latter issue and introduce our RelVis approach. The objective of RelVis is to visualize the evolution of source code entity and relationship metrics across n releases. For this RelVis condenses the information from n releases into two graphs. The first graph concentrates on visualizing information about source code entities and their metrics. The focus of the second graph is on visualizing relationships between source code entities and their metrics. Evolution of metrics of both source code entities and their relationships is visualized as annual rings, such as of trees showing the good and bad times of an entity. With these rings the spectator can follow the trend of metrics and reason about the current state of source code entities and relationships and how it came to this state. Altogether, the two graphs provide a compact view on the evolution of source code entities and their relationships. They facilitate reasoning about past behavior and anticipating future direc-
Introduction
Observing the evolution of large object-oriented software systems is challenging because of the sheer size of the systems, and because the data that must be analyzed is multiplied by the number of releases under examination. Two of the most promising techniques to perform fruitful analyses and to tackle scalability problems are software metrics and visualization. Software metrics do not pose scalability problems, but usually come in huge tables that are difficult to grasp important information. Moreover, it is all too easy to invent new metrics whose usability is questionable and whose definition is also sometimes fuzzy, such as the infamous lines of code (LOC) metric. On the other side, metrics provide condensed information of underlying source code data, such as the complexity metrics introduced by McCabe and Halstead. This condensed information allows users to get a clue of the complexity of an implementation without having to dig into the source code. Visualization has been accepted as a useful means to understand complex data, because visual displays allow the human brain to study multiple aspects of complex problems in parallel [Stasko et al. ∗ {pinzger,gall}@ifi.unizh.ch
†
[email protected] ‡
[email protected]
Copyright © 2005 by the Association for Computing Machinery, Inc. Permission to make digital or hard copies of part or all of this work for personal or classroom use is granted without fee provided that copies are not made or distributed for commercial advantage and that copies bear this notice and the full citation on the first page. Copyrights for components of this work owned by others than ACM must be honored. Abstracting with credit is permitted. To copy otherwise, to republish, to post on servers, or to redistribute to lists, requires prior specific permission and/or a fee. Request permissions from Permissions Dept, ACM Inc., fax +1 (212) 869-0481 or e-mail
[email protected]. © 2005 ACM 1-59593-073-6/05/0005 $5.00
67
Metrics. Metrics are a way to assess the quality and complexity of software [Fenton and Pfleeger 1996]. In combination with visualization it has become a traditional technique used to deal with the problem of analyzing the history of software systems. Lehmann used metrics starting from the 1970’s to analyze the evolution of the IBM OS/360 system. Lehmann, Perry and Ramil explored the implication of the evolution metrics on software maintenance [Lehman et al. 1998]. They used the number of modules to describe the size of a version and defined evolutionary measurements which take into account differences between consecutive versions. Gall et al. also employed the same kind of metrics while analyzing the continuous evolution of the software systems [Gall et al. 1998]. They analyzed the history of changes in software systems to detect the hidden dependencies (i.e., logical couplings) between modules. However, their analysis was focused on release history data but did not take into account source code. Burd and Munro analyzed the influence of changes on the maintainability of software systems. They define a set of measurements to quantify the dominance relations which are used to depict the complexity of the calls [Burd and Munro 1999].
tions (i.e. trends). Critical trends, such as steadily increasing coupling dependencies or increasing complexity of source code entities and coupling dependencies are pointed out. They represent potential refactoring candidates that should be addressed before further evolving the system. The remainder of the paper is structured as follows: In the next section we present related work. Section 3 describes the data that is preprocessed and subject of visualization. The RelVis approach is presented in Section 4. In Section 5 we demonstrate the application of RelVis to huge amounts of source code and release history data obtained from a well known open source web browser. In Section 6 we draw the conclusions and indicate future work.
2
Related Work
Software Visualization. Graphical representations of software have long been accepted as comprehension aids. Many tools enable the user to visualize software using static information, e.g., Rigi [M¨uller 1986], Hy+ [Consens and Mendelzon 1993], SeeSoft [Eick et al. 1992], and ShrimpViews [Storey and Mu¨ ller 1995]. The Affinity Browser described in [Pintado 1995] provides a visual representation of object relationships in terms of dependencies. Chuah and Eick present a way to visualize project information through glyphs called infobugs. Glyphs are graphical objects representing data through visual parameters. Their infobug glyph’s parts represent data about software [Chuah and Eick 1998]. The difference with our work is that they use glyphs for viewing project management data, while our work focuses on describing how a module evolves over time. The main advantage of the infobugs is that they are rotation-independent, while the order of the axes of our Kiviatdiagrams is relevant. Lanza’s Evolution Matrix based on polymetric views [Lanza and Ducasse 2003] visualizes the system’s history in a matrix in which each row is the history of a class. A cell in the Evolution Matrix represents a class and the dimensions of the cell are given by evolutionary measurements computed on subsequent versions. Girba et al. used the notion of history to analyze how changes appear in the software systems [Gˆırba et al. 2004] and succeeded in visualizing the histories of evolving class hierarchies. Taylor and Munro [Taylor and Munro 2002] visualized CVS data with a technique called revision towers. Ball and Eick [Ball and Eick 1996] developed visualizations for showing changes that appear in the source code. These approaches reside at a different granularity level, i.e., files, and thus do not display higher-level implementation units as in our approach. Gulla [Gulla 1992] proposes multiple visualizations of C code, but to our knowledge there is no implementation. Collberg et al. used graph-based visualizations to display the changes authors make to class hierarchies [Collberg et al. 2003]. However, they do not give any representation of the dimension of the effort and of the removals of entities. Riva et al. analyzed the stability of the architecture [Gall et al. 1999] by using colors to depict the changes over a period of releases. Rysselberghe and Demeyer used a simple visualization based on information in version control systems to provide an overview of the evolution of systems [Van Rysselberghe and Demeyer 2004]. Similar to [Gall et al. 1999], Wu et al. describe an Evolution Spectrograph [Wu et al. 2004] that visualizes a historical sequence of software releases. Grosser, Sahraoui and Valtchev applied Case-Based Reasoning on the history of object-oriented system as a solution to a complementary problem to ours: to predict the preservation of the class interfaces [Grosser et al. 2002]. They also considered the interfaces of a class to be the relevant indicator of the stability of a class.
3
Evolution Data
The visualization technique to use strongly depends on the data to be visualized and on the information that should be communicated to the user. In the context of this paper the data to be visualized stems from source code and configuration management systems, in particular the concurrent versions system (CVS) [Fre 2003]. Parsing techniques are applied to selected source code releases to retrieve a source code model per release. They contain the implementation relevant facts comprising the principal source code entities (e.g., files, classes, methods, etc.) and the relationships between them (e.g., class inheritance, method calls, etc.). Data from the configuration management system is obtained by applying our release history populator tool set. Extracted release history data adds information about modifications to parsed source code entities, basically, who changed which file when. Based on this information the logical coupling dependencies between source files are computed as described in [Fischer et al. 2003]. They indicate pairwise changes of source files and are key relationships for software evolution analysis as demonstrated by our previous and related work. Logical coupling data per release is integrated into the corresponding extracted source code model to have one common evolution data repository [Pinzger et al. 2004]. Graph-like representations turned out to be adequate for visualizing this kind of data. Extracted models of source code and release history data can be directly mapped to graphs. For instance, nodes of graphs represent source code entities, such as files, classes, and methods. Edges represent relationships between these entities, such as file includes, class inheritance, method calls, or logical couplings between modules. Nodes and edges can have several attributes that result from source code and release history data extraction and analysis. Attributes range from the name of a source code entity to metrics computed for it. Metrics are of particular interest because they are measures providing implementation and evolution relevant quality indicators. With respect to evolution analysis the information that we want to communicate to the user (e.g., software architect), is the evolution of metrics of source code entities and their coupling dependencies. Basically, it should communicate trends, such as, the growth of classes or the increasing / decreasing of coupling dependencies between two classes. Spotting these trends the software architect gets a thorough understanding of the current state of a source code entity and its dependencies on other entities. Based on this data,
68
Metric nrDirectories(e) nrFiles(e) nrClasses(e) nrFuncs(e) nrVars(e) nrCouples(e) nrMRs(e) entropy(e) nrACouples(e) in nrCallers(e) in nrCalls(e) in nrACalls(e) out nrCallers(e) out nrCalls(e) out nrACalls(e)
Type M M F,M F,M F,M F,M F,M F,M F,M F,M F,M F,M F,M F,M F,M
Description # of directories contained by module e # of files contained by module e # of classes declared in e # of functions/methods implemented in e # of global variables and attributes declared in e # of logical coupling relationships of e with other entities # of modification reports involved in the logical coupling relationships entropy of modification reports computed based on lines added and deleted # of abstracted logical coupling relationships # of functions/methods of other entities invoking functions/methods of entity e # of in-coming function/method calls # of abstracted in-coming call relationships # of functions/methods of entity e invoking functions/methods of other entities # of out-going function/method calls # of abstracted out-going call relationships
Table 1: Excerpt of module (M) and source file (F) metrics. Metric nrCallers nrCallee nrCalls nrAccessors nrAccessed nrAccesses
Type invokes invokes invokes accesses accesses accesses
Description # of functions/methods of entity A invoking functions/methods of entity B # of functions/methods of entity B invoked by functions/methods of entity A (=fanOut) # of function/method calls between entity A and entity B # of functions/methods of entity A accessing an attribute/variable of entity B # of attributes/variables of entity B accessed by functions/methods of entity A # of accesses of attribute/variable of entity B by functions/methods of entity A
Table 2: Excerpt of coupling metrics of relationships between source code entities (e.g., modules, files). critical trends are highlighted and shown to the architect who then can focus perfective maintenance activities on these entities. The metric values for each source code entity and relationship are obtained from the integrated source code and release history model. In this paper we concentrate on software modules, source files, their coupling relationships and metrics on them. A software module is an architecture element that stems from decomposing a system into manageable implementation units. In the context of this paper it is denoted as a set of source files that implement a coherent set of functionality which it provides to other modules over its interface(s). An excerpt of metrics computed for software modules and source files is shown by Table 1. Table 2 lists relevant metrics of source code and release history relationships. Listed metrics correspond to the metrics (measurements) presented in related coupling research articles, such as by Briand [Briand et al. 1999]. Measures of metrics of each entity and relationship are assigned to a feature vector which is an i-dimensional tuple M = {m1 , m2 , ..., mi }. To communicate the evolution of entity and relationship metrics feature vectors have to be tracked over n releases. The release number is added to the feature vector leading to M n = {mn1 , mn2 , ..., mni }. Based on these vectors the evolution of an entity or relationship is expressed by the following evolution matrix E that contains n vectors with measures of i metrics:
Ei×n =
m01 m02 . . m0i
m001 m002 . . m00i
.. .. ... ... ..
mn1 mn2 . . mni
1. Visualization of i metrics per entity. There are different metrics for each entity that have to be presented in a meaningful way. Dependencies between metrics should be visualized. 2. Visualization of metrics across n releases. The dimension of time in terms of release dates has to be considered to show metric trends. For instance, it should be observable without having the user to compare n graphs. Taking into account these constraints we came up with the RelVis visualization approach described in the next section.
4
RelVis Approach
A basic principle of the RelVis approach is the mapping of metrics to graphical attributes. A recent approach that concentrated on such a mapping is the polymetric views introduced by Lanza et al. in [Lanza and Ducasse 2003]. In these views nodes are represented as rectangles whereas the width, height and color attribute of a rectangle are used to present source code metrics of an entity. Using rectangles up to 3 metrics of an entity can be represented. Additionally, two metrics can be mapped to the x- and y-position of a rectangle. The RelVis approach is based on this principle of mapping metrics to graphical attributes. Instead of using graphical shapes limited in the number of representable metrics RelVis uses Kiviat diagrams. These diagrams are suited to present multivariate data such as the feature vectors extracted from several releases of source code and release history data. For similar purpose (visualizing source code metrics) Kiviat diagrams have also been used by related visualization approaches and tools. Figure 2 shows an example of a Kiviat diagram representing measures of six metrics of the entity moduleA. Each of the six metrics M1, M2, ..., M6 is drawn as a straight line originating in 0 0 0 the center of the diagram. The value of each metric m1 , m2 ..., m6
Evolution matrices are computed for selected source code entities and relationships. They form the basic input to our visualization approach. Consequently, the amount of data to be visualized directly corresponds to the data contained by the matrices of each entity and relationship. The following basic constraints arise:
69
RelVis handles this problem in two ways. One way is to encode the time order of releases by using different colors per release for drawing the lines of polygons. A second solution is to encode the sequence of releases into a metric. For instance, the release number or the number of changes made to a source code entity (nrMRs) can be used. Values of both metrics indicate the chronological order of releases. Based on such metrics increasing or decreasing of other depicted metric values can be determined. The evolution of metrics can be further highlighted by filling the polygons emerged between two subsequent releases and adjacent metrics with different colors. Using appropriate color gradients, such as the rainbow colors, the order of releases is made transparent and strong changes in metric values are highlighted. Strong changes in metric values are further pointed out by putting metrics belonging together side by side. Resulting sectors contain metrics that quantify certain aspects of the implementation or evolution respectively and their trends. For example, by grouping metrics that quantify in-coming and out-going uses relationships in two separate sectors of the diagram users can categorize modules into service providers and service consumers or both. However, when filling the polygons with different colors the order of releases have to be encoded in the diagram. Otherwise, the number of colors used in the diagram explodes (i.e., when visualizing a high number of releases) which lowers comprehensibility of computed Kiviat diagrams.
is plotted on its corresponding line. Dependencies between adjacent metrics are indicated by lines drawn between adjacent metric values. Arranging metrics in a certain way results in recurring diagram-patterns that indicate critical source code entities such as god classes. With Kiviat diagrams users quickly can spot these interesting entities. M3
M2 m’ 2
MAX
m’ 3 M4
m’ 4
m’ 1
MIN
m’ 5
M1
m’ 6
moduleA M5
M6
Figure 2: Basic Kiviat diagram with measures of 6 metrics M1, M2, ...., M6 of moduleA. The example depicted by Figure 2 demonstrates the usefulness of Kiviat diagrams for visualizing metrics data. Certain requirements have to be met to prevent diagrams to become cluttered with information: 1) normalization of metric values to a maximal drawing length to prevent over-sized Kiviat diagrams; 2) using a minima (i.e., an offset) that is added to computed values to prevent information cluttering in the center of Kiviat diagrams. Computed metric values are drawn with respect to these minimum and maximum drawing range. We will see later on that the limitation in size is necessary to link Kiviat diagrams to Kiviat graphs.
4.1
M3
M2
M4
Visualizing n Releases
release 1−2 release 2−3
M1
moduleA
As stated in Section 3 the objective is to communicate the evolution of metrics of source code entities and their relationships. Kiviat diagrams as shown and described above are suitable to visualize i metrics of an entity at a time but how can we visualize data of n releases? The two principles that allow RelVis to visualize data of several releases are (1) normalizing metric values to the range determined by the minimum and maximum of each metric and (2) using a metric to encode the time-order of releases. Reconsidering the evolution matrix RelVis computes the maxima of each metric for each source code entity type across the n releases. 0 00 MAX(Mi ) = max(mi , mi , ..., mni )
M5
M6
Figure 3: Kiviat diagram with 6 metrics M1, M2, ..., M6 of 3 releases of moduleA. M1 indicates the chronological order of releases. Figure 3 depicts an example of visualizing six metrics of moduleA of three releases 1, 2, and 3. In this example M1 presents the “number of changes” (nrMRs) metric specifying the chronological order of releases. Consequently, metric M2 is decreasing whereas the values of remaining metrics increase from release 1 to release 2. From release 2 to 3 the values of metric M2, M3, and M6 increase whereas M4 and M5 decrease.
The minima of each metric can be considered 0. The effective drawing length of each measure is computed by normalizing the value by its maximum and adding an offset to it.
4.2
mni ∗ c length(mni ) = o f f set + MAX(Mi )
Kiviat Graphs
As described above we use a Kiviat diagram per source code entity to present measures of multiple metrics and their changes across several releases. Although the diagrams provide quantitative measures they do not explicitly show the dependency relationships between source code entities. Therefore, RelVis links diagrams to Kiviat graphs in which nodes represent source code entities and edges the relationships between them. Figure 4 depicts an example of a Kiviat graph with two modules. Relationships between diagrams are drawn as filled rectangles. To keep graphs understandable, relationships are drawn in the background with a smooth color with low contrast. With this technique one type of relationship at a time (e.g. logical coupling) can be visualized. RelVis supports the mapping of up to 3 relationship metrics
The constant c specifies the maximum drawing size and together with the o f f set constant is used to control the size of Kiviat diagrams. These constants can be configured by the user. The different values computed for a metric across n releases are plotted in the diagram and adjacent measures of metrics of the same release are connected. The result is a diagram that per release shows a polygon. Since values can also decrease from release to release, the edges forming the polygons may overlap, obscuring information. For instance, the information if a value of a metric increases or decreases from release to release is not always clear.
70
M3
M2
M3
release 1−2 release 2−3 M2
M1 M4
M4
M6
M5
M3
M2
M4
M6
M5
Figure 4: Kiviat graph with 6 metrics M1, M2, ..., M6 of 3 releases of moduleA and moduleB. The edge denotes the coupling relationship between the two modules.
moduleA
M1
moduleB
Figure 5: Kiviat graph with metrics M1, M2, ..., M5 of 3 releases of the coupling dependency of moduleA with moduleB (diagram on the right) and vice versa (diagram on the left).
to graph edges using the polymetric view concept. For instance, in Figure 4 the two metrics nrCalls and nrCallee are mapped to the length and width of the edge between moduleA and moduleB. Graph layout problems are prevented by using normalized Kiviat diagrams: RelVis facilitates the application of standard layout algorithms such as hierarchical or spring layout. However, as with other graph visualization techniques problems may occur when using over-sized labels that overlap.
4.3
M4
M3
moduleB
M5
M5
M2
M1
moduleA
M1
release 1−2 release 2−3
out of Kiviat diagrams gets complex and needs post-processing by the user or pre-filtering of relationships. For instance, filtering of relationships by type or by using thresholds for certain coupling metrics.
Multiple Relationship Metrics
5
Edges in a graph explicitly visualize the relationships between source code entities. For instance, they indicate the coupling dependencies. In addition to source code entities visualizing the trend of relationships is beneficial. For instance, to find out the constantly increasing coupling relationships between pairs of software modules. For this view on relationships RelVis computes a second graph that presents multiple metrics of relationships with Kiviat diagrams. Visualizing metrics of relationships adds a number of constraints that have to be taken into account: (1) relationships can be directed and undirected, (2) different types of relationships, and (3) graphs are highly connected. For each relationship between source code entities RelVis draws a straight line indicating a coupling between two entities. The direction of relationships is indicated by the Kiviat half-diagrams that are assigned to it. Each half-diagram indicates its direction by arranging the metrics on the right or left side of the diagram and ordering them bottom-up or top-down. Figure 5 depicts an example of visualizing metrics of the coupling dependency between moduleA and moduleB of 3 releases with Kiviat diagrams. The diagram on the right side with metrics M1, M2, ..., M5 ordered bottom-up depicts the relationships from moduleA to moduleB including, for instance, the number of methods of moduleA that call methods of moduleB (nrCallers) and the number of calls (nrCalls). The second diagram depicts the same metrics of relationships in the other direction from moduleB to moduleA. The two Kiviat diagrams are linked to an edge that indicates the dependency between two modules. The edge itself is drawn as a rectangle and can be used to visualize up to three metrics (size, width and color) that characterize the overall strength of the coupling between two source code entities. Trends of specific relationship metrics are visualized in Kiviat diagrams. They show selected metrics of other relationships without having to draw extra edges between node pairs. This meets the second constraint of visualizing different types of relationships and also aids in meeting the third constraint. When visualizing large graphs with a high number of dependency relationships, the lay-
Evaluation
We demonstrate the RelVis approach by applying it to the source code and release history data of the open source project Mozilla 1 . In particular, the data to be visualized is of seven software modules that implement services for handling the content of web-pages and layout it in the Mozilla web browser. In this context software modules are implementation units that consist of a number of source files implementing a coherent piece of functionality. The objective of the visualization is to highlight interesting and critical trends of software modules and coupling relationships. Concerning coupling relationships and metrics we concentrated on logical couplings derived from release history data and static method invocations. Metrics computed correspond to those listed in Table 1 and Table 2.
5.1
Evolution Data
Extracted source code models comprise seven releases of the selected modules starting from release 0.92 (29th of June, 2001) up to release 1.7 (17th of June, 2004). Selected releases denote major milestones in the Mozilla project with a time delta of about half a year. Release history data comprises all modification report data obtained from the Mozilla source code repository up to release 1.7. The latter data was used to compute the logical coupling relationships between the source files of selected modules [Fischer et al. 2003]. Computed relationships were integrated with the source code models of corresponding Mozilla releases [Pinzger et al. 2004]. Based on the integrated models the metrics for the seven software modules and their relationships were computed and stored on a per release basis. Models together with metrics were then input to the visualization algorithm. 1 http://www.mozilla.org
71
Nr. 1 2 3 4 5 6 7 8 9 10 11 12 13 14 15 16 17 18 19 20
Metric nrACouples entropy nrMRs nrCouples in nrACalls in nrCallers in nrCalls nrAttrs nrClasses nrDirs nrFiles nrFuncs nrGlobalFuncs nrGlobalVars nrMeths nrPackages nrVars out nrACalls out nrCallers out nrCalls
0.97 12 165695 45600 25809 6 972 1307 988 476 45 405 10275 880 227 9395 0 1215 3 597 1631
0.92 6 115738 30046 15286 6 886 1256 906 459 44 397 10135 333 219 9802 0 1125 4 566 1339
1.0 18 189391 58060 34073 6 769 1116 1118 528 50 443 10634 288 234 10346 0 1352 3 575 1640
1.2 24 212873 67631 41112 6 772 1109 1236 566 50 464 11148 325 262 10823 0 1498 3 575 1657
1.4 30 247570 83344 53573 6 768 1099 1292 595 50 477 11445 341 250 11104 0 1542 4 623 1761
1.6 36 318324 106523 67170 6 859 1459 1316 607 50 485 11464 334 237 11130 0 1553 4 638 1808
1.7 42 337721 113253 71901 6 835 1560 1293 609 49 492 11398 330 229 11068 0 1522 3 429 1309
Table 3: Measures of source code and evolution metrics of 7 releases of Mozilla’s DOM module. 6 in_nrCallers 7 in_nrCalls
The Kiviat diagram depicting the DOM module metrics reflects the importance of the module and its central role in the Mozilla project. The logical coupling metrics, the uses metrics, as well as the size metrics clearly indicate a large, frequently used and strong coupled software module. Table 3 lists the detailed measures presented by the diagram of Figure 6. Logical couplings visualized by metrics 1 to 4 constantly increased over all seven releases by an average of more than 13.800 modification reports. Size metrics visualized on the left (8 to 17) almost all increased showing that the DOM module constantly grew, especially from release 0.97 to 1.0. Interesting is the number of global functions that dramatically increased from release 0.92 to 0.97 (+547 functions), but in the next release 1.0 decreased (-592 functions) and then is constant (see also Table 3 metric number 13). Concerning the uses-dependencies the number of in-coming method calls increased from release 0.92 to the last release 1.7 with an interesting peak from release 1.4 to 1.6 (+360 calls). The outgoing method calls constantly increased up to release 1.6 but then from release 1.6 to 1.7 decreased extremely (-499 calls). Apparently, programmers resolved a reasonable amount (-28%) of the coupling by method calls. Based on the analysis of the DOM module we investigated the Kiviat graph of Figure 7. The layout as well as the width of edges indicate the strength of logical coupling dependencies between the 7 Mozilla modules. The modules that were changed together most frequently are located near the center of the graph (i.e., DOM, NewLayoutEngine, and XPToolkit). Kiviat diagrams of these modules further point out their strong coupling and provide more detailed measures on it. For instance, although the size of the NewLayoutEngine module remains stable the number of logical couplings constantly increased. Apparently, there are almost no advances in reducing the coupling of this module. The remaining modules MathML, XML, XSLT , and NewHT MLStyleSystem are positioned around the three central modules. Diagrams of the first three modules show minor changes across releases hence indicate stable modules. In contrast, the diagram of the latter module contains two interesting hot-spots that are pointed out. The rirst hot-spot is through the number of in-coming calls that from release 1.6 to release 1.7 increased by more than 23%. Another hot-spot arises from the number of global functions that doubled from release 0.92 to 0.97, then decreased and finally remained constant.
5 in_nrACalls
8 nrAttrs
4 nrCouples
3 nrMRs
9 nrClasses
10 nrDirs
2 entropy
11 nrFiles
1 nrACouples
12 nrFuncs
20 out_nrCalls
13 nrGlobalFuncs
19 out_nrCallers
14 nrGlobalVars
18 out_nrACalls 15 nrMeths 16 nrPackages
17 nrVars
DOM
Figure 6: Kiviat diagram with 20 source code and evolution metrics of 7 subsequent releases of Mozilla’s DOM module.
5.2
Kiviat Graph - Modules
The graph showing the Kiviat diagrams of module specific metrics is depicted by Figure 7. Each diagram visualizes measures of 20 metrics across 7 releases. Layout of the diagrams and the relationships between them show the logical coupling dependencies between modules. For describing the details of the information shown we picked out the diagram for the (document object model) DOM module (located in the center of the graph). The DOM module provides functionality for storing and manipulating (e.g. JavaScript) the content of web-pages. The diagram is shown by Figure 6. The arrangement of metrics is as follows: metrics 1 to 4 characterize the logical coupling with other modules; metrics 5 to 7 are concerned with incoming method calls and quantify the uses of the module by other modules; metrics 8 to 17 indicate the size of the module in terms of contained source code entities; the remaining 3 metrics 18 to 20 denote outgoing method calls indicating the uses of other modules by DOM.
72
6
7
5 4
8
3
9
2
10
11
1
12 6
7
20
5
8
13
4
9
6
7
10
2
11
19
14
3
18 15
5
8
9
1
3
10
12
17
16
XPToolkit
4
2
20
13
19
14
18 15
11
1
12
20
17
16
MathML
13
19
14
18 15
17
16
NewLayoutEngine
6
7
5
8
7
4
6
5
8 9
4
3 9
10
3
2 10
7
6
11
8
2
1 11
5
1
4 12
9
20 12
3 13
10
13
2 14 16
1 7
12
6
14
18 15
16
17
NewHTMLStyleSystem
4
9 13
17
DOM
5
8
20
19
18 15
11
20
19
3
19
14
18 15
16
10
2
17
XML
11
1
12
20
13
19
14
18 15
16
17
XSLT
Figure 7: Kiviat graph of 7 Mozilla modules implementing the functionality for handling the content and layout of web-sites. Each diagram presents 20 different source code and evolution metrics of software modules of 7 subsequent releases. Edges indicate coupling dependencies between the modules.
5.3
ship between XPToolkit and DOM indicate an initial decrease of method calls but then a high increase from release 1.4 to 1.6 (+242) and 1.7 (+89). This adds to the coupling of the DOM module in the last two releases that also is highlighted by the DOM’s Kiviat diagram in Figure 7. The other two interesting relationships both point out an increase of variable accesses from release 1.0 to 1.3a. For instance, the accesses from NewLayoutEngine to NewHT MLStyleSystem increased from 9 to 432 accesses. Despite the fact that the module contains a high number of global variables (847 in release 1.7) this is a dramatic increase of the coupling between these modules.
Kiviat Graph - Relationships
The graph depicted by Figure 8 presents detailed measures of the coupling dependencies between the seven Mozilla modules. Diagrams are attached to edges that represent logical coupling relationships. Metrics visualized by the diagrams concern method calls and variable accesses between modules (see Table 2. The graph highlights strong changes of metric values. Interesting hot-spots are, for instance, the relationships between the modules NewLayoutEngine and NewHT MLStyleSystem, XPToolkit and DOM, DOM and NewHT MLStyleSystem. The latter invokes relationship presents a decrease of method calls from DOM to NewHT MLStyleSystem (from release 1.6 to 1.7) by 501. Taking into account the module diagrams of the previous graph this corresponds to the decreasing out-going (DOM) and in-coming (NewHT MLStyleSystem) metrics. Apparently, in the implementation of release 1.7 man power has been assigned to decouple the two modules. Kiviat diagrams depicting the metrics of the coupling relation-
5.4
Results
Summarized the findings from the case study with the seven Mozilla modules were: • The DOM module is the most critical cost factor.
73
F − nrAccesses
XPToolkit
E − nrAccessed D − nrAccessors
C − nrCalls B − nrCallee A − nrCallers
A
A F
F
B
E
B
E
C
D
C
D
D
C
A
F
D
C E
E
C
D
D
C
D
B
E
B F
F
E
B MathML
F
A
A
F
C
E
F
E
D
D
C
A
A
A
A
E D
C A
C
C
D
E
C E
A
F
D
D
B
E D
E
C
B
B
F
B
C
A
B
F
B B A
B
E
NewLayoutEngine F
B F
A
A
F
B
A
F E
B
C
D
C
F
D
E
E
D
C
D F
DOM C
B
E F
A
NewHTMLStyleSystem
B A
A F
A
E
C
D
E D
C
D
F
B
XML
F
E
B
A
C
D E
D
C
B C
B F A
E
E D
B
A D
B F
F
C
C E
A
B F
A
XSLT
Figure 8: Kiviat graph of module coupling dependencies with 6 metrics of 7 subsequent releases of invokes and accesses relationships between the Mozilla modules.
• Coupling between the three major modules implementing content and layout handling was high and remains high - this will further increase maintenance costs of these modules.
are designed to visualize multivariate data such as source code and evolution metrics and have been used for this purpose by related approaches. RelVis breaks down the huge amount of data extracted from configuration management systems (CVS) and several releases of source code of a software system to source code entities, their relationships and metrics. Information then is mapped to Kiviat graphs that visualize measures across selected releases. Basically, RelVis outputs two such graphs one focusing on node metrics and the other one on metrics of coupling relationships. Both graphs present condensed views on the current state of the implementation and how it came to this state. In particular, graphs point out strong changes of metrics that indicate positive or negative trends in metrics. By highlighting these trends RelVis allows the user to identify the critical source code entities and direct perfective maintenance activities to these hot-spots. Examples of Kiviat diagrams and graphs are presented in the case study with the large open source software system Mozilla. Resulting graphs clearly highlighted critical as well as positive trends and demonstrated the potential of using RelVis to visualize evolu-
• Three modules (XML, XSLT , MathML) are stable. • From release 1.6 to 1.7 work has been assigned to decouple the two modules DOM and NewHT MLStyleSystem - however, coupling between DOM and XPToolkit increased.
6
Conclusions
Users that analyze the evolution of software systems are interested in meaningful higher-level representations that facilitate understanding and interpretation of results. Huge amounts of complex data have to be broken down to meaningful graphs that inspire human minds. In this paper we introduced a multivariate visualization technique, RelVis, that builds on Kiviat diagrams. Kiviat diagrams
74
tionary data. In on-going and future case studies we plan to improve and extend the RelVis approach, for instance, to investigate the application of 3D Kiviat diagrams. Further, we plan to conduct experiments testing different sets and arrangements of metrics to identify evolution patterns and relationships between metrics.
7
G ALL , H., JAZAYERI , M., AND R IVA , C. 1999. Visualizing software release histories: The use of color and third dimension. In Proceedings of the International Conference on Software Maintenance, IEEE Computer Society Press, Oxford, UK, 99–108. GˆI RBA , T., D UCASSE , S., AND L ANZA , M. 2004. Yesterday’s weather: Guiding early reverse engineering efforts by summarizing the evolution of changes. In Proceedings of ICSM 2004 (International Conference on Software Maintenance), 40–49.
Acknowledgments
G ROSSER , D., S AHRAOUI , H. A., AND VALTCHEV, P. 2002. Predicting software stability using case-based reasoning. In Proceedings of the 17th International Conference on Automated Software Engienering, IEEE Computer Society Press, Edinburgh, Scotland, UK, 295–298.
The work described in this paper was supported in part by the Austrian Ministry for Infrastructure, Innovation and Technology (BMVIT), the Austrian Industrial Research Promotion Fund (FFF), the European Commission in terms of the EUREKA 2023/ITEA project FAMILIES (http://www.infosys.tuwien.ac.at/Cafe/) and the European Software Foundation under grant number 344.
G ULLA , B. 1992. Improved maintenance support by multi-version visualizations. In Proceedings of the 8th International Conference on Software Maintenance (ICSM 1992), IEEE Computer Society Press, 376–383.
References
L ANZA , M., AND D UCASSE , S. 2003. Polymetric views — a lightweight visual approach to reverse engineering. IEEE Transactions on Software Engineering 29, 9 (September), 782–795.
BALL , T., AND E ICK , S. 1996. Software visualization in the large. IEEE Computer, 33–43. ¨ , J. K. 1999. A uniB RIAND , L. C., DALY, J. W., AND W UST fied framework for coupling measurement in object-oriented systems. IEEE Transactions on Software Engineering 25, 1 (January), 91–121.
L EHMAN , M. M., P ERRY, D. E., AND R AMIL , J. F. 1998. Implications of evolution metrics on software maintenance. In Proceedings of the International Conference on Software Maintenance (ICSM 1998), 208–217.
B URD , E., AND M UNRO , M. 1999. An initial approach towards measuring and characterizing software evolution. In Proceedings of the Working Conference on Reverse Engineering, WCRE ’99, 168–174.
¨ M ULLER , H. A. 1986. Rigi — A Model for Software System Construction, Integration, and Evaluation based on Module Interface Specifications. PhD thesis, Rice University. P INTADO , X. 1995. The affinity browser. In Object-Oriented Software Composition, O. Nierstrasz and D. Tsichritzis, Eds. Prentice-Hall, 245–272.
C HUAH , M. C., AND E ICK , S. G. 1998. Information rich glyphs for software management data. IEEE Computer Graphics and Applications (July), 24–29.
P INZGER , M., F ISCHER , M., AND G ALL , H. 2004. Towards an integrated view on architecture and its evolution. In In Proceedings of the Software Evolution through Transformations: Model-based vs. Implementation-level Solutions, Elsevier Electronic Notes in Theoretical Computer Science, to appear.
C OLLBERG , C., KOBOUROV, S., NAGRA , J., P ITTS , J., AND WAMPLER , K. 2003. A system for graph-based visualization of the evolution of software. In Proceedings of the 2003 ACM Symposium on Software Visualization, ACM Press, 77–86.
S TASKO , J. T., D OMINGUE , J., B ROWN , M. H., AND P RICE , B. A., Eds. 1998. Software Visualization — Programming as a Multimedia Experience. The MIT Press.
C ONSENS , M. P., AND M ENDELZON , A. O. 1993. Hy+: A hygraph-based query and visualisation system. In Proceeding of the 1993 ACM SIGMOD International Conference on Management Data, SIGMOD Record Volume 22, No. 2, 511–516.
¨ S TOREY, M.-A. D., AND M ULLER , H. A. 1995. Manipulating and documenting software structures using shrimp views. In Proceedings of the 1995 International Conference on Software Maintenance, IEEE Computer Society Press, Opio, France, 275– 284.
E ICK , S. G., S TEFFEN , J. L., AND E RIC E., J R ., S. 1992. Seesoft—a tool for visualizing line oriented software statistics. IEEE Transactions on Software Engineering 18, 11 (Nov.), 957– 968. F ENTON , N., AND P FLEEGER , S. L. 1996. Software Metrics: A Rigorous and Practical Approach, second ed. International Thomson Computer Press, London, UK.
TAYLOR , C. M. B., AND M UNRO , M. 2002. Revision towers. In Proceedings of the 1st International Workshop on Visualizing Software for Understanding and Analysis, IEEE Computer Society, 43–50.
F ISCHER , M., P INZGER , M., AND G ALL , H. 2003. Populating a release history database from version control and bug tracking systems. In Proceedings of the International Conference on Software Maintenance, IEEE Computer Society Press, Amsterdam, Netherlands, 23–32.
VAN RYSSELBERGHE , F., AND D EMEYER , S. 2004. Studying software evolution information by visualizing the change history. In Proceedings of the 20th International Conference on Software Maintenance, IEEE Computer Society Press, Chicago, Illinois, USA.
F REE S OFTWARE F OUNDATION. 2003. Version Management with CVS, 1.11.14 ed. http://www.cvshome.org/docs/manual.
W U , J., S PITZER , C. W., H ASSAN , A. E., AND H OLT, R. C. 2004. Evolution spectrographs: Visualizing punctuated change in software evolution. In Proceedings of the 7th International Workshop on Principles of Software Evolution, IEEE Computer Society Press, Kyoto, Japan, K. Inoue, T. Ajisaka, and H. Gall, Eds., 57–66.
G ALL , H., H AJEK , K., AND JAZAYERI , M. 1998. Detection of logical coupling based on product release history. In Proceedings of the International Conference on Software Maintenance 1998 (ICSM ’98), 190–198.
75