Atmos. Chem. Phys., 10, 5031–5045, 2010 www.atmos-chem-phys.net/10/5031/2010/ doi:10.5194/acp-10-5031-2010 © Author(s) 2010. CC Attribution 3.0 License.
Atmospheric Chemistry and Physics
Circumpolar measurements of speciated mercury, ozone and carbon monoxide in the boundary layer of the Arctic Ocean J. Sommar1 , M. E. Andersson2 , and H.-W. Jacobi3,4 1 State
key Laboratory of Environmental Geochemistry, Institute of Geochemistry, Chinese Academy of Sciences, Guiyang 550002, China 2 Department of Chemistry, G¨ oteborg University, 41296 G¨oteborg, Sweden 3 CNRS/Universit´ e Joseph Fourier – Grenoble 1, Laboratoire de Glaciologie et G´eophysique de l’Environnement, 54 Rue Moli`ere, 38400 St Martin d’H`eres, France 4 Alfred Wegener Institute for Polar and Marine Research, Am Handelshafen 12, 27570 Bremerhaven, Germany Received: 19 August 2009 – Published in Atmos. Chem. Phys. Discuss.: 5 October 2009 Revised: 10 May 2010 – Accepted: 10 May 2010 – Published: 1 June 2010
Abstract. Using the Swedish icebreaker Oden as a platform, continuous measurements of airborne mercury (gaseous elemental mercury (Hg0 ), divalent gaseous mercury species HgII X2 (g) (acronym RGM) and mercury attached to particles (PHg)) and some long-lived trace gases (carbon monoxide CO and ozone O3 ) were performed over the North Atlantic and the Arctic Ocean. The measurements were performed for nearly three months (July–September 2005) during the Beringia 2005 expedition (from G¨oteborg, Sweden via the proper Northwest Passage to the Beringia region Alaska – Chukchi Penninsula – Wrangel Island and in-turn via a northpolar transect to Longyearbyen, Spitsbergen). The Beringia 2005 expedition was the first time that these species have been measured during summer over the Arctic Ocean going from 60◦ to 90◦ N. During the North Atlantic transect, concentration levels of Hg0 , CO and O3 were measured comparable to typical levels for the ambient mid-hemispheric average. However, a rapid increase of Hg0 in air and surface water was observed when entering the ice-covered waters of the Canadian Arctic archipelago. Large parts of the measured waters were supersaturated with respect to Hg0 , reflecting a strong disequilibrium. Heading through the sea ice of the Arctic Ocean, a fraction of the strong Hg0 pulse in the water was transferred with some time-delay into the air samples collected ∼20 m above sea level. Several episodes of elevated
Hg0 in air were encountered along the sea ice route with higher mean concentration (1.81±0.43 ng m−3 ) compared to the marine boundary layer over ice-free Arctic oceanic waters (1.55±0.21 ng m−3 ). In addition, the bulk of the variance in the temporal series of Hg0 concentrations was observed during July. The Oden Hg0 observations compare in this aspect very favourably with those at the coastal station Alert. Atmospheric boundary layer O3 mixing ratios decreased when initially sailing northward. In the Arctic, an O3 minimum around 15–20 ppbV was observed during summer (July–August). Alongside the polar transect during the beginning of autumn, a steady trend of increasing O3 mixing ratios was measured returning to initial levels of the expedition (>30 ppbV). Ambient CO was fairly stable (84±12 ppbV) during the expedition. However, from the Beaufort Sea and moving onwards steadily increasing CO mixing ratios were observed (0.3 ppbV day−1 ). On a comparison with coeval archived CO and O3 data from the Arctic coastal strip monitoring sites Barrow and Alert, the observations from Oden indicate these species to be homogeneously distributed over the Arctic Ocean. Neither correlated low ozone and Hg0 events nor elevated concentrations of RGM and PHg were at any extent sampled, suggesting that atmospheric mercury deposition to the Arctic basin is low during the Polar summer and autumn.
Correspondence to: J. Sommar (
[email protected]) Published by Copernicus Publications on behalf of the European Geosciences Union.
5032 1
J. Sommar et al.: Circumpolar measurements of speciated mercury, ozone and carbon monoxide
Introduction
The average residence time of gaseous elemental mercury (Hg0 ) and carbon monoxide (CO) in the lower troposphere is sufficient to make its distribution homogeneous over each hemisphere. While the seasonal cycle of CO exhibits a summertime minimum largely due to chemical oxidation initiated by the hydroxyl radical OH (e.g. Holloway et al., 2000), the seasonality of Hg0 is less obvious taking into consideration worldwide long-term observations (Kim et al., 2005). However, several background stations in the mid-latitudes north of 45◦ N (Kellerhals et al., 2003; Kim et al., 2005) report a wintertime Hg0 maximum. This has been attributed to seasonal trends in anthropogenic emissions and/or meteorological conditions, atmospheric oxidation processes, the height of the atmospheric mixing layer (Kock et al., 2005) and the terrestrial carbon pool (Obrist, 2007). Unlike Hg0 and CO, the mixing ratio of ozone (O3 ) in the lower troposphere reaches a maximum during summer. The Arctic atmospheric boundary layer Hg0 and O3 cycles derived from background observation sites in the European and American high Arctic (Schroeder et al., 1998; Berg et al., 2003; Helmig et al., 2007), however, exhibit large seasonal discrepancies from that of the mid-latitudes. It is very likely that high level of neurotoxic mercury in the Arctic ecosystems is partially linked to rapid, near-complete depletion of Hg0 (MDEs) in the atmospheric boundary layer occurring episodically during the polar spring (Steffen et al., 2008). Upon reaction with reactive bromine species such as bromine atoms (Donohoue et al., 2006) hundred(s) of tons of oxidised mercury (HgII ) are produced and perennially deposited into the Arctic environment (Ariya et al., 2004; Banic et al., 2003; Dastoor et al., 2008; Skov et al., 2004). The relative magnitude of this sink is profound, resembling almost half of the annual atmospheric input within a few weeks (Outridge et al., 2008). To a yet not well quantified, but significant degree, a back-reduction of HgII to Hg0 occurs resulting in a re-cycling of volatile mercury to the atmosphere (Schroeder et al., 2003). However, it cannot compensate for the total deposition, and a net assimilation into the food chain occurs. The Hg levels in the traditional food of indigenous people living in the Arctic pose a threat for human pre- and neonatal neurological development (Steffen et al., 2008). Arctic marine mammals such as beluga whales frequently contain total Hg levels well above Canadian Federal Consumption Guidelines (Lockhart et al., 2005). Again, the fate of surplus mercury deposited to the Arctic basin during polar spring is largely unknown with reference to transport and transformation. This issue has recently been discussed in modelling papers by Hedgecock et al. (2008) and Outridge et al. (2008) in favour of less net accumulation in the abiotic reservoirs. The Beringia 2005 expedition, taking place a few months after the period of elevated deposition of Hg to the Arctic Ocean, offered a unique opportunity to sample vast exposed, yet unexplored areas. Atmos. Chem. Phys., 10, 5031–5045, 2010
During the polar spring MDEs, Hg0 is generally strongly correlated with O3 (e.g. Ebinghaus et al., 2002; Eneroth et al., 2007). The loss of tropospheric O3 and most probably Hg0 in the Arctic is initiated by catalytic heterogeneous reactions involving reactive bromine gases that originate from refined sea salt reservoirs linked to sea ice (e.g. frost flowers (Kaleschke et al., 2004; Jacobi et al., 2006) or snow on sea ice (Simpson et al., 2005)) and is activated by gas-phase photochemistry: Young ice regions with open leads tend to promote the growth of salinity-enhanced ice crystals with large effective surface areas. H¨onninger (2002), Brooks et al. (2006) and Sommar et al. (2007) reported ground-based measurement of elevated BrO concentration in concert with air masses depleted of Hg0 and O3 . Unlike Hg0 and O3 , CO is less susceptible to bromine radical initiated degradation and hence essentially remaining chemical inert during polar spring (Sumner et al., 2002). The spatial extent of MDEs may be approximated using satellite observations of BrO and ground-based observations (Garbarino et al., 2002; Hollwedel et al., 2004; Lahoutifard et al., 2006; Poulain et al., 2007b; Simpson et al., 2005). During the rest of the year the atmospheric reactions driving the cycling of Hg in the boundary layer is ambiguous, possibly involving HOx and NOy radicals (Calvert and Lindberg, 2005; Sommar et al., 2001; Sommar et al., 1997). Therefore, it is important to co-sample Hg0 with other long-lived atmospheric species. Recently, Hg0 /CO emission ratios from long-distance transported pollution episodes to remote observation sites have been employed to estimate the anthropogenic Hg0 emissions from eastern Asia (Jaffe et al., 2005) and Europe (Slemr et al., 2006) as well as emissions from large scale forest fires (Ebinghaus et al., 2007; Sigler et al., 2003). Selected studies suggest a substantial underestimation of source strength of Hg0 in the current inventories for East Asia and Europe respectively. We have already pointed out that the regimes of O3 are similar with that of Hg0 during MDEs, in addition O3 is produced from degradation of CO by OH radicals, so the addition of O3 measurements to the sampling programme was a matter of course. A main objective was to estimate the spread of mercury in the Arctic environment and to investigate the lability of the deposited HgII compounds in condensed phases with respect to reduction. During the polar transect of the Arctic Ocean from Alaska to Spitsbergen, speciated Hgmeasurements were performed including gaseous divalent Hg species (RGM) and Hg attached to fine particles (PHg) in addition to that of Hg0 , O3 and CO. PHg has turned out to be a regional tracer for combustion in Europe (W¨angberg et al., 2003). This paper focuses on the air measurements alone and is a companion paper of those dealing with mercury in sea water (surface and deep-sea), ice, snow, and sediments collected in the Arctic Ocean during the Beringia 2005 expedition (Andersson et al., 2008b; Andersson, 2010). In Andersson et al. (2008b), the measurements of dissolved gaseous mercury (acronym DGM, practically ∼Hg0 (aq)) in www.atmos-chem-phys.net/10/5031/2010/
J. Sommar et al.: Circumpolar measurements of speciated mercury, ozone and carbon monoxide
5033
Table 1. Information concerning the air sampling protocol onboard IB Oden (4th deck). Species
Freq.
Start (yy-mm-dd hh:mm)
Stop (yy-mm-dd hh:mm)
Instrument
TGM, Hg0 RGM-PHga O3 CO
12 h−1 4 day−1 6 h−1 120 h−1
05-07-05 14:20 05-08-25 16:00 05-07-05 12:10 05-07-06 10:00
05-09-24 11:00 05-09-22 17:00 05-09-22 12:00 05-09-24 16:20
Tekran 2537A CVAFSa Front sampler+Tekran 2537A CVAFS O3 41M Ansyco Environnement AL 5001 AeroLaser
a Front-sampler used during Leg 3. List of Figures
the surface waters of the Arctic Ocean are thoroughly described. The DGM data reported will be capitalized on here in connection with the discussion of elevated Hg0 observations in air. Elevated DGM concentrations observed in the surface water of the Arctic Ocean compared to adjacent oceans is presumably due to input by springtime MDEs and large riverine inputs of HgII and dissolved organic carbon (DOC) forming photo-labile complexes as well as limited gas exchange with air due to the sea ice cover (Andersson et al., 2008b). Poulain et al. (2007a) demonstrated the continuous presence of active, cold resistant Hgreducing microbes in the Arctic Ocean, which do not depend on light. Based on relatively flat vertical profiles of total mercury (Hg-tot) from the Beaufort Sea and the Canadian Archipelago during summer, Outridge et al. (2008) suggested relative minor input from the atmosphere to the Arctic Ocean. St Louis et al. (2007) reported high levels of DGM (129±36 ng m−3 ) and organo-mercurials in the surface waters near the Ellesmere Island during late spring. 2
Experimental
2.1 Sampling location The measurements were conducted on board the icebreaker Oden. The IB Oden is a 108 m long and 31 m wide icebreaker, which has been rebuild to meet scientific demands. The ship is equipped with meteorological and oceanographic instrumentation. The cruise (track outlined in Fig. 1) was divided into three legs: 1. G¨oteborg, Sweden – Barrow, Alaska, 2. Barrow – Chukchi Peninsula – Wrangel Island – Barrow, 3. Barrow – Longyearbyen, Spitsbergen. Ambient air samples were continuously collected and analyzed using automatic instruments. The instruments were housed in a heated container laboratory at the 4th deck fronting the stem (∼20 m above sea level). Further information is summarised in Table 1. 2.2
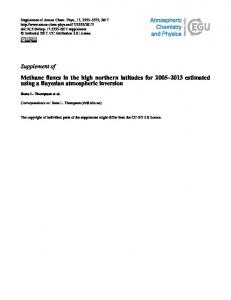
Figure 1. The spatial distribution of TGM, Hg0 in air (ng m-3) along the cruise track. The locations of coastal stations Alert (Nunavut, Canada) and Barrow (Alaska, USA) are included
Fig. 1. The spatial distribution of TGM, Hg0 in air (ng m−3 ) along as well. the cruise track. The locations of coastal stations Alert (Nunavut, Canada) and Barrow (Alaska, USA) are included as well.
Mercury measurements
A Tekran® (Model 2537A) gas-phase mercury vapour analyzer instrument was used to measure total gaseous mercury (TGM). TGM refers to gaseous elemental mercury (Hg0 ) and www.atmos-chem-phys.net/10/5031/2010/
small contributions of other gaseous mercury species (