CIRED
17th International Conference on Electricity Distribution
Barcelona, 12-15 May 2003
A PARALLEL GENETIC ALGORITHM BASED METHODOLOGY FOR NETWORK RECONFIGURATION IN THE PRESENCE OF DISPERSED GENERATION Carmen BORGES, Alessandro MANZONI, Enrique VIVEROS, Djalma FALCÃO Federal University of Rio de Janeiro - Brazil
[email protected],
[email protected],
[email protected],
[email protected] INTRODUCTION
Distribution network planning and operation require the identification of the best topological configuration that is able to attend the power demand with minimum losses, maximum reliability level and adequate voltage profile. Many possible configurations may be obtained by opening and closing switching devices on the network in a process called reconfiguration. In the presence of dispersed generation, this problem gets more complex since questions related to flow direction, short circuit level, voltage regulation, islanding supply, etc are introduced. The network reconfiguration problem, under normal or contingency operation, is a non-linear combinatorial optimization problem of large dimensions. Several approaches for solving this problem have been proposed, but they usually require unacceptable practical simplifications or high computational effort. Modern heuristics methods like Genetic Algorithms (GA) have been successfully applied to this problem. Basically, these methods consist of randomly generating an initial set of candidate solutions and evolving this set by modifications on the candidates via genetic operators. This paper presents a methodology for network reconfiguration in the presence of dispersed generation, based on genetic algorithms. The problem is formulated as a multi-objective optimization problem, where both the electrical losses and the feeders’ voltage profile can be optimised. Since distribution systems usually operate with a radial configuration, it has been implemented an intelligent strategy that avoids generating unfeasible candidates by the GA in order to improve the computational performance. However, large systems optimal reconfiguration may be very time consuming especially if high precision models are used. In order to reduce the required processing time, a parallel multi-population genetic algorithm (PGA) has been implemented, in which a different population is allocated to each processor of the parallel platform and they interchange good candidate solutions to enhance the optimal solution search. NETWORK RECONFIGURATION The problem of network reconfiguration for losses minimization deals with changing the network configuration, by opening and closing switching devices, in order to reduce the electrical losses of a given operation condition, taking into consideration quality, reliability and safety restrictions [1]. The distribution networks usually operate in a radial configuration. The advantages of this topology are the easiness of protection coordination, smaller short circuit
URJ_Borges_A2
Session 4 Paper No 88
currents, etc. The switching facilities available on the network allow transferring part of the load of a feeder to another. Besides the reduction of active losses involved in the load supply, the network reconfiguration can be used to improve the load distribution between the feeders, to increase the system robustness in relation to fails, to enhance reliability, to facilitate the restoration of de-energized areas with the operation of a smaller number of devices, etc. Problem Formulation The reconfiguration problem can be formulated as a nonlinear integer programming problem as shown below [2]: Minimize Σ Lj j∈ Ω A Ck subject to
Σ Sj,i = Di , Sj ≤ Sj,max , ∆Vi ≤ ∆Vmax , Πδi =1
i∈ Ω N j∈ Ω A i∈ Ω N
i∈ Ω N
where: Lj: active losses in branch j; Ck: k-th configuration; ΩA: set of feeders branches; Sj,i: power flow in branch j connected to load point i; Di: power demand at load point i; ΩN: set of load ponts; Sj: power flow in branch j; ∆Vi: voltage drop at node i; δ i: binary variable indicating if the load point i is energized (1) or not (0). The objective function represents the sum of the active losses in all feeders’ branches, that is, the total active losses. The first restriction establishes the power balance at the load points. The next two restrictions establish limits in the capacity of each feeder branch and in the voltage drop of each load point. The last restriction imposes that the demand at all load points are attended. Besides the restrictions above, it is also required that the network maintains its radial topology. Other restrictions can be included in the problem formulation as necessary. The solution of the problem defined above has been tried using a great number of different techniques [3]. In many of them, the solution process is based on an algorithm of power flow which is responsible for the calculation of the active losses, the voltage drop and the power flow on feeders and transformers. The process consists, essentially, in the generation of potential solutions for the problem (by opening and closing devices) and then performing the adequacy
-1-
CIRED
17th International Conference on Electricity Distribution
verification of each potential solution in order to identify the best one. In this paper, intelligent system techniques based on Genetic Algorithms are used for that purpose. The adequacy evaluation is performed by a power flow algorithm with the representation of dispersed generation. Power Flow with Dispersed Generation Conventional power flow methods used for transmission networks, such as Newton-Raphson and Fast Decoupled, do not have satisfactory behaviour for distribution networks. This fact results from some peculiar characteristics of distribution networks, such as the low X/R relationship of feeders, branches with relatively low impedances (representation of switches, voltage regulators, etc) and others. This can affect the convergence of the solution methods, demanding a large number of iterations and even an unnecessarily high computational effort for radial networks. Efficient methods for radial distribution networks power flow solution are available in the specialized literature [4]. In this paper, the Power Summation method, based on the backward/forward procedure [5], has been used. In this branch-oriented method, the network is represented by an oriented tree, where the root corresponds to the substation. The backward sweep consists in, starting from the extreme nodes and using an initial estimate of the nodal voltages, to calculate the active and reactive power flows in the branches until the root node. The forward sweep consists of, starting from the root node, to calculate the nodes voltage updates until the extreme nodes [6]. A way of modeling Dispersed Generation units in distribution power flow methods is by constant active power injection sources connected to voltage controlled buses (PV buses). The representation of PV buses in radial systems implies in the creation of network breakpoints, where the voltages of the two buses (terminal and fictitious) should be maintained at the same specified module through reactivate power injection at the buses [7, 8], as shown in Figure 1.
j
Rest of Restante da rede the network
~
Rest of Restante da rede the network
Ps Q
Ps Q
j
j´
Vj´=Vs
PARALLEL GENETIC ALGORITHM Genetic Algorithms (GA) are heuristics optimization methods based on Darwin’s specimens evolution theory [9], in which the best fitted individuals have higher probability of maintaining their genes on the next generations. GA works with the codification of the problem variables in a structure called chromosome. For an ample range of technologic and scientific problems, GA has demonstrated to be a good global optimization method [10]. However, the computational effort required by solving large dimensions optimization problems based on GA may become prohibitive in actual engineering applications. One solution to avoid that inconvenience is the use of parallel processing by the implementation of Parallel Genetic Algorithms (PGA) [11]. In this approach, parts of the global problem are solved on different processors that communicate and collaborate for the overall problem solution. GA Characteristics The main characteristics that make GA efficient optimization methods are the followings: a) The search of the optimum solution starts with a population of feasible potential solutions and not with one point like deterministic optimization methods; b) The objective function values (Fitness) of the individuals are the only information necessary to carry on the search. c) Probabilistic operators are used over the chromosomes in order to obtain a new population in each generation of the algorithm. The main genetic operators used are the Selection, the Crossover and the Mutation Operators. The Selection Operator is applied over each generation in order to choose the best fitted chromosomes. The Cross-over Operator combines two selected chromosomes to generate other two to be included in a new generation. The Mutation Operator produces random changes on the chromosomes in order to maintain the diversity of the population. Multi-Population Parallel GA
~
Figure 1 – PV bus representation
The reactive power injections at both sides of the breakpoint are necessary in order to reflect the power circulating on the branch and to control the PV bus voltage. These values are accurate if the voltage magnitudes at both sides of the breakpoint are equal, otherwise there will be an error. In this procedure, each iteration consists of two steps: Step 1 – Error Calculation: the voltage error (magnitude) is calculated in the radial network using the power injections in the break points. Step 2 – Injection Correction: the break point reactive injection correction is calculated using a sensitivity matrix, which is built using the voltage error obtained in step 1. URJ_Borges_A2
Barcelona, 12-15 May 2003
Session 4 Paper No 88
A large variety of GA parallelization techniques are available in the literature [11, 12]. The Multi-Population PGA, in which different populations are assigned to different processors, is the one with better performance (higher fitness value in smaller computation time). In the Multi-Population PGA, the initial populations are created by randomly generating their chromosomes using different seeds for the random number generator algorithm in each processor. After a fixed number of generations, the populations interchange a certain number of individuals in a process called Migration. The migration establishes the communication and integration strategy among the populations. The new parameters introduced by the migration operator are: • Migration interval: It establishes the number of generations between successive migrations;
-2-
CIRED
17th International Conference on Electricity Distribution
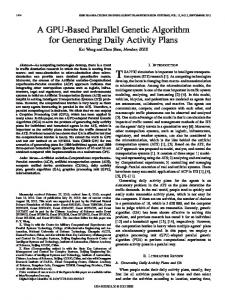
• Migration rate: It indicates the number of individuals to be communicated to the other populations at each migration; • Individuals’ Selection strategy: It establishes the rules for choosing the individuals that are chosen to migrate from one population to the others; • Reception strategy: It establishes the rules for incorporating the individuals migrated from other populations into the population that receives them. Figure 2 shows a layout for a Multi-Population PGA implementation on a cluster composed of four PCs. GA 2
GA 1
KW → 512.44 KW) and of 48% considering apparent value of the losses (1174.98 KVA → 687.27 KVA). The new configuration was obtained through the operation of only 6 switches. TABLE 2 – Distribution Test System – Reconfiguration AL
Demand
Load
Losses
Voltage
(KW/KVAR)
(KW/KVAR)
(KW/KVAR)
(min. KV)
1939.7 1207.3 1469.8 932.2 3404.2 2116.6 0.0 0.0 5341.0 3407.6
1833.2 1126.6 1438.1 891.3 3382.4 2096.2 0.0 0.0 4988.8 3091.8
106.7 80.8 31.7 40.9 21.9 20.5 0.0 0.0 352.2 315.8
12.69
AL-01 AL-02 AL-03
Proc.1
Proc.0
AL-04 AL-05
migration
Barcelona, 12-15 May 2003
Proc. 3
Proc.2
Figure 2 – Multi-Population PGA
RESULTS The methodology was applied to two distribution systems for functionality and performance evaluation. The objective function in both cases is a composition of minimum losses and minimum voltage deviation in relation to the nominal feeders voltage. The GA parameters used are: • Crossover Probability: 95% (Two points) • Mutation Probability: 10% (Constant mutation) • Selection Type: Roulette • Elitism: 4 individuals
1.1
1.1
1
1
0.9
0.9
0.8
0.8
0.7
0.7
0.6
0.6 0.5 2;1101 (L)
5;1104 (L)
4 (L)
2206
7;1105 (L)
6 (L)
8 (L
1.1
The first test system is composed of 5 distribution feeders arranged in two substations, with a total of 26 switching devices that allow several different operative configurations. The operational characteristics of the original system configuration and of the reconfigured system are shown in Tables 1 and 2, respectively. TABLE 1 – Distribution Test System – Original Configuration
AL-05
Demand
Load
Losses
Voltage
(KW/KVAR)
(KW/KVAR)
(KW/KVAR)
(min. KV)
2833.3 1763.8 3509.3 2454.5 6012.7 3920.0 0.0 0.0 0.0 0.0
2662.48 1640.51 3132.7 1941.5 5847.4 3623.9 0.0 0.0 0.0 0.0
171.0 123.5 377.0 513.5 165.5 296.5 0.0 0.0 0.0 0.0
12.54 11.62 12.72
1 0.9
0.8
0.8
0.7
0.7
0.6
3;1103 (L)
5;1104 (L)
7;1105 (L)
8 (L
0.6
0.5
0.5 1
19;2204 (L) 22 (L) 21;2207 (L) 1106
25 (L)
28 (L)
29 (L
1.1
13.80
Session 4 Paper No 88
Voltage Limit Violation
1
c) AL-03
19;2204 (L)
23 (L)
24 (L)
3306
25 (L)
2206
1.1
1
1
0.9
0.9
0.8
0.8
0.7
0.7
0.6
0.6 0.5 1
9;3301 (L)
16 (L)
11 (L)
13 (L)
14 (L)
2211
1
15;4401 (L)
9;3301 (L)
16 (L)
11 (L)
12 (L
d) AL-04 1.1
1.1
1
1
0.9
0.9
0.8
0.8
0.7
0.7
0.6
0.6
0.5 30
31
0.5 30
31
e) AL-05 1.1
13.80
The results show that the proposed algorithm found an alternative configuration for the group of feeders that provided a reduction of 28% in the total active losses (713.54 URJ_Borges_A2
2;1101 (L)
1.1
1 0.9
0.5
AL-04
1
b) AL-02
Distribution Test System
AL-03
12.48
a) AL-01
1
AL-02
13.80
The results also indicate an optimization of the voltage profile of the feeders. The reconfiguration algorithm obtained an increment of 9,2% over the minimum voltage of the initial configuration, restoring in this way all the voltages to the level of ±10% of the nominal voltage. Figure 3 shows the voltage profile of the feeders for the initial configuration and after the reconfiguration. The graphic show the elimination of voltage violations for a group of buses of feeder AL-02 (highlighted in the ellipse), as well as the new distribution of loads in the feeders (AL-05, for example, with just two load buses in the initial configuration assumes 8 load buses after the reconfiguration).
0.5
AL-01
13.68
GA 4
GA 3
AL
13.36
1.1
1
1
0.9
0.9
0.8
0.8
0.7
0.7
0.6 0.5 30
0.6
32
0.5 30
32;29 (L)
26;2209 (L)
14 (L)
13 (L)
Figure 3 – Feeders Voltage Profile Before and After Reconfiguration
-3-
3305
CIRED
17th International Conference on Electricity Distribution
The performance of the GA can be evaluated by the graphs shown in Figure 4 for the maximum and mean fitness values of the population individuals' and for the number of feasible solutions found along the generations. The population was composed of 50 individuals evaluated over a maximum of 50 generations. a) Maximum/Mean Fitness
b) No. of Feasible Solutions
F it n e s s M é d io d a P o p u la ç ã o
5 0 4
22 20 18 16
0 3 0 2 0 1
14 12 10 8 6
00
4 2 0 2
4
6
8 10 12 14 16 18 20 22 24 26 28 30 32 34 36 38 40 42 44 46 48 50
0 51 1 2 2 3 3 4 4 5
Figure 4 – Maximum/Mean Fitness and No. of Feasible Solutions
DG Influence. In order to correct the voltage violations on AL-02 of the original system configuration, shown in Figure 3, a dispersed generator with voltage control was added to the area where the violations occurs. Figure 5 shows the voltage profile of AL-02 without and with the addition of DG. DG
AL-02 1.1
1.1 1
1
0.9
0.9 0.8
0.8
0.7
0.7
0.6
0.6
0.5
0.5
1
1
19;2204 (L) 22 (L) 21;2207 (L) 1106
25 (L)
28 (L)
29 (L
19;2204 (L)
23 (L)
24 (L;G)
3306
27;2210 ( L) 29 (L
Voltage Limit Violation
The reconfiguration methodology was now applied to the system with DG added. The operational characteristics of the system with DG added, before and after the reconfiguration, are shown in Table 3 and 4, respectively. TABLE 3 – Original Configuration with DG Added Demand
Load
Losses
Voltage
(KW/KVAR)
(KW/KVAR)
(KW/KVAR)
(min. KV)
2833.3 2662.48 1763.8 1640.51 AL-02 2884.5 3132.7 (DG) -1762.3 1941.5 AL-03 6012.7 5847.4 3920.0 3623.9 AL-04 0.0 0.0 0.0 0.0 AL-05 0.0 0.0 0.0 0.0 DG = 500.0 KW / 4045.3 KVAR
171.0 123.5 252.0 340.6 165.5 296.5 0.0 0.0 0.0 0.0
12.54
AL-01
13.20 12.72
AL-01 AL-02 (DG)
AL-03 AL-04
13.38
Actual Brazilian Distribution System The second test system represents an actual substation of the Brazilian distribution system and is composed of 7 feeders with a total of 121 switching devices for reconfiguration. The operational characteristics of the original system configuration and of the reconfigured system are shown in Tables 5 and 6, respectively. AL BARDANA EUTIQUIO SOLEDADE ERICO NAUTICA ZUMBI NADRUZ
AL
13.80
BARDANA EUTIQUIO SOLEDADE
Demand
Load
Losses
Voltage
(KW/KVAR)
(KW/KVAR)
(min. KV)
1939.7 1207.3 953.5 -8.1 6012.7 3920.0 0.0
1833.2 1126.6 1438.1 891.3 5847.4 3623.9 0.0
106.7 80.8 15.3 17.6 165.5 296.5 0.0
12.69
NAUTICA
13.55
ZUMBI
12.72
NADRUZ
13.80
Session 4 Paper No 88
Demand
Load
Losses
Voltage
(KW/KVAR)
(KW/KVAR)
(KW/KVAR)
(min. KV)
4275.7 1871.4 22569.4 11584.4 1341.2 573.1 5360.1 2330.3 7947.9 3589.6 7414.2 3418.4 6953.2 3055.5
4229.7 1801.8 21427.3 9128.0 1340.0 570.8 5329.1 2270.2 7826.9 3334.2 7240.4 3084.4 6860.9 2922.7
46.0 69.5 1142.4 2456.9 1.2 2.3 31.0 60.1 121.1 255.5 174.0 334.4 92.3 132.8
13.51 12.60 13.78 13.58 13.34 13.14 13.34
TABLE 6 – Brazilian Substation System – Reconfiguration
(KW/KVAR)
URJ_Borges_A2
0.0 38.5 37.0
The results show that the simple inclusion of DG provided a reduction of 17.5% in the total active losses of the feeders (713.54 KW → 588.60 KW), mainly due to the correction of the voltage profile along feeder AL-02. Considering the initial configuration with DG added, the results show that the proposed algorithm found an alternative configuration for the group of feeders that provided a reduction of 44.5% in the total active losses of the feeders (588.60 KW → 326.10 KW). Besides that, the reconfiguration reduced the reactive power generation of the DG significantly (4045.3 KVAR → 917.5 KVAR), obtaining a better voltage profile along the feeders. The new configuration was obtained through the operation of 4 switches between the 26 available in the 5 feeders of the system.
13.80
TABLE 4 – Reconfiguration with DG Added AL
0.0 0.0 2562.4 2523.8 1601.2 1564.1 DG = 500.0 KW / 917.5 KVAR AL-05
TABLE 5 – Brazilian Substation System – Original Configuration
Figure 5 – Feeders Voltage Profile Before and After DG Installation
AL
Barcelona, 12-15 May 2003
ERICO
Demand
Load
Losses
Voltage
(KW/KVAR)
(KW/KVAR)
(KW/KVAR)
(min. KV)
4275.7 1871.4 1181.2 504.7 22546.6 11190.8 5360.1 2330.3 7947.9 3589.6 7414.2 3418.4 6953.2 3055.5
4229.7 1801.8 1180.4 502.8 21586.9 9196.0 5329.1 2270.2 7826.9 3334.2 7240.4 3084.4 6860.9 2922.7
46.0 69.5 0.9 1.9 959.9 1995.1 31.0 60.1 121.1 255.5 174.0 334.4 92.3 132.8
-4-
13.51 13.77 12.78 13.58 13.34 13.14 13.34
CIRED
17th International Conference on Electricity Distribution
Barcelona, 12-15 May 2003
Parallel GA Performance The results show that the proposed algorithm found an alternative configuration for the group of feeders that provided a reduction of 11.4% in the total active losses of the feeders (1607.9 KW → 1424.5 KW). The new configuration was obtained through the operation of 4 switches from a total of 121 available devices, that basically transferred a block of 22MVA of load from a feeder to another one. The results did not obtain significant improvement in the voltage profile of the feeders, but all voltages are kept within the ±10% of the nominal voltage interval. For this example, the GA population was composed of 100 individuals evaluated over a maximum of 30 generations. DG Influence. Three units of dispersed generator with voltage control were added to the previous distribution system for DG influence evaluation purposes. The generators were added to the NAUTICA, ZUMBI and NADRUZ feeders. The reconfiguration methodology was then applied to the system with DG added. The operational characteristics of the system with DG added, before and after the reconfiguration, are shown in Table 7 and 8, respectively. TABLE 7 – Brazilian Substation System – Original Configuration with DG Added AL
Demand
Load
Losses
Voltage
(KW/KVAR)
(KW/KVAR)
(KW/KVAR)
(min. KV)
4275.7 4229.7 1871.4 1801.8 EUTIQUIO 22569.4 21427.3 11584.4 9128.0 SOLEDADE 1341.2 1340.0 573.1 570.8 ERICO 5360.1 5329.1 2330.3 2270.2 NAUTICA 7430.2 7826.9 (DG) 357.1 3334.2 ZUMBI 6894.1 7240.4 (DG) -1238.8 3084.4 NADRUZ 6451.3 6860.9 (DG) -787.3 2922.7 DG(nautica) = 500.0 KW / 3192.3 KVAR DG(zumbi) = 500.0 KW / 4609.3 KVAR DG(nadruz) = 500.0 KW / 3836.1 KVAR BARDANA
46.0 69.5 1142.4 2456.9 1.2 2.3 31.0 60.1 103.4 213.7 153.9 284.0 90.5 120.0
13.51 12.60 13.78 13.58 13.65 13.71 13.45
The results show that the simple inclusion of DG provided a reduction of 2.4% in the total active losses of the feeders (1607.9 KW → 1568.6 kw) with respect to the case without DG installed. Considering the initial configuration with DG added, the results show that the proposed algorithm found an alternative configuration for the group of feeders that provided a reduction of 11.7% in the total active losses of the feeders (1568.6 KW → 1384.0 KW). There was no significant voltage profile improvement for this system after the reconfiguration, mainly because the initial configuration voltage profile was already within acceptable limits. However, no new voltage violation was created after the reconfiguration. The new configuration was obtained through the operation of 4 switches between the 121 available in the 7 feeders of the system.
URJ_Borges_A2
Session 4 Paper No 88
The results presented above were also obtained by the multipopulation PGA implementation on a Windows 2000 PC cluster composed of four Intel Pentium III 1.0 GHz personal microcomputers, interconnected by a switched Fast-Ethernet network. The message passing system used for communication between processors was the MPI – Message Passing Interface [13] implementation for C++ programming language. TABLE 8 – Brazilian Substation System – Reconfiguration with DG Added AL
Demand
Load
Losses
Voltage
(KW/KVAR)
(KW/KVAR)
(KW/KVAR)
(min. KV)
4275.7 4229.7 1871.4 1801.8 EUTIQUIO 1181.2 1180.4 504.7 502.8 SOLEDADE 22546.6 21586.9 11190.8 9196.0 ERICO 6013.6 5970.8 2627.0 2543.6 NAUTICA 6775.2 7185.2 (DG) 205.9 3060.9 ZUMBI 6894.1 7240.4 (DG) -1238.8 3084.4 NADRUZ 6451.3 6860.9 (DG) -787.3 2922.7 DG(nautica) = 500.0 KW / 3041.7 KVAR DG(zumbi) = 500.0 KW / 4609.3 KVAR DG(nadruz) = 500.0 KW / 3836.1 KVAR BARDANA
46.0 69.5 0.9 1.9 959.9 1995.1 42.8 83.5 90.0 186.1 153.9 284.0 90.5 120.0
13.51 13.77 12.78 13.55 13.66 13.71 13.45
The speedup obtained by the parallel solution was almost linear with respect to the number of processor, requiring less than 8 sec for the first test system and less than 3 min for the second one. CONCLUSIONS This paper presented a methodology for network reconfiguration in the presence of dispersed generation, based on genetic algorithm. A parallel implementation based on multi-population GA helped to reduce the computation time requirement of the methodology. The results obtained so far on test and actual distribution systems are very encouraging. REFERENCES [1] Baran, M., Wu, F. , 1989, “Network Reconfiguration in Distribution Systems for Loss Reduction and Load Balancing”, IEEE Transactions on Power Systems. [2] Nara, K., Shiose, A., Kitagawa, M., Ishihara, T., 1992, “Implementation of Genetic Algorithm for the Distribution Systems Loss Minimum Re-Configuration”, IEEE Transactions on Power Systems, vol. 7, no. 3, pp. 1044-1051. [3] Sarfi, R.J., Salama, M.M.A., Chikhani, Y., 1994, “A Survey of the State of the Art in Distribution System Reconfiguration for System Loss Reduction”, Electric Power Systems Research, vol. 31, pp. 61-70.
-5-
CIRED
17th International Conference on Electricity Distribution
Barcelona, 12-15 May 2003
[4] Srinivas, M.S., 2000, “Distribution Load Flow: A Brief Review”, Proceedings of the 2000 IEEE PES Summer Meeting, Singapore. [5] Khan, A.H., Broadwater, R.P., Chandrasekaram, A., 1988, “A Comparative Study of Three Radial Power Flow Methods”, Proceedings of the IASTED International Symposium on High Technology in Power Industry, pp. 262-265, Phoenix, Arizona. [6] Broadwater, R.P., Chandrasekaram, A., Huddleston, C.T., Khan, A.H., 1988, “Power Flow Analysis of Unbalanced Multiphase Radial Distribution Systems”, Electric Power System Research, vol. 14. [7] G.X. Luo, A. Semlyen, 1990, "Efficient Load Flow for Large Weakly Meshed Networks", IEEE Trans on Power Systems, Vol. 5, No. 4. [8] Shirmohammadi, D., Hong, H.W., Semlyen, A., Luo, G.X., 1988, "A Compensation-Based Power Flow Method for Weakly Meshed Distribution and Transmission Networks", IEEE Trans on Power Systems, Vol.3, No.2. [9] Goldberg, D. E., 1989, Genetic Algorithms in Search, Optimization and Machine Learning, Addison-Wesley Publishing Company. Massachusetts – USA. [10] Miranda, V., Srinivasan, S., Proença, L., 1998, “Evolutionary Computation in Power Systems”, International Journal of Electrical Power & Energy Systems, Vol. 20, pp. 89-98. [11] Cantú – Paz, E., 1999, “Topologies, Migration Rates, and Multi-population Parallel Genetic Algorithms”, Illinois Genetic Algorithms Laboratory – IlliGAL Report No. 99007, University of Illinois, Urbana – Champaign, United States. [12] Cantú – Paz, E., Goldberg, D. E., 1999, “Parallel Genetic Algorithms with Distribuited Panmitic Populations”, Illinois Genetic Algorithms Laboratory – IlliGAL Report No. 99006”, University of Illinois, Urbana – Champaign, United States. [13] Gropp, W., Leusk, E., Skjellum, A., 1999, Using MPI – Portable Parallel Programming with the Message Passing Interface, The MIT Press, Cambridge – Massachusetts, UK.
URJ_Borges_A2
Session 4 Paper No 88
-6-