Published by IEEE Published version is available at http://ieeexplore.ieee.org/xpl/articleDetails.jsp?arnumber=7164783 DOI: 10.1109/ICACEA.2015.7164783
Classification of ECG signals using Machine Learning Techniques: A Survey Shweta H. Jambukia MTech (IT) Student Department of Information Technology, Dharmsinh Desai University, Nadiad, India.
[email protected]
Vipul K. Dabhi Department of Information Technology, Dharmsinh Desai University, Nadiad, India.
[email protected]
Abstract— Classification of electrocardiogram (ECG) signals plays an important role in diagnoses of heart diseases. An accurate ECG classification is a challenging problem. A survey of ECG classification into arrhythmia types is presented in this paper. Early and accurate detection of arrhythmia types is important in detecting heart diseases and finding treatment of a patient. Different classifiers are available for ECG classification. Amongst all classifiers, artificial neural networks have become very popular and most widely used for ECG classification. In this paper a detailed survey of preprocessing techniques, ECG databases, feature extraction techniques, classifiers and performance measures are presented. This paper also discusses issues in ECG classification, analysis of input beat selection, and output of classifiers. Keywords—ECG classification; preprocessing; neural network; mit-bih database; feature extraction; pan-tompkins algorithm.
I. INTRODUCTION An electrocardiogram (ECG) is a medical test which detects cardiac abnormality by measuring the electrical activity generated by the heart. A heart produces tiny electrical impulses which spread through the heart muscle. These impulses can be detected by an ECG machine. An ECG machine records the electrical activity of the heart and displays this data as a trace on a paper. This data is then interpreted by a medical practitioner. ECG helps to find the cause of symptoms or chest pain and also helps to detect abnormal heart rhythm or cardiac (heart) abnormalities. ECGs from normal healthy hearts have a characteristic shape. Any irregularity in the heart rhythm or damage to the heart muscle can change the electrical activity of the heart, so shape of the ECG gets changed. A doctor may recommend an ECG for patients who may be at risk of heart disease because of family history of heart disease, smoking, overweight, diabetes, high cholesterol or high blood pressure. The heart disorders that can be detected using ECG include abnormal heart rhythms, heart attack, and an enlarged heart. ECG is the recording of the electrical property of the heartbeats and has become one of the most important tool in the diagnosis of heart diseases. Due to high mortality rate of heart diseases, early detection and precise discrimination of
Harshadkumar B. Prajapati Department of Information Technology, Dharmsinh Desai University, Nadiad, India.
[email protected]
ECG signal is essential for the treatment of patients. Early and accurate detection of ECG arrhythmia helps doctors to detect various heart diseases. Classification of ECG signals using machine learning techniques can provide substantial input to doctors to confirm the diagnosis. Classification and detection of arrhythmia types can help in identifying the abnormality present in ECG signal of a patient. After identifying the abnormality, the heart diseases can be detected and the better treatment of the patient can be done. Accurate ECG classification into arrhythmia types provides sufficient information to detect the heart diseases and helps doctor in finding best treatment therapy for patients. Classification of ECG signals is a challenging problem due to issues involved in classification process. Major issues [1, 2] in ECG classification are lack of standardization of ECG features, variability amongst the ECG features, individuality of the ECG patterns, non existence of optimal classification rules for ECG classification, and variability in ECG waveforms of patients. Developing the most appropriate classifier that is capable of classifying arrhythmia on real-time is also an issue in ECG arrhythmia classification. Applications of ECG signal classification are in detecting abnormality type and diagnosing a new patient more precisely than manually. It is also used in heart diseases diagnosis and treatment of patients. ECG classification includes steps namely preprocessing, feature extraction, feature normalization, and classification. in this paper a detailed survey of preprocessing techniques, issues in ECG classification, different database used by researchers, survey of different classifiers, and different performance measures are discussed. Detailed analysis of input beat selection and output of classifiers is also included in this paper. This work can be useful for the other researchers in identifying issues in ECG classification and to analyze the research area. The detailed analysis and basics of ECG classification can help beginners to understand the research area. The following sections of this paper describe basic introduction of ECG and ECG classification (section-2), issues in ECG classification (section-3), a detailed survey of ECG classification (section-4), databases - techniques available for ECG classification (section-5), and conclusion (section-6).
II.
BACKGROUD KNOWLEDGE
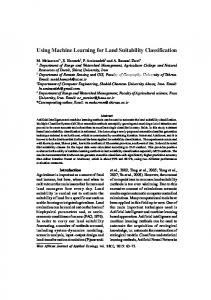
One ECG signal consists of several ECG beats and each ECG beat contains P wave, QRS complex, and T wave. Each peak (P, Q, R, S, T, and U), intervals (PR, RR, QRS, ST, and QT) and segments (PR and ST) of ECG signals have their normal amplitude or duration values. These peaks, intervals, and segments are called ECG features. Fig 1 shows these features for one ECG cardiac cycle, which are described in Table I. Table I presents ECG features along with their description and their durations.
Fig. 1. Normal ECG waveform [3]
TABLE I. Feature RR P PR QRS
PR J-point ST T ST QT U
ECG FEATURES AND THEIR NORMAL DURATION [4]
Description interval between R wave and the next R wave first short upward movement of the ECG tracing measured from the beginning of the P wave to the beginning of the QRS complex normally begins with a downward deflection Q, a larger upwards deflection R and ends with a downward S wave connects the P wave and the QRS complex The point at which the QRS complex finishes and the ST segment begins is called J-point. connects the QRS complex and the T wave normally a modest upward waveform measured from the J point to the end of the T wave measured from the beginning of the QRS complex to the end of the T wave normally has low amplitude and often it is completely absent
Duration 0.6-1.2 s 80ms 120-200 ms 80-120 ms
50-120 ms Not applicable 80-120 ms 160 ms 320 ms 420 ms Not mentioned
Classification of ECG signals plays an important role in clinical diagnosis of heart disease. The main problem in diagnosing heart disease using ECG is that the normal ECG may differ for each person and sometimes one disease has dissimilar signs on different patient’s ECG signals. Also, two distinct diseases may have approximately identical effects on normal ECG signals. These problems complicate the heart disease diagnose. Therefore, the utilization of pattern classifier techniques can improve the new patients ECG arrhythmia diagnoses. The ECG classification problem is a multi-class classification problem containing classes such as Normal, Left Bundle Branch Block (LBBB) and Right Bundle Branch Block (RBBB). ECG data can be classified into two ways: (i) classification of ECG signal, and (ii) classification of
individual ECG beat. One cardiac cycle consists of P, Q, R, S, T and U wave which defines one ECG beat. One ECG signal contains thousands of such beats. Preprocessing, feature extraction, normalization, and classification are main sequential steps of ECG classification. ECG signals may contain several kinds of noise (e.g. baseline wander noise), which can affect the extraction of features used for classification. Therefore, preprocessing step is necessary for removing the noises. Feature extraction step is required for extracting different ECG features and these features are then used as inputs to classification model. Researchers have applied different preprocessing techniques for ECG classification. For noise removal, techniques such as low pass linear phase filter, linear phase high pass filter etc. are used. For baseline adjustment, techniques such as median filter, linear phase high pass filter, mean median filter etc. are used. Feature extraction techniques used by researchers are Discrete Wavelet Transform (DWT), Continuous Wavelet Transform (CWT), Discrete Cosine Transform (DCT), S-Transform (ST), Discrete Fourier transform (DFT), Principal Component Analysis (PCA), Daubechies wavelet (Db4), Pan-Tompkins algorithm, Independent Component Analysis (ICA) etc. For normalization of features, techniques such as Z-score and Unity Standard Deviation (SD) are used. Classification techniques used are Multilayer Perceptron Neural Network (MLPNN), Fuzzy C-Means clustering (FCM), Feed forward neuro-fuzzy, ID3 decision tree, Support Vector Machine (SVM), Quantum Neural Network (QNN), Radial Basis Function Neural Network (RBFNN), Type2 Fuzzy Clustering Neural Network (T2FCNN) and Probabilistic Neural Network (PNN) classifier etc. III. ISSUES IN ECG CLASSIFICATION Issues in ECG classification are lack of standardization of ECG features, variability amongst ECG features, individuality of the ECG features, non existence of optimal classification rules for ECG classification, variability in ECG waveforms of patients, and selection of the most appropriate classifier. The presented issues would help beginners to understand the challenges involved in classification of ECG. These issues are described below: 1. Lack of standardization of ECG features: ECG wave boundaries, heuristically on time and amplitude domain are not standard or fixed. Feature extraction method temporally selects ECG features so accuracy of this method depends on these detected features. A small variation in these features may cause a misclassification over large data sets. 2. Variability of the ECG features: Heart rate of individual is changing as per physiological and mental conditions. Stress, excitement, exercise, and other working activities may change the heart rate. The changes in the heart rate accordingly vary the features such as RR interval, PR interval, and QT interval. These features need to be carefully transformed and the impact of the varying heart rate needs to be eliminated. 3. Individuality of the ECG patterns: Individuality of the ECG pattern refers to the likelihood of intraclass
4. 5.
6.
7.
similarity and interclass variability of testing patterns observed in ECG data. It shows up to what extent the ECG patterns are scalable in sufficiently larger dataset. Non existence of optimal classification rules for ECG classification. Patients may have different ECG waveforms: ECGs from different patients may have different slops of signal, timing, and amplitude which change the ECG waveforms. Therefore, the classification process needs to carefully classify the ECG signal. Beat variations in single ECG: Single ECG may contain thousands of beats and these beats may be of different types (i.e. arrhythmia types). Therefore, classification model needs to get trained in such a way that it produces small errors on test dataset. Finding out the most appropriate classifier which is capable of classifying arrhythmia on real-time is an issue because classification accuracy depends on many parameters such as type of arrhythmia, diversity in arrhythmia, selected arrhythmia database, selected feature extraction technique etc. IV.
SURVEY OF ECG CLASSIFICATION
Many researchers have worked on classification of ECG signals. They have applied different pre-processing techniques, various feature extraction techniques and classifiers. Most of the researchers have used MIT-BIH arrhythmia database for ECG classification. A.Dallali et al. [5] have extracted RR interval using DWT and normalized the RR interval using Z score. They used FCM to classify ECG beats. They achieved 99.05% accuracy. In [6], features extracted are RR interval and R point location by using DWT. Preclassification was done using FCM and final classification was done using 3-layer MLPNN. They achieved accuracy of 99.99%.
TABLE II. Researchers No. of ECG Features features R.Ceylan et 1 RR interval al. (2008)
J.Wang et al. (2012)
2
R peak, RR interval
V.Kumari et al. (2013)
1
RR interval
S.Jadhav et al. (2012)
1
RR interval
A.Dallali et al. (2011)
1
RR interval
R peak and RR interval are extracted using DWT in [7]. ECG classification was done using MLPNN. The obtained Mean Squared error (MSE) was 0.00621. H.Khorrami et al. [8] have extracted RR interval using DWT. Performance of MLPNN and SVM were compared in this paper. D.Patra et al. [9] have manually extracted R peak and RR interval from the annotation file of the MIT-BIH arrhythmia database. Features are normalized using Zero mean and reduced using FCM. 3 layer FFNN with back propagation algorithm is used as classifier. F.Naima et al. [10] have extracted R location and RR interval using Db4 discrete wavelet transform. FFNN trained with back propagation algorithm is used. Sensitivity, specificity and accuracy achieved by NN are 90%, 90%, 95% respectively. A.Khazaee [11] calculated nxtRR, prevRR, and ratRR from RR interval and normalized with mean of zero and standard deviation of unity. PSO-SVM classifier is used for ECG classification. In [12], RR interval is calculated from the recordings of MIT-BIH arrhythmia database. MLPNN and SVM classifier were compared in this paper. Result shows that MLPNN is good for testing performance while SVM shows good training performance. A.Vishwa et al. [13] have extracted RR interval and R peak using DWT and normalized by Zero mean. Noise was removed by band pass filter. MIT-BIH arrhythmias database and Normal sinus rhythm database were used. FFNN with error back propagation algorithm was used as a classifier. In [14], features extracted were R peak, RRt interval (current RR interval at t time), RRt+1 interval (next RR interval at t+1 time), QRSh (QRS complex height), and QRS width. Pan Tompkins algorithm is used to extract R peak and QRS complex. Low pass linear phase filter is used for noise removal and median filter is used for baseline correction. RBFNN is used as classifier. Sensitivity and specificity achieved using PSO-RBFNN were 96.251 % and 99.104% respectively. Table II shows survey of ECG classification. It includes number of features, features name, pre-processing techniques, database, modeling techniques, performance measures used, and accuracy achieved in each paper.
SURVEY OF ECG CLASSIFICATION
Preprocessing Technique Feature extraction: DWT
Feature normalization: Z score, Feature reduction: PCA and LDA Feature extraction: Symlets, CWT, Feature reduction: Symmetric uncertainty Feature extraction: DWT
Feature normalization: Z score, Removing noise: Baseline adjustment, Feature extraction: DWT
Database
Modeling Technique
Performance Measures MIT-BIH 3-layered FFNN, T2FCNN, Sensitivity, arrhythmias fuzzy clustering neural network Specificity, Average detection rate MIT-BIH PNN classifier with probability Sensitivity, arrhythmias density function (pdf) as training Specificity, rule Accuracy MIT-BIH Modular neural network – Precision , arrhythmias MLPNN Recall, and UCI Root MSE arrhythmia UCI MLPNN, Generalized FFNN, Sensitivity, arrhythmia Modular neural network Specificity, Accuracy MIT-BIH FCM and heart rate variability Accuracy arrhythmias (HRV) database
Accuracy (%) 96.7 100 98.35 97.98 99.10 99.71 95.1 95.1 0.1765 93.75 93.1 86.67 99.05
M.Vijayavan an et al. (2014) A.Dallali et al. (2011) F.Naima et al. (2009)
12
V.Srivastava et al. (2013)
2
D.Patra et al. (2010)
2
A.Sadiq et al. (2013)
10
H.Khorrami et al. (2010)
1
M.Korurek et al. (2010)
5
S.Yu et al. (2008)
3
A.Khazaee (2013)
1
M.Moavenia n et al. (2010)
3
N.Joshi et al. (2014)
2
E.Zeraatkar et al. (2011)
4
D.Joshi et al. (2013)
1
M.Das et al. (2014)
3
2 2
Peaks-R, Q, S, P, T, Intervals- Feature extraction: DWT level- MIT-BIH Feed forward PNN classifier Accuracy 96.5 RR, PR, QT, ST, QRS 8, arrhythmias Trained with extracted features duration, Segments- ST, PR Remove baseline wander RR interval Feature extraction: DWT using MIT-BIH Pre-classification: FCM, Accuracy 99.99 R point location Daubechies wavelet Of order 3 arrhythmias Final classification: MLPNN R location (max peak) Feature extraction: DFT, MIT-BIH FFNN training algorithm Sensitivity, 90 RR interval DWT, Db4 and Haar arrhythmias Back propagation algorithm Specificity, 90 DWT-FFNN, DFT-FFNN Accuracy 95 QRS amplitude Feature extraction: MIT-BIH Feed forward neuro fuzzy Sensitivity, 80 RR interval DWT arrhythmias Combination of Fuzzy logic and Specificity, 90 MLPNN Accuracy 85 R peak Feature normalization: Zero MIT-BIH 3 layer FFNN with back Sum of square RR interval mean (reduce the effect of arrhythmias propagation algorithm error (average 3.99*10-4 bias), FCM-FFNN, PCA-FFNN, training error, Data reduction: FCM-ICA-FFNN, FCM-PCA- testing error), 0.13 FCM , PCA FFNN Training time 656.42 Peaks-R, P, Q, T, S, avg PR Denoised using: DWT, Low MIT-BIH ID3 Decision tree Elapsed time, 0.0046 interval, avg QRS duration, pass and High pass filter, arrhythmias Haar-ID3, Db4-ID3 Classification 94 avg RS amplitude, avg RT Wavelet selection: accuracy amplitude, max QS amplitude Harr filter, Daubechies wavelet RR interval Baseline reduction, MIT-BIH 3 layer FFNN trained using back Mean square 0.0349 Feature extraction: arrhythmias propagation algorithm, error (training 0.0438 DWT, CWT, DCT and testing) 0.0056 SVM DWT-MLP, 0.1048 CWT-MLP R peak, RRt, RRt+1 interval, noise removal: Low pass linear MIT-BIH RBFNN classifier Sensitivity, 96.251 QRSh, QRS width phase filter, Baseline arrhythmias RBFNN parameters (neuron Specificity 99.104 correction: median filter, centers, bandwidth of each Feature extraction: neuron) obtained by PSO Pan Tompkins algorithm PSO-RBFNN R peak, QRS segment, RR Normalization: MIT-BIH PNN (radial basis layer Sensitivity, 98.508 interval Zero mean & unity standard arrhythmias and competitive layer), Specificity, 99.906 deviation, 3-layer FFNN with back Overall 98.710 ICA propagation algorithm accuracy RR interval RR interval detection and MIT-BIH MLPNN with back propagation MSE baseline reduction arrhythmias training algorithm , SVM (Training and 0.007656 classifier with Kernel-Adatron Testing error), 0.1539 (K-A) training algorithm Training time 04:45 nxtRR, prevRR, ratRR Normalization: mean of zero MIT-BIH PSO-SVM Penalty 28597.68 and standard deviation of arrhythmias parameter c, unity, Cutting of signals by use Optimize feature selection and Kernel function 0.0086 of annotation file, IdentiSVM kernel parameters parameters r, fication of peaks and valleys Best fitness 97.21 R peak (Pre-R segment, Pro-R Baseline wander correction: MIT-BIH SVM classifier Class oriented 99 segment), RR interval (avg RR, DWT, arrhythmias and Subject local RR, previous RR, post Feature extraction: ICA, oriented 86 RR) Feature reduction: PCA evaluation R peak, RR interval, QRS To eliminate power line effect: MIT-BIH MLPNN classifier Sensitivity, complex detection, T wave Notch filter, arrhythmias Specificity, 96.77 To reduce the effect of EMG , Normal Positive 88.50 noise: sinus predictive 96.18 Discrete Butterworth filter, Rhythm, value, Baseline shift: median filter QT and Negative T-wave predictive value 90.16 alternans challenge QRS complex Feature extraction: MIT-BIH MLPNN trained with back Accuracy 99.55 Pan Tompkins algorithm arrhythmias propagation algorithm, (QRS), SVM, RBFNN classifier PCA+RBF, PCA+SVM, Reduction: DCT+RBF, DCT+SVM, PCA, DWT DWT+RBF, DWT+SVM QRS detection, RR interval, R Feature extraction: ST, DWT MIT-BIH MLPNN classifier Sensitivity, 69.38 peak level4, Pan Tompkin's QRS arrhythmias Accuracy 97.5 detection algorithm, ST+MLPNN, ST+WT+MLPNN Normalization: Zero mean, To remove noise and low frequency baseline wander: Band pass filter
X.Tang et al. (2014)
27
J.Nasiri et al. (2009)
22
A.Vishwa et al. (2011)
2
Y.Ozbay et al. (2006)
2
A.Muthuchu dar et al. (2013) M.Sarkaleh et al. (2012) S.Ayub et al. (2011) A.Daamouch e et al. (2011)
6
Z.Zidelmal et al. (2013)
2
R.Acharya et al. (2004)
2
N.Kannathal et al. (2003)
13
2 2 6
Peaks-P, Q, R, S, T, 3 angle Baseline wanders removal and MIT-BIH QNN trained using gradient Accuracy 91.7 features, 19 temporal features denoised: High pass and Low arrhythmias descent method (distance between points) pass filter, Feature extraction: DWT, Feature reduction: rough sets 19 temporal features, Intervals- Noise removal: DWT, MIT-BIH Genetic algorithm-SVM Accuracy 93.46 RR, PQ, PR, PT, ST, TP, 3 Feature reduction: arrhythmias morpholo- gical features PCA, GA (meta-heuristic) R peak, RR interval Remove low frequencies: Fast MIT-BIH Feed forward ANN with error Classification 96.77 Fourier transform (FFT), To arrhythmia back propagation accuracy, restore ECG: Inverse FFT , , QT and Youden Index 0.9415 Baseline noise reduction: Normal segmentation of ECG beats sinus rhythm R peak, RR interval Not mentioned MIT-BIH Pre-classification: Fuzzy Average 0.28 arrhythmia clustering NN architecture training error, Classification: MLPNN with Testing error 0.22 back propagation Training time, 196.95 QRS interval, QRS amplitude, Noise removal: MIT-BIH Feed forward network with back Accuracy 96 P wave, T wave, PR interval, Wavelet transform (UWT) arrhythmia propagation algorithm as ST interval training algorithm R peak, RR interval Feature extraction: MIT-BIH MLPNN trained with error back Recognition Not DWT Up to 2 Level arrhythmia propagation algorithm rate mentioned R peak, RR interval Not mentioned MIT-BIH Cascade forward neural network Mean squared 0.00621 arrhythmia with back propagation algorithm error QRS complex duration, Wavelet filter, QRS detection: MIT-BIH SVM classifier Sensitivity, 91.75 RR interval, RR interval ecgpuwave software arrhythmia Specificity, 96.14 averaged over 10 last beats, 3 (http://www.physiotools/ecguw Positive 74.26 morphological features ave/src/) predictivity RR interval Denoised and feature MIT-BIH SVM with rejection Average 97.2 QRS complex duration exraction: DWT using db4, arrhythmia accuracy with Data normalization, no rejection, R peak detection- wavelet Minimal 98.8 coefficient, Q, S peak- simple classification peak detection method cost R peak Feature extraction: Pan- MIT-BIH 4 layer FFNN classifier and Accuracy 80-85% RR interval Tompkins algorithm, arrhythmia fuzzy classifier Noise removal Heart rate, Change in Heart Feature extraction: Tompkins MIT-BIH 5 layer FFNN classifier with Sensitivity, 99.3 rate, QRS width, Normalized algorithm (R) arrhythmia error back propagation Specificity, 98.3 (entropy QRS, ST wave), algorithm, Positive 99.3 Complexity parameter (QRS, Noise removal: SOM classifier (self-organizing predictivity ST), Spectral entropy, RR Bandpass filter and algorithm maps), accuracy interval, ST segment length, of Van Alste and schilder PNN architecture ST segment deviation, ST angle of deviation, ST segment area
Table III shows detailed analysis of input beat selection and output of a classifier. It includes how many beats taken from single file for classification (D-Depend on class and NNot mentioned), number of classes (i.e. arrhythmia types), approaches to select beats (R-Random, S-Sequence, and NNot mentioned) and proportion of beats for classes and types of classification (B-Beat, S-Signal, and N-Not mentioned). This survey table helps beginners and other researchers in TABLE III. Researchers
No. of class es 10
Beat selec tion
R.Ceylan et al. (2008)
No. of beat s D
J.Wang et al. (2012)
D
8
R
A.Dallali et al. (2011)
20
4
R
R
selection of input beat proportion, appropriate approach to select beats and number of outputs of classifier. Table II and III also shows that for getting abnormality type as output which features are need to take as input to classifiers. These tables help other researchers and beginners to decide which input features and abnormality types as output are select for ECG classification.
DETAILED ANALYSIS OF INPUT BEAT SELECTION AND OUTPUT OF A CLASSIFIER Proportion of beats: Class (training, testing)
Normal (15, 9), Sinus bradycardia (15, 9), Ventricular tachycardia (6, 5), Sinus arrhythmia (15, 9), APC (6, 5), Paced beat (10, 6), RBBB (10, 6), LBBB (10, 6), Atrial fibrillation (10, 6), Atrial flutter (9,6) Normal (3600), PVC (2460), Paced (800), RBBB (800), LBBB (800), APC (764), VLWAV (472), AESC (104). 50% beats for training Normal (20,18), Sinus arrhythmia (20, 18), LBBB (20, 18), RBBB (20, 18), APC (20, 18)
Classi ficati on type B
B B
M.Vijayavanan et al. (2014) A.Dallali et al. (2011)
N
2
S
Normal (5, 10, 15, 20 min), Abnormal(5, 10, 15, 20 min)
S
20
4
R
B
27 16 20 90
2 7 5 5
R R R N
D
6
S
180 N
3 3
S N
90
7
R
D
8
R
N.Joshi et al. (2014)
100
16
R
D.Joshi et al. (2013) M.Das et al. (2014)
200 N
3 5
S S
X.Tang et al. (2014) J.Nasiri et al. (2009) A.Vishwa et al. (2011) Y.Ozbay et al. (2006)
60 D 300 200
2 4 2 10
R S S R
M.Sarkaleh et al. (2012) S.Ayub et al. (2011) A.Daamouche et al. (2011) Z.Zidelmal et al. (2013) A.Muthuchudar et al. (2013)
45
3
R
Normal (20, 18), Atrial fibrillation (20, 18), Ventricular fibrillation (20, 18), Ventricular Tachycardia (20, 18) Normal (26, 12), Abnormal (19,8) Normal (8, 8), LBBB (8, 8), RBBB (8, 8), PVC (8, 8), APB (9, 9), PB (9, 9) Normal (10, 10), LBBB (10, 10), RBBB (10, 10), PVC (10, 10), APB (10, 10), Paced (10, 10) Normal (50, 10), LBBB (50, 10), RBBB (50, 10), PAB (50, 10), PAV (50, 10) Normal (836), APB (165), RBBB (150), Fusion of paced and normal beats (130), PVC (605), Fusion of ventricular and normal beats (248). 50% beats for training and testing Normal (22476), PVC (5394), Other (3003). 70% beats for training, 30% beats for testing Normal, LQT, TWA. 50% or 60% or 70% beats for training and 50% or 40% or 30% beats for testing Normal (50, 10), LBBB (50, 10), RBBB (50, 10), PVB (50, 10), PAB (50, 10), Fusion of paced and normal (50, 10), Paced beats (50, 10) Normal (100, 100), LBBB (100, 100), RBBB (100, 100), PVC (100, 100), APB (100, 100), PB (100, 100), VFW (236, 236), VEW (52, 52). 50% beats for training an testing Normal, RBBB, LBBB, APC, PVC, Paced, APB, Ventricular flutter wave, Fusion of ventricular and normal, Blocked AP beat, Nodal escape beat, Fusion of paced and normal, Ventricular escape beat, Nodal premature beat, Atrial escape, Unclassified.Total 1252 beats for training and testing Normal (200,200), PVC (200, 200), Fusion (200, 200) Normal, Fusion beat, Ventricular ectopic beat, Supra ventricular, Unknown beat. First 5 min for training and other 25 min of a signal for tetsing Normal (20, 40), Abnormal (20, 40) Normal (243), RBBB (110), LBBB (600), Paced beat(450). 50% beats for training and testing Normal, Abnormal. Total 21200 beats Normal (15,15), SB (15, 15), VT (6 ,6), Sinus arrhythmia (15, 15), APC (6, 6), Paced (10, 10), RBBB (10, 10), LBBB (10, 10), Atrial fibrillation (10, 10), Atrial flutter (9, 9) Normal (30, 15), Paced (30, 15), APB(30, 15)
D D
4 6
S R
150
2
S
D
8
R
al.
D
8
R
al.
D
3
R
F.Naima et al. (2009) D.Patra et al. (2010) A.Sadiq et al. (2013) H.Khorrami et al. (2010) M.Korurek et al. (2010) A.Khazaee (2013) E.Zeraatkar et al. (2011) M.Moavenian et al. (2010) S.Yu et al. (2008)
R.Acharya et (2004) N.Kannathal et (2003)
Normal (1285, 300), Fusion of beats (584, 150), VPB (796, 120), Unclassified (180, 80) Normal (37, 24000), APB (24, 238), VPB (25, 3939), RBBB (13,3739), LBBB (13, 6771), Paced beat (13, 1751) Positive: Normal, LBBB, RBBB, Negative: Ventricular ectopic beats, PVC, Fusion of ventricular and normal. 150 beats from first 5 min for training and other 25 min for testing Normal (60, 30), LBBB (28, 14), PVC (45, 25), Atrial fibrillation (30, 25), Ventricular fibrillation (28, 21), Complete heart block-CHB (28, 21), Ischaemic cardiomyopathy (30, 18), Sick sinus syndrome (30, 18) Normal (28, 14), LBBB (60, 30), PVC (45, 25), Atrial fibrillation (30,20), Ventricular fibrillation (28, 21), CHB (28, 21), Ischaemic cardiomyopathy (30, 18), Sick sinus syndrome (30, 18) Normal, Abnormal: RBBB, LBBB, Paced, PVC, Life threatening: Sick sinus syndrome, Ischemic heart diseases, Ventricular vibrillation beat. 600 beats for training and 400 beats for testing
V. ECG CLASSIFICATION This section discusses about different ECG databases, feature extraction techniques and ECG classification using neural network. A. ECG Database Datasets used by researchers for ECG arrhythmia classification are: UCI Arrhythmia dataset [35] and MIT-BIH arrhythmia dataset (mitdb) [36]. The MIT-BIH database contains 48 recordings (i.e. 100 to 109, 111 to 119, 121 to 124, 200 to 210, 212 to 215, 217, 219 to 223 and 228 to 231 records). Each record has duration of 30 minutes and includes two leads namely modified limb lead II (MLII) and one out of the modified leads V1, V2, V4 or V5. The database contains more than 109000 beats which are individually labeled, belonging to one of possible 15 beat types. The database contains three files namely signal.dat, annotation.atr and header.hea. The signal.dat binary file contains the ECG signal. The annotation.atr file describes events within the recording such as heart beats. For converting signal.dat and
S B N S B B B S B B
B B S B S
B B B B N
N S
annotation.atr into .txt form, online PhysioBank service i.e. PhysioBank ATM is available [37]. B. Feature extraction technique Feature extraction techniques used by researchers are DWT [5, 8], CWT [8], DCT [8], Db4 [6, 10], Pan-Tompkins algorithm [14] etc. For feature extraction using wavelet, decomposition levels used are 2, 3, 4 or 8. Disadvantage of using wavelet is that as the decomposition level increases, complexity of feature extraction process increases and to remove noises with feature extraction, higher level of decomposition should be used. Pan-Tompkins algorithm is developed by Pan and Tompkins [38]. This basic algorithm covers 5 steps namely band-pass filtering, differentiation, squaring, moving window integration, and thresholds adjustment. Band pass filtering reduces noise from ECG signal. Derivative operator finds the high slopes that normally distinguish the R peak from other ECG waves and suppresses the low frequency components of P and T waves. Squaring operation is point by point squaring of ECG signal. It is used for further enhancing high frequency
components and suppressing the small differences arising from P and T waves. Integration sums the area under the squared waveform over a suitable interval. It extracts the slope of the R wave. Signal to noise ratio increases after the ECG signal has passed from the band pass filter. Therefore, threshold adjustment is done and sensitivity of the algorithm is improved. Advantages of using Pan-Tomkins algorithm compared to other available techniques for feature extraction are sensitivity and efficiency of Pan-Tompkins algorithm are more than 99% [38]. The computational efforts are also less. It includes noise removal and baseline wonder removal steps, so no need to use other techniques separately. C. Classification of ECG using neural network Many researchers have used different types of neural network for classification of ECG signals. Artificial neural networks (ANNs) are data driven, self adaptive, non-linear, fast, and accurate. It is also robust to noise and easily scalable. Advantages of ANN are: 1) it provides non-linear mapping between inputs and outputs using activation function such as sigmoid to solve non-linear problem such as classification of ECG signals. 2) It can achieve similar or better results than statistical or deterministic approaches. Statistical methods performs good for linear problems but it cannot generate good results for non-linear problem because statistical methods are developed based on the assumption of given linear time series. 3) ANN can adaptively model the lower frequencies of the ECG which are inherently non-linear. 4) ANN removes timevarying and nonlinear noise characteristics of ECG signal [39]. Problems with ANN are: 1) training algorithm of ANN is unable to ensure a global minimum is reached 2) it may not necessarily give optimal solution for the entire 12-lead ECG classification process. MLPNN, RBFNN, QNN, PNN etc. are used for ECG classification. All these NNs are static and feed-forward in nature and not having any delay or feedback loops and have time-series data as input like ECG signals. Using MLPNN, ECG signals are recognized and classified more accurately [3, 8, 9, 12, 28]. Accuracy of MLPNN increases with number of hidden neurons [25, 40]. MLPNN performs static mapping, there are no internal dynamics. To add dynamics, add static synaptic weights by dynamic connections or add recurrent loops in the hidden layer. In MLPNN, sometimes overfitting problem may occur. To overcome problem of overfitting we need early stopping criteria. MLPNN trained with back propagation suffers from slow convergence to local and global minima and from random setting of initial values of weights, which may makes poor mapping of inputs to outputs [8]. In RBFNN, if new sets of input values fall outside all the existing classes then these input values could be classified as other class except the existing classes. In the design of an RBFNN it is necessary to set the values for the positions of the centers and the radius for each radial basis functions in hidden layer. RBFNN needs other techniques to find these centers like kmean or PSO technique for better accuracy or performance in ECG classification. With compare to MLPNN, RBFNN has slightly increased misclassification error. PNN needs small or no training except spread optimization [40]. Experiment of
PNN is limited to very small sets of data. Performance of PNN slightly decreased with the decrease of training data size [41]. 1) Performance measures for neural network classifier Many measures are used by practitioners for evaluation of classification accuracy of neural network. For beat classification, measures used are sensitivity, specificity, accuracy, MSE, Rate of Misclassification (RMC), and MCN etc. For signal classification, measures used are sensitivity, specificity, accuracy, ROC curve, MSE, training time etc. Moreover, confusion matrix is also used by researchers as a performance measure. Evaluation measures calculated from confusion matrix are Sensitivity, Specificity and Accuracy. Sensitivity is the ratio of true positive beats to total of true positive and false negative beats. Specificity is the ratio of true negative beats to total of true negative and false positive beats. The overall accuracy is the ratio of total number of true negative and true positive beats to total number of beats.
Sensitivit y = TP /(TP + FN )
(1)
Specificity = TN /(TN + FP )
(2)
Accuracy = TN + TP /(TN + FN + FP + TP )
(3)
VI.
CONCLUSION
In this paper, a detail survey of different issues in ECG classification, databases available for ECG, different preprocessing techniques available for noise removal, various classifiers available for classification of ECG data, and performance measures for evaluating accuracy of classifier are presented. From this survey we can conclude that ECG data are classified into two ways i.e. ECG beat classification and ECG signal classification. Only few researchers have worked on signal classification and it is more difficult compared to beat classification because normal ECG signal may differ for each person, sometimes one disease has dissimilar signs on different ECG signals and two distinct diseases may have approximately identical effects on ECG signals. For preprocessing and feature extraction, techniques mostly used are wavelets and algorithms such as Pan-Tompkins algorithm. Amongst these one should use algorithm for pre-processing and feature extraction compared to wavelet technique because for extracting features and removing noise using wavelet one should use higher level of decomposition. Moreover, a wavelet technique is more complex and time consuming. Moreover for classification, researchers have used different techniques like different neural networks and SVM. However, it is observed from survey that neural networks are prone to be good for ECG classification in terms of classification accuracy on training and test datasets. Most of the researchers have used sensitivity, specificity and accuracy to evaluate the performance of the classifiers. To calculate these performance measures one should use confusion matrix. Particularly for beat classification many researcher have used the MIT-BIH arrhythmia database and neural networks as a classifier. Moreover, it is observed from survey that MLPNN gives good accuracy for ECG beat classification.
References [1]
[2]
[3]
[4] [5]
[6]
[7]
[8]
[9]
[10]
[11]
[12]
[13]
[14]
[15]
[16]
[17]
[18]
[19]
Y. N. Singh, S. K. Singh, and A. K. Ray, "Bioelectrical signals as emerging biometrics: Issues and challenges," ISRN Signal Processing, pp. 1-13, 2012. M. E. A. Bashir et al., "Highlighting the current issues with pride suggestions for improving the performance of real time cardiac health monitoring," Inform. Technology in Bio-and Medical Informatics, ITBAM, Springer Berlin Heidelberg, pp. 226-233, 2010. V. S. R. Kumari and P. R. Kumar, "Cardiac Arrhythmia Prediction using improved Multilayer Perceptron Neural Network," Research and Develop. (IJECIERD), vol. 3, no. 4, pp. 73-80, 2013. Wikipedia. (2014, October 2) [Online]. Available: http://en.wikipedia.org/wiki/Electrocardiography. A. Dallali, A. Kachouri, and M. Samet, "Classification of Cardiac Arrhythmia Using WT, HRV, and Fuzzy C-Means Clustering," Signal Processing: An Int. J. (SPJI), vol. 5, no. 3, pp. 101-109, 2011. A. Dallali, A. Kachouri, and M. Samet, "Fuzzy c-means clustering, Neural Network, wt, and Hrv for classification of cardiac arrhythmia," ARPN J. of Eng. and Appl. Sci., vol. 6, no. 10, pp. 112-118, 2011. S. Ayub and J. P. Saini, "ECG classification and abnormality detection using cascade forward neural network," Int. J. of Eng., Sci. and Technology, vol. 3, no. 3, pp. 41-46, 2011. H. Khorrami and M. Moavenian, "A comparative study of DWT, CWT and DCT transformations in ECG arrhythmias classification," Expert syst. with Applicat., vol. 37, no. 8, pp. 5751-5757, 2010. D. Patra, M. K. Das, and S. Pradhan "Integration of FCM, PCA and neural networks for classification of ECG arrhythmias," IAENG Int. J. of Comput. Sci., vol. 36, no. 3, pp. 24-62, 2010. F. A. Naima and A. A. Timemy, "Neural network based classification of myocardial infarction: a comparative study of wavelet and fourier transforms," pp. 337-351, 2009. A. Khazaee, "Heart Beat Classification Using Particle Swarm Optimization," Int. J. of Intelligent Syst. and Applicat. (IJISA), vol. 5, no. 6, pp. 25-33, 2013. M. Moavenian and H. Khorrami, "A qualitative comparison of artificial neural networks and support vector machines in ECG arrhythmias classification," Expert Syst. with Applicat., vol. 37, no. 4, pp. 3088-3093, 2010. A. Vishwa, M. K. Lal, S. Dixit, and P. Vardwaj, "Clasification of arrhythmic ECG data using machine learning techniques," Int. J. of Interactive Multimedia and Artificial Intell., vol. 1, no. 4, pp. 68-71, 2011. M. Korurek and B. Dogan, "ECG beat classification using particle swarm optimization and radial basis function neural network," Expert syst. with Applicat., vol. 37, no. 12, pp. 7563-7569, 2010. R. Ceylan, Y. Ozbay, and B. Karlik, "A novel approach for classification of ECG arrhythmias: Type-2 fuzzy clustering neural network," Expert Syst. with Applicat., vol. 36, no. 3, pp. 6721-6726, 2009. J. S. Wang, W. C. Chiang, Y. T. Yang, and Y. L. Hsu, "An effective ECG arrhythmia classification algorithm," Bio-Inspired Computing and Applicat, Springer Berlin Heidelberg, pp. 545-550, 2012. M. Vijayavanan, V. Rathikarani, and P. Dhanalakshmi, “Automatic Classification of ECG Signal for Heart Disease Diagnosis using morphological features,” Int. J. of Comput. Sci. and Eng. Technology (IJCSET), vol. 5, no. 4, pp. 449-455, 2014. S. M. Jadhav, S. L. Nalbalwar, and A. A. Ghatol, “Artificial Neural Network Models based Cardiac Arrhythmia Disease Diagnosis from ECG Signal Data,” Int. J. of Comput. Applicat., vol. 44, no. 15, pp. 8-13, 2012. V. K. Srivastava and D. Prasad, "Dwt-Based Feature Extraction from ecg Signal," American J. of Eng. Research (AJER), vol. 2, no. 3, pp. 4450, 2013.
[20] A. T. Sadiq and N. H. Shukr, "Classification of Cardiac Arrhythmia using ID3 Classifier Based on Wavelet Transform," Iraqi J. of Sci., vol. 54, no. 4, pp. 1167-1175, 2013. [21] N. P. Joshi and P. S. Topannavar, “Support vector machine based heartbeat classification,” Proc. of 4th IRF Int. Conf., pp. 140-144, 2014. [22] E. Zeraatkar et al., "Arrhythmia detection based on Morphological and time-frequency Features of t-wave in Electrocardiogram," J. of medical signals and sensors, vol. 1, no. 2, pp. 99-106 , 2011. [23] S. N. Yu and K. T. Chou, "Integration of independent component analysis and neural networks for ECG beat classification," Expert Syst. with Applicat., vol. 34, no. 4, pp. 2841-2846, 2008. [24] D. Joshi and R. Ghongade, “Performance analysis of feature extraction schemes for ECG signal classification,” Int. J. of Elect., Electron. and Data Commun., vol. 1, pp. 45-51, 2013. [25] M. K. Das and S. Ari, "ECG Beats Classification Using Mixture of Features" Int. Scholarly Research Notices, 2014. [26] X. Tang and L. Shu, "Classification of Electrocardiogram Signals with RS and Quantum Neural Networks," Int. J. of Multimedia and Ubiquitous Eng., vol. 9, no. 2, pp. 363-372, 2014. [27] J. A. Nasiri, M. Naghibzadeh, H. S. Yazdi, and B. Naghibzadeh, "ECG arrhythmia classification with support vector machines and genetic algorithm," 3rd UKSim European Symp. on Comput. Modeling and Simulation, IEEE, pp. 187-192, 2009. [28] Y. Ozbay, R. Ceylan, and B. Karlik, "A fuzzy clustering neural network architecture for classification of ECG arrhythmias," Comput. in Biology and Medicine, vol. 36, no.4, pp. 376-388, 2006. [29] M. K. Sarkaleh and A. Shahbahrami, "Classification of ECG arrhythmias using Discrete Wavelet Transform and neural networks," Int. J. of Comput. Sci., Eng. and Applicat. (IJCSEA), vol. 2, no. 1, pp. 113, 2012. [30] A. Daamouche, L. Hamami, N. Alajlan, and F. Melgani, "A wavelet optimization approach for ECG signal classification," Biomedical Signal Processing and Control, vol. 7, no. 4, pp. 342-349, 2012. [31] Z. Zidelmal, A. Amirou, D. O. Abdeslam, and J. Merckle, "ECG beat classification using a cost sensitive classifier," Comput. methods and programs in biomedicine, vol. 111, no. 3, pp. 570-577, 2013. [32] R. Acharya et al., "Classification of cardiac abnormalities using heart rate signals," Medical and Biological Eng. and Computing, vol. 42, no. 3, pp. 288-293, 2004. [33] N. Kannathal, U. R. Acharya, C. M. Lim, P. K. Sadasivan, and S. M. Krishnan, "Classification of cardiac patient states using artificial neural networks," Experimental & Clinical Cardiology, vol. 8, no. 4, pp. 206211, 2003. [34] A. Muthuchudar and S. S. Baboo, "A Study of the Processes Involved in ECG Signal Analysis," Int. J. of Scientific and Research Publications, vol. 3, no. 3, pp. 1-5, 2013. [35] UCI. (2014, November 10) [Online]. Available: https://archive.ics.uci.edu/ml/datasets/Arrhythmia. [36] Physionet. (2014, November 10) [Online]. Available: http://physionet.org/physiobank/database/mitdb/. [37] Physionet. (2014, November 20) [Online]. Available: http://www.physionet.org/cgi-bin/atm/ATM. [38] S. L. Pingale, "Using Pan Tompkin’s method, Ecg signal processing and dignose various diseases in Matlab," Proc. of IRF Int. Conf., pp. 57-61, 2014. [39] Q. Xue, Y. H. Hu, and W. J. Tompkins, "Neural-network-based adaptive matched filtering for QRS detection," IEEE Trans.on Biomedical Eng., vol. 39, no. 4, pp. 317-329, 1992. [40] S. N. Yu and Y. H. Chen, "Electrocardiogram beat classification based on wavelet transformation and probabilistic neural network," Pattern Recognition Lett., vol. 28, no. 10, pp. 1142-1150, 2007. [41] C. V. Banupriya and S. Karpagavalli, "Electrocardiogram Beat Classification using Probabilistic Neural Network, " Int. J. of Comput. Applicat. (IJCA), pp. 31-37, 2014.