2012 IEEE International Conference on Advanced Communication Control and Computing Technologies (ICACCCT)
Classification of ECG Waveform Using Feature Selection Algorithm S.Muthulakshmi1, K.Latha2 1 Post Graduate Scholar, Department of Computer Science and Engineering, Anna University of Technology Professor, Department of Computer Science and Engineering, Anna University of Technology, Tiruchirappalli, India
[email protected],
[email protected]
Abstract— The ECG classification problems have been solved by means of a methodology, which has the capability to enhance the ECG classification performance. This method reduces the computational complexity which mainly occurs during the feature selection. The computational requirements of exhaustive search method (those which test all possible subsets) increase exponentially with the number of features in the original set. The proposed system use particle swarm optimization for the selection of feature subset. PSO is attractive for feature selection, in that particle swarms will discover best feature combination as they fly within the best subset space. Some classifiers such as MLP, which start at random chosen point and then adjust weights to move in the direction. Although the training phase takes long time. Thus SVM is used for classification, which is based on local approximation strategy. It reduces the number of operations in learning mode and it is well suited for larger datasets. Keywords-ECG, Classification, Feature Selection (FS), Particle Swarm Optimization (PSO), Support Vector Machine (SVM).
I.
INTRODUCTION
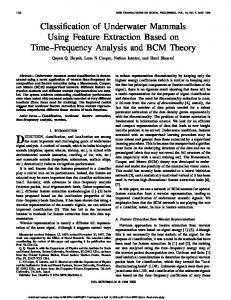
ECG is essentially responsible for patient monitoring and diagnosis. The investigation of ECG has been extensively used for diagnosing many cardiac diseases. The ECG is a realistic record of the direction and magnitude of electrical commotion that is generated by depolarization and repolarization of the atria and ventricles.one cardiac cycle in an ECG signal consist of P-QRS-T waves. Figure 1 shows a sample ECG signal. In the ECG signal P-wave occurs due to the atrial depolarization. It represents the activation of the upper chambers of the heart. QRS-complex occurs due to the depolarization of ventricles which triggers main pumping contraction. T-wave occurs due to the repolarization of ventricles. It represents the excitation of the ventricles. Some simple classifiers such as Linear Discriminant or Knearest neighbor have been used successfully up to our days. Other researchers have made use of more complex classifiers, based on the technique such as fractal analysis, chaotic modeling, bi-spectral coherence analysis or artificial neural networks. Multi-Layer Perceptron’s (MLP) are the most popular family of ANN with ECG classification, but the other ANN paradigms such as Fuzzy neural network, Radial basis
ISBN No. 978-1-4673-2047-4
network, Support Vector Machine (SVM) have been also widely applied.
Fig 1.A sample ECG signal showing P-QRS-T wave
A large number of possibilities have been proposed about which features to use to describe the ECG. Every single published paper proposes a new set of features or the new combination of existing features. ECG features based on different transforms, e.g. Wavelet transform (WT), Principle Component Analysis(PCA), Hermits functions as well as statistical features, e.g., mean, variances. Some feature selection algorithms such as sequential forward floating search (SFFS), sequential backward floating search (SBFS), Genetic algorithm (GA), and Particle swarm optimization (PSO) used to reduce the dimensionality of the classification problem. These methods evaluate the subset of available features and the best one is selected for application. The best subset contains the least number of dimensions that most contribute to applications performance; the remaining unimportant dimensions are discarded. The rest of this paper is structured as follow Section 2 gives a general idea of further improvement of earlier approaches in ECG classification. Section 3 concludes the paper with fewer discussions.
Organized by Syed Ammal Engineering College, Ramanathapuram ,Tamilnadu 176
2012 IEEE International Conference on Advanced Communication Control and Computing Technologies (ICACCCT)
II.
METHODOLOGY
Even considering that most approaches described in the literature use the same source for ECG recordings, there are several factors that render the comparison of these studies results almost impossible. Moreover the abstention of a realistic estimation about the real-world performance of the algorithms must also be regarded. In what follows, these problems are addressed and good practices to cope with them, which consequently have been also used in this study, are outlined. A. ECG Data In this work, all the ECG data have been obtained from the MIT-BIH Arrhythmia Database (MITDB), which includes the recordings of many life-threatening arrhythmias along with examples of normal sinus rhythm. The Association for the Advancement of Medical Instrumentation proposed a standard for the evaluation of ECG classifiers. The MITDB standard leaves 44 records. Prior to feature acquisition, the same processing in [1] was applied: first, non-causal filter is used in order to remove noise and baseline wander. ECG contaminants are classified as power line interference, contact noise, baseline drift, Quantization noise, signal processing artefacts. In this work non-causal filter is used to remove these noises from ECG signal. The working steps of non-causal filter are as follows: The ECG signal is loaded from the ASCII format to array for the display. Then the filter performs zero-phase digital filtering by processing the input ECG data in both the forward and reverse directions. After filtering the ECG signal in the forward direction, it reverses the filtered sequence and runs it back through the filter. The resulting sequence has precisely zero-phase distortion and double the filter order. Preprocessed signal will be displayed and its corresponding quality measures were calculated. The quality measures are such as PSNR and MSE. Afterward, QRS fiducial points were read from the MITDB annotation files. B. Feature Extraction Features related to the heartbeat intervals and ECG morphology was calculated separately for two ECG signals for each heartbeat. Features can be divided into the following categories. 1. Temporal features, which already proved in different studies to be most relevant. Some temporal features in ECG waveform are Previous RR, Current RR, Average RR, QRS duration, T-Wave duration, and P-Wave flag. 2. Morphological features, also previously assessed as being of great relevance, made the bulk of the feature set. Some of the morphological features are beat area, beat power, beat min, beat max, beat Max-Min ratio. 3. Statistical features completed the feature set, including different order moment-based indexes and histogram variance. Some of the statistical features are QRS
variance, QRS histogram variance, beat mean, beat variance. Wavelet based features will be extracted from ECG signal. Different standard wavelets have been tried and Daubechies wavelet (‘db4’) was found to be the most suitable for the analysis of ECG signals. Different abnormalities result in different changes in the coefficients. The wavelet transform is a convolution of the wavelet function ψ (t) with the signal x (t). Orthonormal discrete wavelets are associated with scaling function φ (t). The scaling function can be convolved with the signal to produce approximation efficient S. The discrete wavelet transform (DWT) can be written as
C. Feature Selection Particle Swarm Optimization is initialized with a population of random solutions, called ‘particles’. Each particle is composed of the following three vectors: The Xvector X= records the current position of the particle in the feature space. The P-vector P= records the location of the best solution found so far by the particle. The V-vector V= contains a gradient for which particle will travel in if undisturbed. Two fitness values calculated as follows: The X-fitness records the fitness of the X-vector. The P-fitness records the fitness of the P-vector. The particles can be seen as simple agents that fly through feature space and record the best solution that they have discarded. The particle moves from one location in search space to another by adding V-vector to the X-vector to get another X-vector.
Once a new Xi calculated means, then the particle evaluates its new location. If X-fitness is better than P-fitness, then Pi=Xi and P-fitness=X-fitness. The V-vector can be adjusted before adding it to X-vector as follows Vid = W*Vid +C1 *R1 (pi, best – pi) + C2*R2 (gi, best – pi) Xid = X id + Vid The acceleration constants c1 and c2 in above equation represent the weighting of the stochastic acceleration terms that pull each particle toward p best and g best positions. The following are the steps of PSO algorithm. 1. Initialization The velocity and position of all particles are randomly set to within pre-defined ranges. 2.
ISBN No. 978-1-4673-2047-4
Velocity Updating
Organized by Syed Ammal Engineering College, Ramanathapuram ,Tamilnadu 177
2012 IEEE International Conference on Advanced Communication Control and Computing Technologies (ICACCCT)
At each iteration, the velocities of all particles are updated according to:
hyper plane separating different classes is given by the relation, (WT, Ø(x) ) + b = 0
Vid = W*Vid+C 1*R1 (p best – pi) + C2*R2 (g best – pi) Where pi and vid are position and velocity of particle i respectively: p best and g best is the position with the ‘best’ objective value found so far by particle i and the entire population respectively; w is a parameter controlling the flying dynamics; R1 and R2 are random variables in the range [0, 1]; C1 and C2 are factors controlling the related weighting of corresponding terms 3. Position Updating Assuming a unit time interval between successive iterations, the positions of all particles are updated according to:
Where W={w1,w2,w3….wn};n is the number of attribute and b is a scalar, often refered to as a bias.Based on the Lagrangian`s formulation the decision function can be written as F(x) = ∑yiαixix + b0 A linear support vector machine is composed of a set of given support vectors z and a set of weights w. The computation for the output of a given SVM with N support vectors z1, z2,.. …zN and weights w1, w2… wN is then given by: F(X) = ∑ W (ZN, X) + b
After updating, pi should be checked and limited to the allowed range.
Using kernels, the original formulation for the SVM given SVM with support vectors z1, z2… ZN and weights w1, w2… wN is now given by:
4. Memory Updating Update p best, g best when the following condition is met
F(X) = ∑ WI k (ZN, X) + b. The solution of the discriminant function can be written as
p best = pi g best = gi
if f(pi) > f( p best) if f(gi) > f(g best)
Where f (x) is the objective function subject to maximization. 5. Termination Checking The algorithm repeats Steps 2 to 4 until certain termination conditions are met, such as a pre-defined number of iterations or a failure to make progress for a certain number of iterations. Once terminated, the algorithm reports the values of g best and f (g best) as its solution D. Classification Model Classification model is based on Support Vector Machine (SVM) classifier. A Support Vector Machine (SVM) is a supervised learning method that was first introduced by (Vapnik, 1999). It uses the nonlinear mapping to transform the original data into higher dimension. The input points are mapped to a high dimensional feature space, where a separating hyper-plane can be found. The feature vector of the signal is projected into the feature space. The algorithm is chosen in such a way as to maximize the distance from the closest patterns, a quantity which is called the margin. SVMs are learning systems designed to automatically trade-off accuracy and complexity by minimizing an upper bound on the generalization error, in a variety of classification problems; SVMs have shown a performance which can reduce training and testing errors, thereby obtaining higher recognition accuracy. SVMs can be applied to very high dimensional data without changing their formulation. The
ISBN No. 978-1-4673-2047-4
F(X) = ∑ α K (Xi, X) + b In this work SVM is used to classify the given heart beat into three different classes such as Normal, Heartbeat Failiure, and Partial epileptic. E. Performance Analysis The confusion matrix is a useful tool for analyzing how well the classifier can recognize tuples of different classes. The confusion matrix provides a complete description of any classification results. However the results are usually displayed using indices or factors that describe specific aspects of the classification. A mathematical description of these indices displayed in Table. It consist the following classes: normal (N), partial epileptic (P), heartbeat failure (H).
N
P
H
∑
N
XNN
XNP
XNH
ON
P
XPN
XPP
XPH
OP
H
XHN
XHP
XHH
OH
∑
AN
AP
AH
XTOT
Fig. 2 Confusion Matrix
Organized by Syed Ammal Engineering College, Ramanathapuram ,Tamilnadu 178
2012 IEEE International Conference on Advanced Communication Control and Computing Technologies (ICACCCT)
1. Relevant Factors True positives of I (TPI) = XII True negatives of I (TNI) = XTOT-OI-AJ +XII 2. Performance Measures Accuracy of I (AccI) = (TPI+TNI)/ (TPI +TNI+FPI +FNI) Sensitivity of I (SensI) = (TPI/OI) Specificity of I (SpecI) = (TNI/OI) Precision of I (PrecI) = TP/TP+FP III.
False positive of I (FPI) = AI-XII False negative of I (FNI) = OI-XII
[9] L. Molina, L. Belanche, and A. Nebot, “Feature selection algorithms: A survey and experimental evaluation,” in Proc. IEEE Int. Conf. Data Mining (ICDM), 2002, Dec. 9–12, pp. 306–313. [10] Xiangyang Wang a,*, Jie Yang a, Xiaolong Teng a, Weijun Xia b, Richard Jensen c “Feature Selection based on Rough Sets and Particle Swarm Optimization” [11] S.A.Subbotin,Al.A.Oleynik“PSO with Control of Velocity Change for Feature Selection”
CONCLUSION
This paper presents how the application of a suitable FS procedure can lead to the improvement of classifier’s performances and simultaneously reduce their complexity, which can be of great help to improve online ECG monitoring, especially in ambulatory settings. To this end, a method for ECG classification by using Particle Swarm Optimization algorithm has been proposed. PSO requires only primitive and simple mathematical operator, compared with SFFS it is computationally inexpensive in terms of both memory and runtime. SVM is based on the local approximation strategy and uses large number of hidden units. The great advantage of SVM approach is the formulation of its learning problem, leading to the quadratic optimization task. It greatly reduces the number of operations in the learning mode. It is well seen for large data sets, where SVM algorithm is usually much quicker. REFERENCES [1]
P. de Chazal, M. O’Dwyer, and R. Reilly, “Automatic classification of heartbeats using ECG morphology and heartbeat interval features,” IEEE Trans. Biomed. Eng., vol. 51, no. 7, pp. 1196–1206, Jul. 2004. [2] M. Llamedo and J. P. Martinez, “An ECG classification model based on multilead wavelet transform features,” in Proc. Comput. Cardiol., 2007, vol. 34, pp. 105–108. [3] M. Llamedo and J. P. Martinez, “Heartbeat classifier using feature selection with database generalization criteria,” IEEE Trans. Biomed. Eng., vol. 58, no. 3, pp. 616–625, Mar. 2011. [4] Tanis Mar ,Sebastain Zaunseder,Juan Pablo Martinez,Mariano Llamedo and Rudiger “Optimization of ECG Classification by Means of Feature Selection”. [5] P. Pudil, F. Ferri, J. Novovicova, and J. Kittler, “Floating search methods for feature selection with nonmonotonic criterion functions,” in Proc. 12th IAPR Int. Pattern Recognit. Vol. 2—Conf. B: Comput. Vis. Image Process Conf., Oct. 9–13, 1994, vol. 2, pp. 279–283. [6] Z. Dokur and T. Olmez, “ECG beat classification by a novel hybrid neural network,” Comput. Methods Progr. Biomed. vol. 66, no. 2–3, pp. 167– 18, Sep. 2001. [7] K.Minami, H. Nakajima, and T. Toyoshima, “Real-time discrimination of ventricular tachyarrhythmia with Fourier-transform neural network,” IEEE Trans. Biomed. Eng., vol. 46, pp. 179–185, Feb. 1999. [8] I. Jekova, G. Bortolan, and I. Christov, “Assessment and comparison of different methods for heartbeat classification,” Med. Eng. Phys., vol. 30, no. 2, pp. 248–257, Mar. 2008.
ISBN No. 978-1-4673-2047-4
Organized by Syed Ammal Engineering College, Ramanathapuram ,Tamilnadu 179