CLASSIFICATION OF FETAL HEART RATE USING SCALE DEPENDENT FEATURES AND SUPPORT VECTOR MACHINES George Georgoulas, Chrysostomos Stylios+ and Peter Groumpos Laboratory for Automation & Robotics, University of Patras, 26500, Patras, Greece Tel: +30 2610997293 Fax: +30 2160997309 Email:
[email protected] +
Dept. of Communications, Informatics and Management, TEI of Epirus, 47100 Kostakioi, Artas, Greece, Fax +302681075839 Email:
[email protected]
Abstract: One new approach for the problem of feature extraction and classification of Fetal Heart Rate signal is introduced in this paper. It considers the use of the Discrete Wavelet Transformation to extract scale-dependent features of Fetal Heart Rate (FHR) signal and the use of Support Vector Machines for classification of FHR. The proposed methodology is tested on real data acquired just before delivery. The results proved the viability of the approach and its potential for further application by achieving an overall classification performance of 90%. Copyright © 2005 IFAC Keywords: Discrete Wavelet Transform, Support Vector Machines, Fetal Heart Rate.
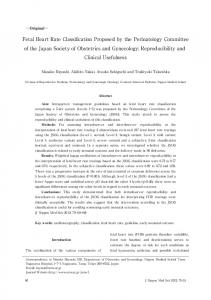
1. INTRODUCTION Fetal Heart Rate (FHR) is a physiological signal, reflecting the fetus condition and, as that, it has great importance, as it is an indication of fetus condition. Electronic Fetal Monitoring refers to the continuous recording and monitoring of FHR and Uterine Activity (UA), also known as cardiotocogram (CTG). EFM has been widely used for antepartum and intrapartum fetal surveillance. Fig.1 shows a typical CTG with the FHR signal in the upper part and the UA in the lower part of the figure. During the crucial period of labour, CTG is used as the main screening test on fetal acid base balance (Geijn, 1996). The beat-to-beat variation of FHR reflects the time varying influence of the fetus’ autonomic nervous system and its components (sympathetic, parasympathetic branch) (Parer, 1997) and it is thought to be an indicator of the fetal well being. The conventional use of EFM involves the eye inspection of CTG by experienced obstetricians. However, the Dublin randomized trial has revealed an increase in caesarean sections for cases monitored using FHR monitoring during the intrapartum period (McDonald, et al., 1985). In addition, studies of FHR reliability have shown significant inter-observer and intra-observer variation in tracing interpretation (Bernardes et al., 1997).
Fig. 1. A typical CTG recording, with the FHR in the upper part and the UA in the lower part This inconsistency in interpretation and the increase of false positive diagnosis have driven the investigation and the need of developing computerized analysis methods for FHR. This investigation is helped by the technological advances in computers, along with advanced signal processing and machine learning methods. Therefore, many researches have proposed automated methods and systems capable of analyzing the FHR (Arduini, et al., 1993; Berdinas, et al., 2002; Bernardes, et al.,
1991; Magenes, et al., 2000; Cazares, et al., 2001; Chung, et al., 1995; Dawes, et al., 1995; Jezewski, and Wrobel, 1993; Krause, 1990; Maeda, et al., 1990; Mantel, et al., 1990a; Mantel, et al., 1990b; Salamelekis, et al., 2002; Skinner, et al., 1999; Taylor, et al., 2000). Most of the research efforts aimed to propose methodologies, not only to record, store and display the FHR, but also to classify FHR and produce indices alerting when the fetus is on the verge of severe compromise (metabolic acidosis that may lead to cerebral palsy or even death). The current proposed approach is motivated by the scientific belief that the FHR signal conveys much more information than what is usually interpreted by obstetricians. Thus, we propose a novel method to detect fetuses suspicious of developing acidemia, based on features extracted mathematically from the FHR signal. The core of the proposed method is the use of Discrete Wavelet Transform (DWT) for the extraction of a suitable set of scale dependant features and the use of a Support Vector Machine (SVM) classifier, for the categorization of FHR, based on the extracted features. Wavelets are very appealing tools that are used in many biomedical applications (Unser and Aldrubi, 1996), and have been used with considerable success for the analysis of the inter-beat intervals of heart rate of adults (Thuner et al., 1998;Ivanov et al., 1996). Wavelets have also been used for the analysis of FHR during the second stage of labour (Salamalekis et al., 2002). The most appealing characteristic of wavelets is that they can decompose a signal into a number of scales, each scale representing a particular “coarseness” of the signal under study (Mallat, 1998). SVMs are a recently developed learning machine method and they have proved highly successful in a number of classification studies (Burges, 1998, Veropoulos et al., 1999). They are very useful for real-life and difficult classification problems due to their intrinsic ability to generalize well for unknown data even when the training set is quite small. This paper is structured as follows: In section 2 a brief mathematical introduction is given regarding the DWT and the SVMs. Section 3 presents the overall proposed methodology for FHR classification. Section 4 discusses the results of applying the proposed methodology to a given data set. Section 5 concludes the paper and gives some future directions.
2. MATHEMATICAL METHODS AND TOOLS 2.1 Wavelet Transform The wavelet transform has been found to be particular useful for analyzing signals that can be described as aperiodic, noisy, intermittent, transient
and so on. As a result, Wavelet introduction and utilization as an analysis tool for biomedical signal processing came naturally (Unser and Aldrubi 1996). The wavelet transform can be described in terms of (an inner-product) representation of a signal with respect to a specific family of (atomic) functions that are generated by a single analyzing function, which is called the “mother” wavelet ψ (t ) . Translations and dilations of this “mother” (or analysing) wavelet (Equation 1) are used to transform the signal into another form (time-scale representation).
ψ a ,b ( t ) =
1 ⎛ t −b ⎞ ψ⎜ ⎟ a ⎝ a ⎠
(1)
In the case of discrete wavelet transform, the dilation and translation parameters α, b are restricted only to discrete values leading to the following expression: ⎛ t − nb0 a0m 1 ψ⎜ m ⎜ a0m ⎝ a0
ψ m,n (t ) =
⎞ ⎟ ⎟ ⎠
(2)
For practical purposes the simplest and most efficient discretization comes by choosing a0 = 2 and b0 = 1 (dyadic grid arrangement)
ψ m , n (t ) =
1 2
⎛ t − n 2m ⎞ ⎟= m ⎟ ⎝ 2 ⎠
ψ ⎜⎜ m
2 − m / 2ψ ( 2− m t − n )
(3)
The wavelet coefficients for the time-scale representation of a continuous signal x (t ) are: ∞
Tm,n = ∫−∞ x (t )ψ *m,n (t ) dt
(4)
If we consider a discrete signal x[i ], i =0,..., M −1 , the coefficients are given by: Tm,n = 2
− m / 2 M −1
∑ x[i ]ψ ( 2− m i −n )
(5)
i=0
If the discrete dyadic grid wavelets are chosen to be orthonormal, the information stored in a wavelet coefficient Tm ,n is not repeated elsewhere. Therefore, the information represented at a certain scale m is disjoint from the information at other scales. Smaller scales correspond to higher frequency components (speaking in Fourier terms). As it is obvious, different mother wavelets give rise to different classes of wavelets, and thus the behavior of the decomposed signal can be quite different. However, according to (Thuner et al., 1998), in their work involving the analysis of heartbeat intervals, the results obtained were similar experimenting with different types of mother wavelets. In this work we experimented with a variety of mother wavelets. As it will be presented in section 4, the most satisfactory results were achieved using symmlets (Daubecies, 1994) (Fig. 2).
on the wrong side of a separating nonlinear hyperplane in the feature space. The dual problem, which has to be solved, is the maximization of: l
l
(9)
1 ai − ∑ ai a j yi y j φ ( xi ) ⋅ φ ( x j ) ∑ 2 i , j =1 i =1
Subject to
N
∑i =1 yiαi = 0
(10)
where 0 ≤ α i ≤ C , i = 1, 2, ..., l The discriminating function is finally given by: Fig. 2. Symmlet mother wavelet with 13 vanishing moments
2.2 Support Vector Machines SVMs are a new family of learning machines. The main idea behind SVMs, when dealing with a pattern classification problem, is to preprocess the data in order to represent patterns in a high dimensional space – typically much higher than the original input space- via a nonlinear mapping φ ( ⋅) and perform the categorization in that space. In the case of linear separable patterns, the training of a SVM consists of finding the “optimal” hyperplane; that is the one with the maximum margin of separation between the classes. However, real life problems are rarely separable and, so, there always exists a number of misclassifications. Formally S=
speaking,
{( xi , yi )}i=1 , l
given
a
training
where each point xi is a
set
which one of the classes the point xi belongs to, the goal is to find a discriminating function of the form:
(
where
)
(6)
φ ( x ) = (φ1 ( x ) ,..., φm ( x ) ) corresponds to a p
mapping from ℜ to the higher dimensional space
ℜ m ( m > p ). The search for the “optimum” hyperplane leads to optimization problem:
the
following l
quadratic
ξi ∑ i =1
(7)
Subject to yi w ⋅φ ( xi ) + b ≥ 1 − ξi
(8)
Minimize
1 2
(
T
w ⋅w +C
)
⎞
l
∑
yiα i φ ( xi ) ⋅ φ ( x ) + b ⎟
⎝ i =1
(11)
⎠
The points for which ai >0, are called Support Vectors. They are the most difficult patterns to classify and are a small portion of the training set. If the nonlinear mapping function is chosen properly, the inner product in the feature space can be written in the following form:
( )
φ ( xi ) ⋅ φ x j
= K ( xi , x j )
(12)
where K is a kernel function. A kernel function is a function in input space and, therefore, we could not perform explicitly the nonlinear mapping φ ( ⋅) . This means that instead of calculating the inner products in the feature space, one can directly calculate it using the kernel function K (xi , x j ) (Burges, 1998).
p-
dimensional vector, the input pattern for the i-th example, and yi ∈ {−1,1} is a label that specifies to
f ( x ) = sign w ⋅ φ ( xi ) + b
⎛
f ( x ) = sign ⎜
ξi ≥ 0 , i = 1, 2, ..., l And φ ( x ) = (φ1 ( x ) ,..., φm ( x ) )
where ξi ≥ 0 are called slack variables that measure the deviation of a data point from the ideal condition of pattern separability. The parameter C determines the influence of training data points that will remain
3. FEATURE EXTRACTION, CLASSIFICATION METHODOLOGY AND EXPERIMENTS The experimental data set consists of 40 FHR signals. The FHR signal are divided in two 2 subsets depending on whether the fetus has developed acidemia or not. Acidemia was determined for this study based on the value of umbilical artery pH, where the boundary is set to 7.1. Therefore, in the first subset, we included those signals that belonged to fetuses with umbilical artery blood pH less than 7.1 and in the second subset, those that belonged to fetuses with umbilical artery blood pH more than 7.2. In the data set we didn’t include fetuses with umbilical artery pH in the range (7.1, 7.2). All cardiotocographic records had been acquired during the final stage of the labour and, in fact, as close as possible to delivery. This means that the data sets were time-biased free and a direct association could be made between the segment of the signal used and the fetal outcome. The recordings had durations ranging for 20 minutes to more than 1 hour. 3.1 Artifact removal FHR is a very noisy signal with a lot of spiky artifacts and even periods of missing data due to the movement of the baby and the stress induced during
the labour, leading to the displacement of the transducer used for its acquisition. This kind of noise cannot be eliminated in the source and it is always present in cardiotocographic records. Therefore, before any further processing, it is necessary to eliminate the noise from FHR so we implemented a noise removal algorithm for FHR (Fig. 3) (Bernardes, et al., 1991).
where N is the number of coefficients at the corresponding scale m and
Tm,n
m
is the sample
mean of the wavelet coefficients at scale m. Therefore, for each signal we extracted 6 values (the scale dependent standard deviation) for each scale of decomposition. Those 6 values-features were used as inputs to the SVM classifier. 3.4 Classification As it was explained in subsection 2.2, different learning SVM can be constructed with quite different non-linear decision surfaces based on how the innerproduct kernel is generated. In these experiments we used only RBF learning machines, where the kernel function is defined:
Fig. 3. Data before and after the removal of artifacts.
⎛ 1 x − xi K ( x, xi ) = exp ⎜ − ⎝ 2σ 2
2⎞
⎟ ⎠
(14)
where the width σ 2 is specified a priori by the user and is common for all the kernels.
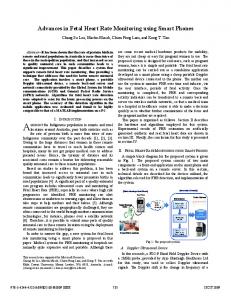
3.2 Data segmentation In this work we focused on FHR recordings as close as possible to delivery and for segments of relative small duration because our aim was to use global scale dependent statistics, and, in particular, the scale dependant standard deviation. Therefore, we used time windows ranging from 1 minute to 15 minutes. It must be mentioned that in some of the recordings the final 1-2 minutes had to be excluded (before the artifact removal stage had taken place) because the FHR signal was totally obscured by noise. 3.3 Feature extraction For each FHR signal and for the corresponding time segment we carried out discrete wavelet transform up to scale 6 (Fig. 4).
In (eq.7), the parameter C is a user-defined variable, which controls the trade-off between the complexity of the machine and the number of non-separable points. In order to select the optimal value, different combinations of values for the parameters C and σ were tested using a training validation procedure, meaning that we trained the classifier using a fraction of the data (training set) and we employed the remaining of the data (validation set) to evaluate the performance of the SVM for different configurations. To evaluate the performance of the classifier we divided the 40 cases into 4 (non-overlapping) subsets, each one consisting of 5 sets from the “normal” and 5 from the “risk” group. The SVM classifier was trained on all subsets except for one, and the validation performance was assessed on the subset left out. We repeated this procedure 5 times, each time using a different subset for testing.
4. EXPERIMENTAL RESULTS
Fig.4. FHR signal on the upper part and the plot of the six wavelet coefficients at different scales. For each scale we calculated the corresponding standard deviation of the distribution of wavelet coefficients, using (eq.13):
⎡ 1 N −1 ⎡ ⎡ σ ( m) = ⎢ ∑0 ⎢⎢⎣Tm,n − Tm,n N − 1 ⎣ ⎣
1
2 ⎤ ⎤⎤ ⎥ ⎥ ⎦ ⎦⎦ m⎥ 2
(13)
The best classification performance was achieved using symmlet wavelet with 13 vanishing moments and a time window for the computation of the wavelet coefficients equal to 3 minutes. Fig. 5 illustrates the classification performance as a function of the duration of each FHR signal. For a second series of experiments, we used sliding windows of 3 minutes (with 2 minute overlap) to examine how the classification performance changes, as we are moving away from the time of delivery. Fig. 6 presents the classification performance for different signal durations; the best classification performance is achieved when we are as close to the delivery as possible. This is something that we
expected as the last minutes of the delivery are the most stressful for the baby and they are the more likely to reflect a potential compromise.
Fig.5 Classification performance for different time windows.
Fig.6 Classification performance for a 3-minute sliding window. In this work we experimented with the use of SVMs and scale dependant features as an advanced automated methodology to discriminate between fetuses with “normal” umbilical artery pH values and those who have a decreased umbilical artery pH and are suspicious of developing metabolic acidosis. We achieved classification performance of 90% with a very good balance between normal and fetuses at risk (90% for both groups and for an RBF kernel with σ=1 and C=4). In a similar work by Thuner (Thuner et al., 1998) it is claimed that based on the standard deviation corresponding to 16-32 heartbeats, (i.e. using the information contained in scales 4 and 5), they managed to achieve complete separation between the class of healthy adults and adults with cardiac pathology. In our experiments no single feature (or even combination of features) was found capable to completely discriminate the two classes. Moreover, in the work of Salamalekis (2002) only scales 2-4 were used. However, in our experiments we achieved the best classification performance using all six features. 5. CONCUSIONS Even though the proposed methodology seems to perform quite well, some issues have to be
considered. First of all, the indices used to discriminate normal fetuses from those which may at risk is not a gold standard -It is known that babies with severe acidosis (pH 7.0 or less) will subsequently be normal in a percentage of 90%. However, these can be considered immediate outcomes that one would prefer to avoid (Parer, 1997). Furthermore, there exist certain other capabilities offered by the wavelet transform that can be used in the future. By using global statistics we exploit only the scale property of the wavelet transform and we do not take into account the evolution of this nonstationary phenomenon. In fact, by using a sliding window we implicitly investigated the concept of time but we still do not investigate the time dependencies and possible transitions from a normal state to a risk one). In conclusion, the present results are slightly improved compared to previous works (Georgoulas et al., 2004a; Georgoulas et al., 2004b). They are comparable to those reported by other similar approaches (Salamalekis et al., 2002) where they achieved an overall classification rate of 95% using a cut-off value of 7.2 for the umbilical artery pH but this classification was slightly unbalanced since the classification rate for fetuses with pH7.2 was 97.9%. However, the fact that we did not include cases with umbilical artery pH in the range (7.1, 7.2) makes it a bit risky to directly compare our approach with the others found in the literature. In light of all the above findings, however, the proposed method is promising and it still has to be tested using a bigger data set before safer conclusions can be drawn. ACKNOWLEDGMENTS The authors would like to thank Prof. João Bernardes, Dep. of Gynecology and Obstetrics, Porto Faculty of Medicine, Porto, Portugal for providing us with the fetal heart data collected within the Research Project POSI/CPS/40153/2001, from Fundação para a Ciência e Tecnologia, Portugal. This research work has partially supported by the joint research project “Development of advanced navigation system for mobile robot based on Fuzzy Cognitive Maps” under the Greek-Russian bilateral cooperation agreement, funded by Greek GSRT REFERENCES Arduini, D., G. Rizzo, G. Piana, A. Bonalumi, P. Brambilla and C. Romanini (1993). Computerized Analysis of Fetal Heart Rate: I. Description of the System (2CTG). J. Mat.Fetal Invest., 3, 159-163. Berdinas, B. G., A. A. Betanzos and O. F. Romero (2002). Intelligent analysis and pattern recognition
in cardiotocographic signals using a tightly coupled hybrid system. Artif. Intelligence, 136, 127. Bernardes, J., C. Moura, J.P.M. de Sa and L.P. Leite (1991). The Porto system for automated cardiotocographic signal analysis. J. Perinat. Med., 19, 61-65. Bernardes, J., A. C. Pereira D. A. de Campos, H. P. Van Geijn, L.P. Leite (1997). Evaluation of interobserver agreement of cardiotocograms. Int J. Gynecol Obst., 57(1), 33-37. Bernardes, J., D. A. de Campos, A. C. Pereira, L.P. Leite and A. Garrido (1998). Objective computerized fetal heart rate analysis. Int. J. Gynecol. Obst., 62, 141-147. Burges, C. J. C. (1998). A Tutorial on Support Vector Machines for Pattern Recognition. Data mining and Knowledge Discovery, 2, 121-167. Chung, T. K. H., M. P. Mohajer, X. J. Yang, A. M. Z. Chang and D.S. Sahota (1995). The prediction of fetal acidosis at birth by computerized analysis of intrapartum cardiotocography. Br. J. Obstet. Gynaecol., 102, 454-460. Daubechies I. (1994) “Ten Lectures on wavelets” SIAM, Philadelphia, PA Dawes, G. S., M. Moulden, and C. W. Redman (1995). Computerized analysis of antepartum fetal heart rate. Amer. J. Obstet. Gynecol., 173(4), 13531354. Geijn, H. P. V. (1996). Developments in CTG analysis. Bailliers Clin. Obstet. Gynaecol., 10(2), 185-209. Georgoulas G., G. Nokas, C. Stylios and P. P. Groumpos (2004). Classification of Fetal Heart Rate during labour using Hidden Markov Models. In Proc. of IJCNN 2004 International Joint Conference on Neural Networks & Fuzzy Systems, 25-28 July 2004 Budapest (CD-ROM). Georgoulas G., C. Stylios, J. Bernades and P. Groumpos (2004). Classification of Cardiotocograms using Support Vector Machines. In Proc of 10th IFAC Symposium on LSSs: Theory and Applications (LSS’04), 26-28 July 2004, Osaka, Japan (CD-ROM). Haykin,S. (1999). Neural Networks: A Comprehensive Foundation. 2nd ed. Englewoo Cliffs, NJ, Prentice Hall. Ivanov P. C., M.G. Rosenblum, C.K. Peng, C.K. Peng, J Mietus, S. Havlin, H.E. Stanley, and A.L. Goldberger (1996). Scaling behaviour of heartbeat intervals obtained by wavelet-based time series analysis. Nature, 383, 323-327. Jezewski J., K. Horoba, A. Gacek, J. Wrobel A. Matonia and T. Kupka, (2003) Analysis of nonstationarities in fetal heart rate signal, Inconsistency measures of baselines using acceleration/deceleration patterns. in Proc. of 7th ISSPA, 34-38. Krause, W. (1990). A computer aided monitoring system for supervision of labour. In: Computers in perinatal medicine (K. Maeda (Ed)), pp. 103-111. Elsevier Science Publishers, Amsterdam, The Netherlands.
McDonald, D., A. Grant, M. Sheridan-Pereira, P. Boylan and I. Chalmers (1985). The Dublin randomized controlled trial of intrapartum fetal heart rate monitoring. Am. J. Obstet Gynecol., 152, 524-39. Maeda, K. (1990). Computerized analysis of cardiotocograms and fetal movements. Bailliers Clin. Obstet. Gynaecol., 4(4), 1797-813. Magenes, G., M.G Signorini and D. Arduini (2000). Classification of cardiotocographic records by neural networks. D. Neural Networks, In Proceedings of the IEEE-INNS-ENNS International Joint Conference 3, 637-641. Mallat S (1989). A theory for multiresolution signal decomposition: the wavelet representation. IEEE Trans. Pattern Anal. Machine Intell., 11(7), 674793. Mantel, R., H.P. van Geijn, F.J.M Caron, J. M. Swartjes, E. E. van Woerden and H. W. Jongsma (1990a). Computer analysis of antepartum fetal heart rate: 1. Baseline determination. Int. J. Biomed. Comput., 25(2), 261-272. Mantel, R., H.P. van Geijn, F.J.M Caron, J. M. Swartjes, E. E. van Woerden and H. W. Jongsma (1990b). Computer analysis of antepartum fetal heart rate: Detection of accelerations and decelerations. Int. J. Biomed. Comput., 25(2), 273286. Parer, J. T. (1997). Handbook of fetal heart rate monitoring. Philadelphia, Pennsylvania: W. B. Saunders Company. Salamalekis, E., P. Thomopoulos, D. Giannaris, I. Salloum, G. Vasios, A. Prentza and D. Koutsouris (2002). Computerised intrapartum diagnosis of fetal hypoxia based on fetal heart rate monitoring and fetal pulse oximetry recordings utilising wavelet analysis and neural networks. Br. J. Obstet. Gynaecol., 109(10), 1137-1142. Skinner, J. F., J. M. Garibaldi and E. C. Ifeachor, (1999). A Fuzzy System for Fetal Heart Rate Assessment. In Proc of the 6th Fuzzy Days Conference, Dortmund, Germany, 20-29. Taylor, G. M., G. J. Mires, E. W. Abel, S. Tsantis, T. Farrell, P. F. W. Chien and Y. Liu (2000). The development and validation of an algorithm for real time computerized fetal heart rate monitoring in labour. Br. J. Obstet. Gynaecol., 107, 11301137. Thuner S., M. C Feurstein., and M.C Teich (1998) Multiresolution wavelet analysis of heatbeat intervals discriminates healthy patients from those with cardiac pathology. Physical Review Letters, 80(7), 1544-1547. Unser M., and A. Aldrubi (1996). A Review of Wavelets in Biomedical Applications. Proceedings of the IEEE, 84(4), 626-638. Veropoulos, K., Cristianini, C. Campbell (1999). The Application of Support Vector Machines to Medical Decision Support: A Case Study. Proceedings of the ECCAI Advanced Course in Artificial Intelligence.