sensors Article
Classification of Horse Gaits Using FCM-Based Neuro-Fuzzy Classifier from the Transformed Data Information of Inertial Sensor Jae-Neung Lee 1 , Myung-Won Lee 1 , Yeong-Hyeon Byeon 1 , Won-Sik Lee 2 and Keun-Chang Kwak 1, * 1
2
*
Department of Control and Instrumentation Engineering, Chosun University, 375 Seosuk-dong, Gwangju 501-759, Korea;
[email protected] (J.-N.L.);
[email protected] (M.-W.L.);
[email protected] (Y.-H.B.) Yudo-Star Co., ltd. 415, Cheongneung-Daero, Namdong-Gu, Incheon 405-817, Korea;
[email protected] Correspondence:
[email protected]; Tel.: +82-62-230-6086
Academic Editor: Vittorio M. N. Passaro Received: 29 February 2016; Accepted: 3 May 2016; Published: 10 May 2016
Abstract: In this study, we classify four horse gaits (walk, sitting trot, rising trot, canter) of three breeds of horse (Jeju, Warmblood, and Thoroughbred) using a neuro-fuzzy classifier (NFC) of the Takagi-Sugeno-Kang (TSK) type from data information transformed by a wavelet packet (WP). The design of the NFC is accomplished by using a fuzzy c-means (FCM) clustering algorithm that can solve the problem of dimensionality increase due to the flexible scatter partitioning. For this purpose, we use the rider’s hip motion from the sensor information collected by inertial sensors as feature data for the classification of a horse’s gaits. Furthermore, we develop a coaching system under both real horse riding and simulator environments and propose a method for analyzing the rider’s motion. Using the results of the analysis, the rider can be coached in the correct motion corresponding to the classified gait. To construct a motion database, the data collected from 16 inertial sensors attached to a motion capture suit worn by one of the country’s top-level horse riding experts were used. Experiments using the original motion data and the transformed motion data were conducted to evaluate the classification performance using various classifiers. The experimental results revealed that the presented FCM-NFC showed a better accuracy performance (97.5%) than a neural network classifier (NNC), naive Bayesian classifier (NBC), and radial basis function network classifier (RBFNC) for the transformed motion data. Keywords: classification of horse gaits; neuro-fuzzy classifier; fuzzy c-means clustering; inertial sensor; horse riding coaching
1. Introduction The grades for quality of life in the Republic of Korea, Japan, Canada, and the US are 5.8, 5.9, 7.3, and 7.2, respectively, according to the National Statistical Office (NSO)’s report of 2015. This indicates that the quality of life in South Korea is low, as compared to other countries. To resolve this issue, the objective of the present study is to facilitate the introduction of horse riding in Korea, which would contribute to improving the quality of life through communication and sport. Horse riding involves all the movements of walking and running on horseback. It is known to be a gentlemanly sport that promotes an individual’s bodily balance, flexibility, and courage while on horseback. The sport constitutes keeping in step with a living creature, not a machine. Therefore, it is important to pay special attention to safety and the mutual balancing of the horse and rider. Indeed, although it is well known that “riding horses is good” few learn how to ride a horse. This sport has a good influence on posture, bodily growth and the shape of the body, and emotional stability. In addition, the beneficial Sensors 2016, 16, 664; doi:10.3390/s16050664
www.mdpi.com/journal/sensors
Sensors 2016, 16, 664
2 of 18
effects on weight management and the prevention of spinal disk damage have been highlighted. Reciprocal communication plays a significant role in horse riding, unlike other sports. Horse riding is considered to be of such high quality that it is called “a noble sport.” However, horse riding also requires coaching. The expensive coaching requirement makes the sport much more difficult for ordinary people to approach. However, unmanned coaching could reduce the financial burden and eventually help improve people’s life quality. The present study is designed to allow unmanned coaching through classifying horse gaits and recognizing the rider’s postures for calibration. Various studies have been conducted using inertial sensors, and wireless networking is suitable for effective horse riding coaching. Domestic studies on the effects of inertial sensors on the balance improvement of the elderly with dementia exist [1], as well as on reducing body weight [2], the proliferation of vascular smooth muscle cells [3], etc. Abroad, Luinge [4] proposed a precise method to measure human size using inertial and gyro sensors. Zhou [5] estimated human movements using inertial sensors. Lee [6] proposed a calibration method and sensor fusion for motion capture using an acceleration meter. Zhu [7] traced real-time movements. Venkatraman [8] investigated animal movements using a pattern recognition algorithm and neural network. Ghasemzadeh [9] proposed a golf swing training system. Mariani [10] assessed the walking of young and senior citizens. Jung [11] proposed a method for tracking upper body motions using inertial sensors. Song [12] proposed a practical calibration method of the MEMS (Micro Electro Mechanical Systems) gyroscope sensor. Wei [13] investigated MEMS calibration. Cao [14] examined the full swing in golf. Pyeong Gook [15] addressed smart shoes based on inertial sensors. Chan [16] developed a dancing training system for coaching. In the area of sports analysis and coaching using inertial sensors, a human motion acquisition system based on inertial sensors was implemented for self-coaching [17], a golf coaching system using human motion analysis was developed [18], a four joint-based motion capture system was studied for spinal disease protection [19], kinematic coaching analysis using wireless inertial sensors was proposed [20], tennis strokes were classified [21], and a golf training system was developed [22]. Although several studies have been conducted on using inertial sensors in various application areas [23–29], the research on automatic horse riding coaching through movement classification has not thus far been studied. In this paper, we present a method for designing a fuzzy c-means (FCM)-based neuro-fuzzy classifier (NFC) of the Takagi-Sugeno-Kang (TSK) type for the classification of four gaits (walk, sitting trot, rising trot, and canter) in three breeds of horse (Jeju, Warmblood, Thoroughbred). FCM clustering performs fuzzy partitioning such that a given data point can belong to several groups, with the degree of belongingness specified by membership grades between 0 and 1. This clustering is used in conjunction with a neuro-fuzzy classifier primarily to obtain knowledge of automatic fuzzy if-then rules. Here, the sensor data information obtained by the motion capture system in this study is transformed by a wavelet packet (WP) to provide dimensional reduction. Using a capture system, which includes two channel receivers, as well as a PC and server, a database of riders’ motions was constructed using the data collected from a motion capture suit to which inertial sensors were attached that was worn by the country’s top-level horse riding expert. Based on this database, an analysis of the rider’s practical movements is performed by calculating the elbow angle and the location of the hip. The calculated hip motion value is used to perform the classification of the horse’s gaits through the transformation by a WP. The experimental results obtained by the FCM-NFC are compared with those of the previous classification algorithms, such as a neural network classifier (NNC), naive Bayesian classifier (NBC), and radial basis function network classifier (RBFNC). In Section 2, the construction of an equestrian motion database, including motion analyzing techniques, is described. In Section 3, the classification algorithms for the original data and the data transformed by a WP are compared. Section 4 presents the study conducted on the characterization of horses’ gaits and classification, as well as the results. Finally, Section 5 contains the conclusion of this paper.
Sensors 2016, 16, 664 Sensors 2016, 16, 664
3 of 18 3 of 17
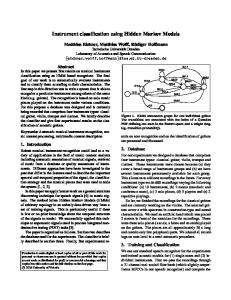
2. Construction 2. Constructionof ofHorse HorseRider’s Rider’sMotion MotionDatabase Database 2.1. Building the Horse Riding Motion Database 2.1.1. Motion Capture Motion capture in in digital form by by attaching a sensor to the capturerefers referstotorecording recordinghuman humanmovements movements digital form attaching a sensor to body or using infrared rays. We used wireless sensor network manufactured by Xsens Inc the body or using infrared rays. Wea used a wireless sensor network manufactured by (Enschede, Xsens Inc The Netherlands) for the motion in system horse riding environments. The inertial The sensor used (Enschede, Netherlands) for thecapture motionsystem capture in horse riding environments. inertial for constructing database is the a small and light of field) human orientation tracker that sensor used forthe constructing database is a9 DOF small(depth and light 9 DOF (depth of field) human provides drift-free data. This tracker consists data. of a three-axis acceleration orientation trackerkinematic that provides drift-free kinematic This tracker consistsmeter, of a three-axis gyroscope, three-axis geomagnetic sensor. Xsens’ inertial sensor portfolio provides accelerationand meter, three-axis gyroscope, andThe three-axis geomagnetic sensor. The Xsens’full-body, inertial wearable motion provides capture solutions. capture expert’s rider wears a suit including inertial sensor portfolio full-body,Towearable motion motion, capture the solutions. To capture expert’s motion, sensors based on wireless inertial sensors. The motion data are transmitted to a computer, which the rider wears a suit including inertial sensors based on wireless inertial sensors. The motion then data compares the data. suit is characterized by allowing real-time capture screen viewing, are transmitted to aThe computer, which then compares thecalibration, data. The suit is characterized by allowing simultaneous measurement, previously motion data readings. 1 shows a flow calibration, real-time captureand screen viewing,measured simultaneous measurement, andFigure previously measured chart of the rider’s motion capture system. motion data readings. Figure 1 shows a flow chart of the rider’s motion capture system.
Figure 1. 1. Flow Flow chart chart of of horse horse rider’s rider’s motion system. Figure motion capture capture system.
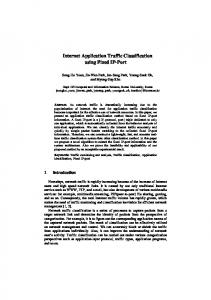
Data received through the motion capture system can be exported into BVH (bounding volume Data received through the motion capture system can be exported into BVH (bounding volume hierarchy) files. The BVH files can be stored in 3D file format using the open software BVHViewer. hierarchy) files. The BVH files can be stored in 3D file format using the open software BVHViewer. The 3D file contains the coordinate at every measurement site, stored according to frame. The 3D file contains the coordinate at every measurement site, stored according to frame. Twenty-eight Twenty-eight human measurement body sites are displayed as 28 points, as shown in Figure 2. In human measurement body sites are displayed as 28 points, as shown in Figure 2. In the data the data arrangement, lines form a frame and 84 rows represent the locations (x, y, and z) of the three arrangement, lines form a frame and 84 rows represent the locations (x, y, and z) of the three axes for axes for the 28 sites. the 28 sites. The 28 sites consist of hips, breast, breast 2, breast 3, breast 4, neck, head, head end, right nape, The 28 sites consist of hips, breast, breast 2, breast 3, breast 4, neck, head, head end, right nape, right shoulder, right elbow, right wrist, right wrist end, left nape, left shoulder, left elbow, left wrist, right shoulder, right elbow, right wrist, right wrist end, left nape, left shoulder, left elbow, left wrist, left wrist end, right hip, right knee, right ankle, right toe, right tiptoe, left hip, left knee, left ankle, left left wrist end, right hip, right knee, right ankle, right toe, right tiptoe, left hip, left knee, left ankle, left toe, and left tiptoe. Figure 2a shows a man wearing a suit to which 16 inertial sensors are attached toe, and left tiptoe. Figure 2a shows a man wearing a suit to which 16 inertial sensors are attached and and Figure 2b shows the human structure chart obtained by BVH software. Figure 2b shows the human structure chart obtained by BVH software.
Sensors 2016, 16, 664 Sensors 2016, 16, 664
4 of 17 4 of 18
Sensors 2016, 16, 664
4 of 17
(a)
(b)
Figure 2. (a) Motion capture(a) suit consisting of 16 inertial sensors; (b) BVH (b)human structure chart. Figure (a) Motion capture consisting 16 inertial sensors; (b) BVH human structure chart. Figure 2.Construction (a)2.Motion capture suit suit consisting of 16ofinertial sensors; (b) BVH human structure chart. 2.1.2. Database in Horse Riding Environment
Motions were acquired from a Horse horse riding expert who made one or two revolutions per gait 2.1.2. Database Construction in Riding Environment 2.1.2. Database Construction in Horse Riding Environment (walk, sitting trot, rising trot, canter) of an oval horse riding course 20 m in length and 10 m in Motions were acquired a horse riding expert made one or two revolutions Motions acquired fromfrom a horse riding who3who made onethe or two revolutions per per gait gait breadth whilewere wearing a motion capture suit.expert Figure shows database construction (walk, sitting trot, rising trot, canter) of an oval horse riding course 20 m in length and 10 (walk, sitting trot, rising trot, canter) of an oval horse riding course 20 m in length and 10 m in breadthm in environment. breadth wearing a suit. motion capture suit. Figure 3construction shows theenvironment. database construction while wearingwhile a motion capture Figure 3 shows the database environment.
Figure Figure3.3.Database Databaseconstruction constructionenvironment. environment. Figure 3. Database construction environment. The Theexpert, expert,whose whosecareer careerisisininnational nationalathletics, athletics,isisfemale, female,164 164cm cmininheight, height,and and235 235mm mmininfoot foot size. motion capture capturesuit suitbased basedonon Xsens inertial sensors, were extracted the size.Using Using the the 3D motion Xsens inertial sensors, datadata were extracted in theinorder The expert, whose career is in national athletics, is female, 164 cm in height, and 235 mm in foot order Jejucm (137 or Thoroughbred less), Thoroughbred (160and cm), and Blood Warm (150–173 Blood (150–173 cm). 1Itto took 1 toto of Jejuof(137 orcm less), (160 cm), Warm cm). It took 2 min size. Using the 3D motion capture suit based on Xsens inertial sensors, data were extracted in the 2measure min to measure a file.data Fifteen data were received per gait. Agaits horse’s gaits of walk, a file. Fifteen were received per gait. A horse’s consist of consist walk, sitting trot,sitting rising order of Jeju (137 cm or less), Thoroughbred (160 cm), and Warm Blood (150–173 cm). It took 1 to trot, rising trot, and canter. In the walk gait, the horse moves at 130 m a minute, approximately 8 trot, and canter. In the walk gait, the horse moves at 130 m a minute, approximately 8 kph; in the 2 min to measure a file. Fifteen data were received per gait. A horse’s gaits consist of walk, sitting kph; in the at 220 m perapproximately minute, approximately 13the kph; in thegait canter gaitmatper 350minute, m per sitting trotsitting gait attrot 220gait m per minute, 13 kph; in canter at 350 trot, rising trot, and canter. In the walk gait, the horse moves at 130 m a minute, approximately 8 minute, approximately kph; andgallop at full 100 gallop 100minute, m per minute, that is 60 the maximum approximately 21 kph;21 and at full m per that is 60 kph; thekph; maximum speed is kph; in the sitting trot gait at 220 m per minute, approximately 13 kph; in the canter gait at 350 m per speed is 72 usedofafour totalgaits: of four gaits: walk,trot, sitting trot, rising trot, and canter. The 72 kph. Thekph. testThe usedtest a total walk, sitting rising trot, and canter. The measured minute, approximately 21 kph; and at full gallop 100 m per minute, that is 60 kph; the maximum measured rateframes/s was 100(fps). frames/sec Figure the 4a–c shows the of three breeds horse, Jeju, frame rateframe was 100 Figure(fps). 4a–c shows three breeds horse, Jeju, of Thoroughbred, speed is 72 kph. The test used a total of four gaits: walk, sitting trot, rising trot, and canter. The Thoroughbred, and Warmblood, respectively. and Warmblood, respectively. measured frame rate was 100 frames/sec (fps). Figure 4a–c shows the three breeds of horse, Jeju, Thoroughbred, and Warmblood, respectively.
Sensors 2016, 16, 664 Sensors 2016, 16, 664 Sensors 2016, 16, 664
(a) (a)
5 of 18 5 of 17 5 of 17
(b) (b)
(c) (c)
Figure 4. Three breeds of horse: (a) Jeju; (b) Thoroughbred; (c) Warmblood. Figure4.4.Three Threebreeds breedsofofhorse: horse:(a) (a)Jeju; Jeju;(b) (b)Thoroughbred; Thoroughbred;(c)(c)Warmblood. Warmblood. Figure
2.1.3. Gait-Specific Motions in Real Horse Riding Environment 2.1.3.Gait-Specific Gait-SpecificMotions MotionsininReal RealHorse HorseRiding RidingEnvironment Environment 2.1.3. The cycles of gait-specific professional motions were presented in the order of frames using the Thecycles cyclesofofgait-specific gait-specific professionalmotions motionswere werepresented presentedininthe theorder orderofofframes framesusing usingthe the BVHThe motion analysis program. professional Figure 5 visualizes canter motion data at specific frame intervals between BVH motion analysis program. Figure 5 visualizes canter motion data at specific frame intervals between BVH motion analysis program. Figure 5 visualizes canter motion data at specific frame intervals 10 and 15 frames. 10 and 15 between 10frames. and 15 frames.
Figure 5. Motion data for the canter gait in BVH environment. Figure 5. Motion data for the canter gait in BVH environment. Figure 5. Motion data for the canter gait in BVH environment.
2.2. Method for Analyzing Real Horse Riding Postures 2.2. Method for Analyzing Real Horse Riding Postures 2.2. Method for Analyzing Real Horse Riding Postures To achieve the correct posture while horse riding, the user’s motions must be analyzed. To achieve the correct posture while horse riding, the user’s motions must be analyzed. A A comparative analysis is performed usinghorse the following twouser’s methods (elbowmust anglebeand hip (y)). A To achieve the correct posturebywhile riding, the motions analyzed. comparative analysis is performed by using the following two methods (elbow angle and hip (y)). comparative analysis is performed by using the following two methods (elbow angle and hip (y)). 2.2.1. Elbow Angle 2.2.1. Elbow Angle 2.2.1. Elbow Angle Three elbow coordinates, A, B, and C, are defined using Equation (1) by extracting the values of Three elbow coordinates, A, B, and C, are defined Equation (1) by extracting values of the body feature points A (shoulder), B (elbow), and Cusing (wrist) from a sensor. Figure 6 the visualizes Three elbow coordinates, A, B, and C, are defined using Equation (1) by extracting the valuesaof the body feature points A (shoulder), B (elbow), and C (wrist) from a sensor. Figure 6 visualizes a method forfeature calculating theAelbow angle using MVNand studio motionfrom capture software. the body points (shoulder), B (elbow), C (wrist) a sensor. Figure 6 visualizes a method for calculating the elbow angle using MVN studio motion capture software. method for calculating theAelbow software. “ x A ,angle y A , z Ausing , B “MVN x B , y Bstudio , z B , C motion “ xC , yCcapture , zC (1) A= , , , B= , , , C= , , (1) A= , , , B= , , , C= , , (1) The distance between feature points A (wrist), B (elbow), and C (shoulder) can be calculated The distance between feature points A (wrist), B (elbow), and C (shoulder) can be calculated using by The distance between feature points A (wrist), B (elbow), and C (shoulder) can be calculated using by b using by AB “ px A ´ x B q2 ` py A ´ y B q2 ` pz A ´ z B q2 q “ c = − − − = = − − − = b 2 2 2 (2) = − − − = (2) BC “ =px B ´ x−C q ` py B ´ y−C q ` pz B ´ z−C q q “ = a (2) b = − − − = CA “ =pxC ´ x−A q2 ` pyC ´ y−A q2 ` pzC ´ − z A q2 q “=b Equation (3) is entered, if a distance is calculated for each feature point: Equation(3) (3)isisentered, entered,if ifa adistance distanceisiscalculated calculatedfor foreach each feature point: Equation feature point: = − 2 cos = − 2 cos = − 2 cos = − 2 cos It is possible to calculate the angle of an elbow joint, if a transformation is made, as It is possible to calculate the angle of an elbow joint, if a transformation is made, as
(3) (3)
Sensors 2016, 16, 664
6 of 18
b2 “ c2 ` a2 ´ 2ca cosB (3)
c2 “ a2 ` b2 ´ 2ab cosC SensorsIt 2016, 16,664 664 Sensors 2016, 16, is possible
to calculate the angle of an elbow joint, if a transformation is made, as Elbow angle “ cos´1 p Elbowangle angle== Elbow
6 6ofof1717
c2 ` a2 ´ b2 − q 2ca − 22
(a) (a)
(4) (4) (4)
(b) (b)
Figure6.6. 6.Visualization Visualization elbowangle. angle.(a) (a) Elbow angle visualization MVN studio software; Figure Figure Visualizationofof ofelbow elbow angle. (a)Elbow Elbowangle anglevisualization visualizationinin inMVN MVNstudio studiosoftware; software; (b) Geometric representation for elbow calculation. (b) Geometric representation for elbow calculation. (b) Geometric representation for elbow calculation.
2.2.2. Hipy Location Location 2.2.2. 2.2.2. Location coordinateHH(x,y,z) (x,y,z)isisobtained obtainedby byextracting extractingthe thehip hipvalues valuesfrom fromthe thedatabase databasecollected collectedby by AAcoordinate Figure shows thevisualization visualization thehip inMVN MVNstudio studiomotion inertial inertialsensors. sensors.Figure Figure777shows showsthe visualizationofofthe hipvalue valuein in MVN studio motioncapture capture software.These These hip motion data are used to classify the horse’s gaits in the design of the classifier. software. hip motion data are used to classify the horse’s gaits in the design of the classifier. These hip motion data are used to classify the horse’s gaits in the design of the classifier. The Hipy isisy-axis y-axis(vertical (verticalaxis) axis)component component hip position. These values represent therhythm rhythm The (vertical axis) component hip position. These values represent ofof ofofof hip position. These values represent the the rhythm of rider ridermotion motion according horse gaits. rider according totohorse motion according to horse gaits.gaits. = Hvalue of vertical axis Hipy=“
(5) (5)
yy
hipvalue. value. Figure7.7.Visualization Visualizationofofhip Figure
HorseSimulator Simulatorand andRiding 2.3. 2.3.Horse RidingCoaching CoachingSystem System Wedeveloped developedaaa5-senses 5-sensesconvergence convergencesports sportssimulator simulatorasasaahorse horseriding ridingsimulator simulatorbased basedon onaa We developed 5-senses convergence motion platform, shown Figure8a. Thecoaching multi-axis multi-axismotion motionplatform, platform,asas asshown shownininFigure 8a.The coachingsystem systemusing usingthe theclassification classificationofof horsegaits gaits can be applied to this simulator. The horse simulator is equipped with 26 photo sensors horse can be applied to this simulator. The horse simulator is equipped with 26 photo sensors gaits can be to this simulator. The horse simulator is equipped with 26 photo sensors and and two pressure sensors to obtain information from the simulator as you can see Figure and pressure sensors to obtain information the simulator you can 8. seeA Figure 8.8.AA twotwo pressure sensors to obtain information from thefrom simulator as you canassee Figure photoelectric photoelectric sensor, photo eye, used discover thedistance, distance, absence, orpresence presence ofan anobject photoelectric sensor, photo isisused discover the absence, sensor, or photo eye,or isorused toeye, discover thetoto distance, absence, or presence of or an object by of using aobject light by using a light transmitter, frequently infrared, and a photoelectric receiver. A pressure sensor by using a light transmitter, frequently infrared, and a photoelectric receiver. A pressure sensor transmitter, frequently infrared, and a photoelectric receiver. A pressure sensor measures pressure, measurespressure, pressure, typically gasesororis liquids. Pressureof anexpression expression the forcearequired required measures typically gases liquids. Pressure isisthe an ofofthe toto typically of gases or liquids.ofofPressure an expression force required to force stop fluid from stopaafluid fluidfrom fromis expanding, andis usually stated terms force per8b unit area.the Figure 8bshows shows stop expanding, and ininterms ofofforce per unit area. Figure 8b expanding, and usually stated inisusually terms ofstated force per unit area. Figure shows graphical user thegraphical graphical userinterface interface for riding coaching real-time andoff-line off-line environments. same the user for coaching ininreal-time and environments. InInthe same interface for riding coaching inriding real-time and off-line environments. In the same manner asthe for real mannerasasfor forreal realriding, riding,aadatabase databasewas wasconstructed constructedfrom fromdata datacollected collectedfrom fromaamotion motioncapture capture manner suittotowhich which16 16inertial inertialsensors sensorswere wereattached attachedworn wornby bythe thecountry’s country’stop-level top-levelhorse horseriding ridingexpert. expert. suit As shown in Figure 8b, the coaching system compares the expert’s motion with the user’s motion As shown in Figure 8b, the coaching system compares the expert’s motion with the user’s motion andinforms informsthe theuser userofofthe thecorrect correctriding ridingmotion motioncorresponding correspondingtotothe theclassified classifiedriding ridinggait gaitthrough through and textand andspeech speechon onthe thebasis basisofofthe themotion motionanalysis analysisasasmentioned mentionedabove above[30]. [30]. text
Sensors 2016, 16, 664
7 of 18
riding, a database was constructed from data collected from a motion capture suit to which 16 inertial sensors were attached worn by the country’s top-level horse riding expert. As shown in Figure 8b, the coaching system compares the expert’s motion with the user’s motion and informs the user of the correct riding motion corresponding to the classified riding gait through text and speech on the basis of the 2016, motion analysis as mentioned above [30]. Sensors 16, 664 7 of 17
(a) Horse riding simulator
(b) User riding coaching interface
Figure 8. Horse for riding riding coaching. coaching. Figure 8. Horse riding riding simulator simulator and and user user interface interface for
3. Machine 3. MachineLearning LearningAlgorithms Algorithms In this this section, section, we for transforming transforming and In we address address aa WP WP for and compressing compressing the the original original sensor sensor data. data. Further, we used NNC, RBFNC, NBC, and FCM-NFC to predict the horse’s gaits for both real-time Further, we used NNC, RBFNC, NBC, and FCM-NFC to predict the horse’s gaits for both real-time and off-line off-line riding riding coaching. coaching. and 3.1. Dimension Reduction Algorithm 3.1.1. Wavelet 3.1.1. Wavelet A where the A wavelet wavelet is is aa wave-like wave-like vibration, vibration, where the breadth breadth of of the the vibration vibration repeatedly repeatedly increases increases and and decreases, with a focus on 0. It emerges in the typical form of a “short vibration,” as recorded decreases, with a focus on 0. It emerges in the typical form of a “short vibration,” as recorded in in aa seismograph or electrocardiogram graph. In general, a wavelet is exploited for treating signals. seismograph or electrocardiogram graph. In general, a wavelet is exploited for treating signals. It It can can be be used used to to extract extract information information from from an an unknown unknown source source by by combination combination with with aa known known source source using technique. A A wavelet wavelet is is aa mathematical mathematical tool tool that that can can be be used used to to extract extract not not only only using aa convolution convolution technique. audio A series series of of wavelets wavelets is is additionally additionally needed needed audio signals signals and and images, images, but but also also various various kinds kinds of of data. data. A to analyze data completely. Such “complementary” wavelets can decompose data without leading to analyze data completely. Such “complementary” wavelets can decompose data without leading to to a difference thedata dataororoverlapping. overlapping.Therefore, Therefore,the the decomposition decomposition process process is is mathematically a difference ininthe mathematically reversible. Therefore, wavelets algorithms designed designed reversible. Therefore, wavelets are are useful useful in in wavelet-based wavelet-based compression/release compression/release algorithms to minimize loss and restore original information. Mathematically, this expression technique constitutes to minimize loss and restore original information. Mathematically, this expression technique a set of complete orthogonal functions forfunctions the Hilbert of square-integrable functions, an constitutes a set of complete basis orthogonal basis forspace the Hilbert space of square-integrable overcomplete set, or a set ofset, square-integrable functions on a vector space Figure functions, an overcomplete or a set of square-integrable functions onframe. a vector space9 shows frame. a wavelet decomposition structure that performs dimension reduction to provide time saving and Figure 9 shows a wavelet decomposition structure that performs dimension reduction to provide precision. Here, input data are the data 160) obtained building rider’s time saving andthe precision. Here, thehorse inputgait data are(100 theˆhorse gait databy(100 × 160)a horse obtained by y-axis data according to the horse’s gait. Dimension reduction allows data of Layer 0 [0,0], Layer building a horse rider’s y-axis data according to the horse’s gait. Dimension reduction allows data of1 [1,0], 2 [2,0], and 3 [3,0] 2(13[2,0], ˆ 160) be extracted. of Layers 0, 1, and 2The is 100 ˆ 60, LayerLayer 0 [0,0], Layer 1 Layer [1,0], Layer andtoLayer 3 [3,0] The (13 ×size 160) to be extracted. size of 50 ˆ 150, and 252ˆis160, Layers 0, 1, and 100 respectively. × 60, 50 × 150, and 25 × 160, respectively.
functions, an overcomplete set, or a set of square-integrable functions on a vector space frame. Figure 9 shows a wavelet decomposition structure that performs dimension reduction to provide time saving and precision. Here, the input data are the horse gait data (100 × 160) obtained by building a horse rider’s y-axis data according to the horse’s gait. Dimension reduction allows data of Layer 0 [0,0], Sensors 2016, 16, 664Layer 1 [1,0], Layer 2 [2,0], and Layer 3 [3,0] (13 × 160) to be extracted. The size 8of of 18 Layers 0, 1, and 2 is 100 × 60, 50 × 150, and 25 × 160, respectively.
Sensors 2016, 16, 664
8 of 17
Figure9.9. Partial Partial wavelet wavelet decomposition Figure decompositionstructure. structure.
3.1.2. Wavelet vs. Wavelet Packet 3.1.2.In Wavelet vs. Wavelet Packet continues to occur only in low frequency components after the low a wavelet, decomposition and In high frequency componentscontinues from thetofirst data are shown in after Figure In a wavelet, decomposition occur only in decomposed, low frequencyas components the9.low contrast, a WP decomposition occurs of adecomposed, low or high frequency and level9.decomposed and high in frequency components from theregardless first data are as shown in Figure In contrast, in 2 . Here n is levels of decomposition. Forornhigh levels of decomposition the wavelet in a WP decomposition occurs regardless of a low frequency and level decomposed in 2npacket . Here decomposition (WPD) produces 2 different sets of coefficients. However, due to the n is levels of decomposition. For n levels of decomposition the wavelet packet decomposition (WPD) n down-sampling process overall number of coefficients is still the sameprocess and there is no produces 2 different sets the of coefficients. However, due to the down-sampling the overall redundancy. Figure 10 shows the decomposition steps of a WP. The input data are horse data number of coefficients is still the same and there is no redundancy. Figure 10 shows the decomposition (100 × 160), the same as the data used for the above wavelet. Dimension reduction allows data of steps of a WP. The input data are horse data (100 ˆ 160), the same as the data used for the above Layer 0 [0,0], Layer 1reduction [1,0], Layer 2 [2,0], andofLayer toLayer be extracted. The size of Layers 0, 1, 2, wavelet. Dimension allows data Layer30[3,0] [0,0], 1 [1,0], Layer 2 [2,0], and Layer 3 and 3 is 100 × 160, 50 × 160, 25 × 160, and 13 × 160, respectively. It can be seen that decomposition is [3,0] to be extracted. The size of Layers 0, 1, 2, and 3 is 100 ˆ 160, 50 ˆ 160, 25 ˆ 160, and 13 ˆ 160, performed atIthigh frequency, in a wavelet. An excellent classification rate is in achieved by respectively. can be seen thatunlike decomposition is performed at high frequency, unlike a wavelet. executing allclassification the WP feature from Layer 0 to Layer An excellent ratedata is achieved by executing all3.the WP feature data from Layer 0 to Layer 3.
Figure Figure 10. 10. Decomposition Decomposition structure structure of of wavelet wavelet packet. packet.
The wavelet wavelet packet is aa generalization generalization form form of of wavelet wavelet decomposition decomposition that that performs performs signal signal analysis. This Thismethod methodisisaccomplished accomplishedby bythree threeparameters parameterssuch such frequency, position and scale asas frequency, position and scale as as wavelet decomposition. procedureofofwavelet waveletdecomposition, decomposition,the the first first step step splits the in in wavelet decomposition. In In thetheprocedure the approximation coefficients into two After splitting splitting we we obtain a vector of approximation two parts. parts. After approximation coefficients and The information information lost between two successive and detail detail coefficients, coefficients, respectively. respectively. The successive approximations is captured in the detail coefficients. The next step consists in splitting the new the detail coefficients. The next approximation vector. In the wavelet packets packets situation,situation, each detaileach coefficient approximationcoefficient coefficient vector. In corresponding the corresponding wavelet detail vector is also decomposed into two parts using theusing samethe approach as in approximation vector coefficient vector is also decomposed into two parts same approach as in approximation splitting [31,32]. vector splitting[31,32].
3.2. Classifier Algorithms 3.2.1. Neural Network Classifier The neural network is a structure adopted in computer programs to solve problems in a similar way to human brain processing. In other words, when neurons, that is, nodes or connection points, form a network by mutual connection, the network is called a neural network [26,27]. Figure 11 shows the basic structure of a neural network. The horse gait data consisted of a rider’s y-axis data (100 × 160)
Sensors 2016, 16, 664
9 of 18
3.2. Classifier Algorithms 3.2.1. Neural Network Classifier The neural network is a structure adopted in computer programs to solve problems in a similar way to human brain processing. In other words, when neurons, that is, nodes or connection points, form a network by mutual connection, the network is called a neural network [26,27]. Figure 11 shows the basic structure of a neural network. The horse gait data consisted of a rider’s y-axis data (100 ˆ 160) and WP feature data (25 ˆ 160). Since we used 50% of the data as the input, the size of the hip data for the walk gait was 100 ˆ 20. The input vector for training classifier consists of vector including y-axis component of hip position. These values represent the rhythm of rider motion according to horse gaits. We use original data points and the data transformed by wavelet packet in this paper. The angle of elbow, knee, backbone, and distance of each elbow were used for motion analysis and Sensors 2016, 16, 664 9 of 17 coaching [33,34].
Figure11. 11.Architecture Architectureofofneural neuralnetwork networkclassifier classifier(NNC). (NNC). Figure
3.2.2.Naive NaiveBayesian BayesianClassifier Classifier 3.2.2. Naive Bayes Bayes isis aa stochastic stochastic classifier classifier and and aamodel model that thathypothesizes hypothesizes that that all all features features are are Naive conditionallyindependent, independent, if if class class variables network shows structures are conditionally variables are are given. given.The TheBayesian Bayesian network shows structures independent, if class variables are given. The naive Bayesian classifier is very efficient in terms are independent, if class variables are given. The naive Bayesian classifier is very efficient in termsof limited to to those those for forprobability probability oflearning learningand andapplication. application.The Theparameters parameterscomposing composingaa model model are are limited distribution. A learned model can be also applied efficiently. The naive Bayesian classifier exercises distribution. A learned model can be also applied efficiently. The naive Bayesian classifier exercises an an optimum performance, if it meets a conditional independent hypothesis with probability optimum performance, if it meets a conditional independent hypothesis with probability distribution. distribution. Theof performance of the naïve Bayesian classifier hasexperimentally been proved experimentally and The performance the naïve Bayesian classifier has been proved and theoretically. theoretically. However, many current problems do not follow the naive Bayesian hypothesis. However, many current problems do not follow the naive Bayesian hypothesis. Specifically, there are Specifically, are the many problems in are which the specific independent. variables areThe notperformance conditionally many problemsthere in which specific variables not conditionally is independent. The performance is expected to be degraded, if each specific variable is not expected to be degraded, if each specific variable is not conditionally independent. If each variable conditionally independent. If each variable has aBayesian binary value, theisexpressiveness naive has a binary value, the expressiveness of the naive classifier the same as thatofofthe a linear Bayesian classifier is the same as that of a linear classifier [35,36]. classifier [35,36]. 3.2.3.Radial RadialBasis BasisFunction FunctionNetwork NetworkClassifier Classifier 3.2.3. thefield fieldofofmathematical mathematicalmodeling, modeling,the theradial radialbasis basisfunction functionnetwork networkclassifier classifier(RBFNC) (RBFNC)isis InInthe anartificial artificialneural neuralnetwork networkand anduses usesradial radialbasis basisfunctions functionsasassigmoid sigmoidfunctions. functions.The Theoutput outputofofthe the an network is a linear combination of the radial basis functions of the input and neuron parameters. The network is a combination of the radial basis functions of the input and neuron parameters. RBFN is used forfor function control, etc. etc. The RBFN is used functionapproaches, approaches,time timeseries series prediction, prediction, classification, classification, system control, Figure12 12illustrates illustratesthe theRBFNC’s RBFNC’sarchitecture architecture[37]. [37].The Thehorse horsegait gaitdata dataconsisted consistedofofaahorse horserider’s rider’syy Figure data(100 (100ˆ× 160) 160)and andWP WPfeature featuredata data(25 (25ˆ× 160). Since we used used 50% 50% of of the thedata dataas asthe theinput, input,the thesize size data thehip hipdata dataininthe thewalk walkgait gaitwas was100 100ˆ×20. 20. ofofthe
an artificial neural network and uses radial basis functions as sigmoid functions. The output of the network is a linear combination of the radial basis functions of the input and neuron parameters. The RBFN is used for function approaches, time series prediction, classification, system control, etc. Figure 12 illustrates the RBFNC’s architecture [37]. The horse gait data consisted of a horse rider’s y data (100 × 160) and WP feature data (25 × 160). Since we used 50% of the data as the input, the size Sensors 2016, 16, 664 10 of 18 of the hip data in the walk gait was 100 × 20.
Figure12. 12.Architecture Architectureofofthe theradial radialbasis basisfunction functionnetwork networkclassifier classifier(RBFNC). (RBFNC). Figure
3.2.4. FCM-Based Neuro-Fuzzy Classifier (NFC) The design of the FCM-NFC consists of an NFC assisted by FCM clustering. Here, the NFC is similar to the adaptive neural fuzzy inference system (ANFIS) introduced by Jang [38]. While Jang’s model frequently encounters the “curse of dimensionality” problem that the number of fuzzy rules exponentially increases because of the grid partitioning of the input space, the FCM-NFC can solve such a problem by virtue of the flexible scatter partitioning of FCM clustering. In general, a fuzzy classifier has an appropriate reasoning ability that is easy to apply to a complicated or non-linear system using professional and experiential knowledge and can overcome the vagueness or uncertainty inherent in the human thinking process. However, professional knowledge is often inconsistent and sometimes incomplete. There are also difficulties in acquiring fuzzy rules by human intuition and experience due to the lack of a systematic and efficient method. To confront this problem, it is frequently advantageous to use several computing techniques synergistically rather than exclusively, resulting in the construction of complementary hybrid intelligent systems. Thus, we attempted to combine the fuzzy system with a neural network. Figure 13 shows the architecture of the FCM-NFC. The classifier shown in Figure 13 has an inference system with two TSK-type fuzzy rules as follows [38]. Rule 1: If x1 is A1 and . . . xm is B1 , and then f is f1 Rule n: If x1 is An and . . . xm is Bn , and then f is f2
(6)
where fi is the linear equation of i’th consequent part. The linguistic labels in the first layer are constructed by Gaussian membership functions with two parameters as $ ˜ ¸2 , & x j ´ cij . Aij px j q “ exp ´ (7) % σj Each of the cluster centers generated by FCM clustering represents a prototype that exhibits certain characteristics of the system to be modeled. The final inference output of the FCM-NFC is computed as the weighted average method r ř
f “
r ÿ i “1
wi f i “
wi f i
i “1 r ř
(8) wi
i “1
where wi is a normalized firing strength of the i’th rule. These values are obtained by the ratio of the i’th rule’s firing strength to the sum of all rule’s firing strengths. The learning scheme of the proposed
Sensors 2016, 16, 664
11 of 18
FCM-NFC is realized by hybrid learning method using a back-propagation (BP) algorithm and least square estimator (LSE). Fuzzy c-means (FCM) clustering is a method of clustering that allows one data point to belong to two or more clusters. This method is frequently used in pattern recognition. It is based on the minimization of the objective function Jm “
N ÿ N ÿ
um ij k xi ´ c j k2 , 1 ď m ă 8
(9)
i “1 i “1
Sensors 2016, 16, 664
11 of 17
where m is any real number greater than 1, uij is the degree of membership of xi in the cluster j, xi is the i’th piece of d-dimensional measured data, c j is the d-dimension center of the cluster, and k ¨ k is ∑ ∙ any norm expressing the similarity between is = any measured data and the center. Fuzzy partitioning(11) ∑ performed through an iterative optimization of the objective function shown above, with the update of membership uij andterminates the clusterwhen centers c j by − < ε, where ε represents a termination This iteration
criterion between 0 and 1, whereas k represents the1 iteration steps. This procedure converges to a u “ (10) 2 ´ ¯ local minimum or a saddle point of ij. Theřalgorithm composed of the following steps: m´1 k xi ´cis C ik [Step 1] [Step 2] [Step 3] [Step 4]
k“1
k x i ´c k k
Initialize U = [ ] matrix, řN m At k-step : calculate the centers vectorsi“1 u ij=¨ xi c j “ řN m Update , u ij i “1 If − < ε , then stop; otherwise, retun to Step 2.
(11)
Figure Figure 13. 13. Architecture Architecture of ofNFC NFCbased basedon onFCM FCMclustering clustering(FCM-NFC). (FCM-NFC).
ˇ) !ˇ 4. Experiment andterminates Results when maxij ˇˇupk`1q ij ´ upkq ij ˇˇ < ε, where ε represents a termination This iteration criterion between 0 and 1, whereas k represents the iteration steps. This procedure converges to a local 4.1. Horse Rider’s Motion Database by Riding Gaits minimum or a saddle point of Jm . The algorithm is composed of the following steps: In this section, we describe the construction of a horse rider’s motion database for four horse po q [Step Initialize U= ij ] matrix, gaits 1] of three breeds of[u horse (Jeju, U Warmblood, and Thoroughbred). The data in this database were “ ‰ pkq “ c with U pkq [Step 2] At k-step : calculate the centers vectors C j obtained from a motion capture suit including inertial sensors worn by a horse riding expert. From k `1 q [Step 3] several Update U pkqwe , U pused among data, the hip values of the y-axis for horse gait classification. To synchronize this database, the minimum value was extracted between 1 and 400 frames and 100 values were extracted from the point of time one. In order to achieve a standard performance, all the experiments were completed in the 10-fold cross-validation mode. The entire data set used in this study comprised 80 data. The training and validation data set were randomly selected by a 50%/50% split, respectively. The training data set was used for predictor construction, while the test data set
Sensors 2016, 16, 664
[Step 4]
12 of 18
If k U pk`1q ´ U pkq kă ε, then stop; otherwise, retun to Step 2.
4. Experiment and Results 4.1. Horse Rider’s Motion Database by Riding Gaits In this section, we describe the construction of a horse rider’s motion database for four horse gaits of three breeds of horse (Jeju, Warmblood, and Thoroughbred). The data in this database were obtained from a motion capture suit including inertial sensors worn by a horse riding expert. From among several data, we used the hip values of the y-axis for horse gait classification. To synchronize this database, the minimum value was extracted between 1 and 400 frames and 100 values were extracted from the point of time one. In order to achieve a standard performance, all the experiments were completed in the 10-fold cross-validation mode. The entire data set used in this study comprised 80 data. The training and validation data set were randomly selected by a 50%/50% split, respectively. The training data set was used for predictor construction, while the test data set was used for predictor validation. Thus, Sensors 2016, 16, 664 the resultant predictor was not biased toward the training data set and it was12likely of 17 to have a better generalization capacity to new data.
4.1.1. Horse Riding Learning Data and Validation Data 4.1.1. Horse Riding Learning Data and Validation Data Figure 14 shows some of the hip motion data for four horse gaits (walk, sitting trot, rising trot, Figure 14 shows some of the hip motion data for four horse gaits (walk, sitting trot, rising trot, canter). As shown in Figure 14, the hip motion for each gait has unique characteristics. In the case of canter). As shown in Figure 14, the hip motion for each gait has unique characteristics. In the case of the walk gait, we can see that the motion is flat. In the case of the sitting trot gait, the motion shows the walk gait, we can see that the motion is flat. In the case of the sitting trot gait, the motion shows an iterative curve, because the trot is a two-beat diagonal gait of the horse, where the diagonal pairs an iterative curve, because the trot is a two-beat diagonal gait of the horse, where the diagonal pairs of legs move forward at the same time with a moment of suspension between each beat. Figure 15 of legs move forward at the same time with a moment of suspension between each beat. Figure 15 visualizes several overlapped hip motion data. Table 1 lists the database information for the four visualizes several overlapped hip motion data. Table 1 lists the database information for the four gaits. gaits. The size of this database is 100 × 160. Here, the number of dimensions is 100. We divided it The size of this database is 100 ˆ 160. Here, the number of dimensions is 100. We divided it into the into the validation data with a size of 100 × 80 and the learning data with a size of 100 × 80. validation data with a size of 100 ˆ 80 and the learning data with a size of 100 ˆ 80.
(a)
(b)
Figure Figure 14. 14. Hip Hipmotion motiondata data(a) (a)original originalsensor sensordata data(walk, (walk,sitting sittingtrot, trot, rising rising trot, trot, canter) canter) (b) (b) data data transformed transformedby bywavelet wavelet packet packet (walk, (walk, sitting sitting trot, trot, rising rising trot, trot, canter) canter)
(a)
(b)
Figure 14. Hip motion data (a) original sensor data (walk, sitting trot, rising trot, canter) (b) data Sensorstransformed 2016, 16, 664 by wavelet packet (walk, sitting trot, rising trot, canter)
(a)
13 of 18
(b)
Figure 15. 15. Overlapped Figure Overlapped hip hip motion motion data. data. (a) (a) original original sensor sensor data data (walk, (walk, sitting sitting trot, trot, rising rising trot, trot, canter) canter) (b) data transformed by wavelet packet (walk, sitting trot, rising trot, canter). (b) data transformed by wavelet packet (walk, sitting trot, rising trot, canter).
The initial initialcenter centerofofFCM FCM is randomly generated by membership the membership with random The is randomly generated by the matrixmatrix U withUrandom values values between 0 and 1 such that the summation of degrees of belongingness for a data setisalways is between 0 and 1 such that the summation of degrees of belongingness for a data set always equal to equal to We33 selected if-then rulestrial through trial as and error as the of rulebetween increases unity. Weunity. selected if-then33 rules through and error the number ofnumber rule increases 2 between 2 and 50. The size of cluster centers after performing FCM clustering is 33 × 25. The size of and 50. The size of cluster centers after performing FCM clustering is 33 ˆ 25. The size of membership membership 33 × 80and for training and respectively. testing data, respectively. is class number matrix is 33 ˆmatrix 80 for is training testing data, The output isThe classoutput number representing representing gaits to be classified. The size output × 1. The input forclassifier training horse gaits tohorse be classified. The size of output is of also 80 ˆ is 1.also The80 input vector forvector training classifier consists of vector including y-axis component of hip position. These values represent consists of vector including y-axis component of hip position. These values represent the rhythmthe of rhythm of rider motion according to use horse gaits.data Wepoints use original datatransformed points andbythe data rider motion according to horse gaits. We original and the data wavelet packet in this paper. The angle of elbow, knee, backbone, and distance of each elbow were used for motion analysis and coaching. Table 1. Original data.
Training data Test data Total
Walk
Sitting Trot
Rising Trot
Canter
Total
100 ˆ 20 100 ˆ 20 100 ˆ 40
100 ˆ 20 100 ˆ 20 100 ˆ 40
100 ˆ 20 100 ˆ 20 100 ˆ 40
100 ˆ 20 100 ˆ 20 100 ˆ 40
100 ˆ 80 100 ˆ 80 100 ˆ 160
4.1.2. Features Transformed by Wavelet Packet The features are extracted by applying the training data and the validation data based on a WP. The transformed data sets consist of four layers. Each layer is composed of [0,0], [1,0], [1,1], [2,0], [2,1], [2,2], [2,3], [3,0], [3,1] [3,2], [3,3], [3,4], [3,5], [3,6], and [3,7], as shown in Figure 16. Figure 16 shows the decomposition step of a WP consisting of four layers. It is possible to generate a total of 14 feature data, i.e., 2 in Layer 1, 4 in Layer 2, and 8 in Layer 3. Here, we used the transformed data (25 ˆ 160) of Layer 2 as feature data in consideration of the recognition rate and velocity. Thus, the size (100 ˆ 160) of the original data is transformed into a reduced size (25 ˆ 160) by the WP. We divided this transformed database into validation data with a size of (25 ˆ 80) and learning data with a size of (25 ˆ 80). Table 2 lists the information of the database transformed by the WP. Figure 14 visualizes the hip motion data and transformed by the WP for the four gaits. Figure 15 visualizes the overlapped and transformed motion data and transformed by the WP for the four gaits.
160) of Layer 2 as feature data in consideration of the recognition rate and velocity. Thus, the size (100 × 160) of the original data is transformed into a reduced size (25 × 160) by the WP. We divided this transformed database into validation data with a size of (25 × 80) and learning data with a size of (25 × 80). Table 2 lists the information of the database transformed by the WP. Figure 14 visualizes the hip motion data and transformed by the WP for the four gaits. Figure 15 visualizes the Sensors 2016, 16, 664 14 of 18 overlapped and transformed motion data and transformed by the WP for the four gaits.
Figure 16. Wavelet packet decomposition. Figure 16. Wavelet packet decomposition. Table 2. Size of the feature data transformed by wavelet packet for training and testing data. Table 2. Size of the feature data transformed by wavelet packet for training and testing data.
Walk Walk Sitting Trot Sitting Trot Training data 25 × 20 25 × 20 Training data 25 ˆ 20 25 ˆ 20 Testing data ˆ 20 Testing data 25 × 2025 ˆ 20 25 25 × 20 Total 25 × 4025 ˆ 40 ˆ 40 Total 25 25 × 40
Rising Trot Rising Trot 25 × 20 25 ˆ 20 25 25 ˆ × 20 25 40 25 ˆ × 40
Canter Canter
Total Total 25 × 20 25 ˆ 20 25 ˆ 80 25 × 80 25 ˆ25 20× 20 25 ˆ 80 25 × 80 25 ˆ25 40× 40 25 ˆ 16025 × 160
4.2. Experimental Results The experiments experiments were performed using a computer with a 3.4 GHz CPU, Intel (R) Core (TM) i7-2600, 16 Gbyte memory, and MATLAB R2012b. The size of the original original data data and and the the transformed transformed data was 160, respectively. The The experimental experimental results results of the RBFNC showed a was 100 100 ˆ × 160 and 25 ˆ × 160, classification accuracy performance of 25%, as the learning failed in the case of the original motion data. However, the experimental results showed a classification accuracy performance of 86.25% for the feature data set transformed by the WP. Here, we selected 236 nodes and a learning rate of 0.022 through trial and error in the design of RBFNC. In the case of the FCM-NFC, the results showed a classification accuracy performance of 91.25%, when using the original motion data. We used 33 fuzzy if-then rules of the TSK-type by finding the optimal number of rules that showed the minimum error for the validation data set. Furthermore, we obtained the best classification performance, 97.5%, when using the transformed data set as listed in Table 3. Here, we selected 50 rules in the same manner as above. Here, the number of rules is the same as that of cluster centers estimated by FCM clustering. Figure 17 shows confusion matrix of all algorithms(NNC, SVM, NBC, RBFM, FCM-NFC). Figure 18 shows a bar graph visualizing the classification performance. Table 4 lists the processing time of NNC, NBC, RBFNC, and FCM-NFC for the classification of horse gaits.
Furthermore, we obtained the best classification performance, 97.5%, when using the transformed data set as listed in Table 3. Here, we selected 50 rules in the same manner as above. Here, the number of rules is the same as that of cluster centers estimated by FCM clustering. Figure 17 shows confusion matrix of all algorithms(NNC, SVM, NBC, RBFM, FCM-NFC). Figure 18 shows a bar graph visualizing the classification performance. Table 4 lists the processing time of NNC,15NBC, Sensors 2016, 16, 664 of 18 RBFNC, and FCM-NFC for the classification of horse gaits.
(a)
(b)
(c)
(d)
(e) Figure 17. Confusion matrix (a) NNC (b) SVM (c) NBC (d) RBFM (e) FCM-NFC. Figure 17. Confusion matrix (a) NNC (b) SVM (c) NBC (d) RBFM (e) FCM-NFC. Table 3. Performance comparison for original sensor data and the transformed data.
Original data Transformed data by WP
NNC
SVM
NBC
RBFNC
FCM-NFC
87%
93%
96%
25%
91.25%
88%
91%
85.62%
86.25%
97.5%
Table 4. Comparison of processing time (s).
Original Data Data transformed by WP
NNC
NBC
RBFNC
FCM-NFC
2.8 2.5
0.03 0.028
28.26 5.13
0.8 0.61
Sensors 2016, 16, 664
15 of 17
Table 3. Performance comparison for original sensor data and the transformed data.
Original data Transformed data by WP
Sensors 2016, 16, 664
NNC 87% 88%
SVM 93% 91%
NBC 96% 85.62%
RBFNC 25% 86.25%
FCM-NFC 91.25% 97.5%
16 of 18
FCM-NFC RBFNC NBC SVMC NNC 0%
20%
40%
60%
Data transformed by wavelet packet
80%
100%
Original data
Figure 18. Performance comparison between the FCM-NFC and other classifiers. Figure 18. Performance comparison between the FCM-NFC and other classifiers.
5. Conclusions
Table 4. Comparison of processing time (s).
NNC motion features NBC (elbow angle, RBFNC FCM-NFC In this study, we compared horse riders’ hip position) and the gaits Data 0.03Jeju, Warm28.26 0.8 (walk, sittingOriginal trot, rising trot, and canter)2.8 of the horse breeds Blood, and Thoroughbred in a Data transformed by WP 2.5 0.028 5.13 0.61 database consisting of the data collected from a suit with 16 inertial sensors worn by the country’s top-level horse riding expert, using the Euclidean calculation method. The comparison showed that 5. Conclusions there were differences between the data feature values obtained for the horse and gait types. For gait classification and coaching, the features extracted a multiple the algorithm’s In this study, we compared horsewere riders’ motionusing features (elbowsignal angle,WP hipand position) and the performance was evaluated when using the NNC, NBC, RBFNC, and FCM-NFC. The NBC showed a gaits (walk, sitting trot, rising trot, and canter) of the horse breeds Jeju, Warm Blood, and classification performance of 96% for theoforiginal motion data,from and athe FCM-NFC showedsensors a 97.5%worn (the Thoroughbred in a database consisting the data collected suit with 16 inertial highest) performance for the motion data transformed by the WP. It is concluded that the FCM-NFC by the country’s top-level horse riding expert, using the Euclidean calculation method. The has a good classification anddifferences is effective.between On the basis of the classification results and comparison showed that capacity there were the data feature values obtained for the the motion information such as the angle of elbow, knee, backbone, and distance of each elbow for motion horse and gait types. For gait classification and coaching, the features were extracted using a analysis coaching, apply to coaching system each horse gait using for rider or multiple and signal WP andwe thecan algorithm’s performance wasbyevaluated when theunder NNC,real NBC, horse simulator environments. RBFNC, and FCM-NFC. The NBC showed a classification performance of 96% for the original motion data, and the FCM-NFC showed a 97.5% (the highest) performance for the motion data
Acknowledgments: This work was supported by an Institute for Information and Communications Technology transformed by the WP. It is concluded that the FCM-NFC a good classification capacity and is Promotion (IITP) grant funded by the Korea government (MSIP)has (No. R0101-15-0125, Development of the 5-senses sports simulator based on multi-axis platform). This research was effective.convergence On the basis of the classification results and motion the motion information such as thesupported angle of by the MSIP(Ministry of Science, ICT and Planning), Korea, under the and ITRC(Information elbow, knee, backbone, and distance ofFuture each elbow for motion analysis coaching, weTechnology can apply Research Center) support program(IITP-2016-R0992-16-1021) supervised by the IITP(Institute for Information & to coaching system by each horse gait for rider under real or horse simulator environments. Communication Technology Promotion). Author Contributions: Jae-Neung Lee conceived and designed the research and experiments, and contributed as Acknowledgments: work was supported by an Institute for Byeon Information and Communications Technology the lead author of theThis article; Myung-Won Lee and Yeong-Hyeon performed database construction for the Promotion (IITP) grant funded by the Korea government (MSIP) (No. R0101-15-0125, Development the study; Won-Sik Lee developed the horse simulator; Keun-Chang Kwak supervised the writing of the article,ofgave 5-senses convergence sports based on multi-axis motion platform). This research was supported by suggestions, and analyzed thesimulator data for the research. the MSIP(Ministry Science, ICT and no Future Planning), Korea, under the ITRC(Information Technology Conflicts of Interest:ofThe authors declare conflict of interest. Research Center) support program(IITP-2016-R0992-16-1021) supervised by the IITP(Institute for Information & Communication Technology Promotion).
References
Author Contributions: Jae-Neung Lee conceived and designed the research and experiments, and contributed 1. Kim, D.H.; Kim, S.J.; Bae, S.S.; Kim, K. The Effect of Indoor Horseback-Riding Machine on the Balance of the as the lead author of the article; Myung-Won Lee and Yeong-Hyeon Byeon performed database construction Elderly with Dementia. J. Korean Soc. Phys. 2008, 3, 235–246. (In Korean) 2. Lee, C.W.; Lee, I.S.; Kim, H.S. The Effect of Horse-Riding Exercise on Pain and Body Flexibility for the Patient with Chronic Low Back Pain. J. Korean Soc. Integr. Med. 2013, 1, 67–74. [CrossRef]
Sensors 2016, 16, 664
3. 4. 5. 6.
7. 8. 9.
10. 11.
12. 13.
14. 15.
16.
17. 18. 19. 20. 21.
22.
23. 24.
17 of 18
Gang, Y.H.; Lee, D.Y.; Choi, D.S.; Yoon, B.K.; Lee, Y.J.; Rhyu, M.R. Effect of Korean Native Cimicifuga Species on Proliferation of Vascular Smooth Muscle Cells. J. Korean Soc. Menopause 2012, 18, 100–105. Luinge, H.; Veltink, P. Measuring Orientation of Human Body Segments Using Miniature Gyroscopes and Accelerometers. Med. Biol. Eng. Comput. 2005, 43, 273–282. [CrossRef] [PubMed] Zhou, H.; Stone, T.; Harris, N. Use of Multiple Wearable Inertial Sensors in Upper Limb Motion Tracking. Med. Eng. Phys. 2008, 30, 123–133. [CrossRef] [PubMed] Lee, J. Sensor fusion and calibration for motion captures using accelerometers. In Proceedings of the 1999 IEEE International Conference on Robotics and Automation, Detroit, MI, USA, 10–15 May 1999; Volume 3, pp. 1954–1959. Zhu, R.; Zhou, Z. A Real-Time Articulated Human Motion Tracking Using Tri-Axis Inertial/Magnetic Sensors Package. IEEE Trans. Neural Syst. Rehabil. Eng. 2004, 12, 295–302. [CrossRef] [PubMed] Venkatraman, S.; Long, J.; Pister, K.; Carmena, J. Wireless Inertial Sensors for Monitoring Animal Behaviour. IEEE Eng. Med. Biol. Soc. Conf. Proc. 2007, 2007, 378–381. Ghasemzadeh, H.; Loseu, V.; Guenterberg, E.; Jafari, R. Sport training using body sensor networks: A statistical approach to measure wrist rotation for golf swing. In Proceedings of the Fourth International Conference on Body Area Networks, Brussels, Belgium, 1 April 2009; pp. 1–8. Mariani, B.; Hoskovec, C.; Rochat, S.; Bula, C.; Penders, J.; Aminian, K. 3D gait assessment in young and elderly subjects using foot-worn inertial sensors. J. Biomech. 2010, 43, 2999–3006. [CrossRef] [PubMed] Jung, Y.J.; Kang, D.H.; Kim, J.W. Upper Body Motion Tracking With Inertial Sensors. In Proceedings of the 2010 IEEE International Conference on Robotics and Biomimetics (ROBIO), Tianjin, China, 14–18 December 2010; pp. 1746–1751. Song, L.J.; Qin, Y.Y. A Practical Calibration Method on MEMS Gyroscope. Piezoelectr. Acoustoopt. 2010, 32, 372–374. Wei, R.; Tao, Z.; Zhang, H.; Wang L.; Zhou, Y.; Luan, M.; Liu, H.; Shi, J. A Research on Calibration of Low-Precision MEMS Inertial Sensors. In Proceedings of the 2013 25th Chinese Control and Decision Conference (CCDC), Guiyang, China, 25–27 May 2013; pp. 3243–3247. Joris, M.L.; Robert, F.K. Miniature Low-Power Inertial Sensors: Promising Technology for Implantable Motion Capture Systems. IEEE Trans. Neural Syst. Rehabil. Eng. 2014, 22, 1138–1147. Santana, D.D.; Furukawa, C.M.; Maruyama, N. Sensor Fusion with Low-Grade Inertial Sensors and Odometer to Estimate Geodetic Coordinates in Environments without GPS Signal. IEEE Latin Am. Trans. 2013, 11, 1015–1021. [CrossRef] Ziegler, T.; Bergner, P.; Hechenblaikner, G.; Brandt, N.; Fichter, W. Modeling and performance of contact-free discharge systems for space inertial sensors. IEEE Trans. Aerosp. Electron. Syst. 2014, 50, 1493–1510. [CrossRef] Buke, A.; Fang, G.; Wang, Y.; Yang, Z. Healthcare algorithms by wearable inertial sensors: A survey. China Commun. 2015, 12, 1–12. [CrossRef] Zhao, H.; Wang, Z. Motion Measurement Using Inertial Sensors, Ultrasonic Sensors, and Magnetometers with Extended Kalman Filter for Data Fusion. IEEE Sens. J. 2011, 12, 943–953. [CrossRef] Barry, R.G. Assessment and Classification of Early-Stage Multiple Sclerosis With Inertial Sensors: Comparison Against Clinical Measures of Disease State. IEEE J. Biomed. Health Inform. 2015, 19, 1356–1361. Mahomud, E.; James, M. Human Joint Angle Estimation with Inertial Sensors and Validation with A Robot Arm. IEEE Trans. Biomed. Eng. 2015, 62, 1759–1767. Cao, N.; Young, S.; Dang, K. 3D Dynamics Analysis of a Golf Full Swing by Fusing Inertial Sensor and Vision Data. In Proceedings of the 2013 13th International Conference on Control, Automation and Systems (ICCAS), Gwangju, Korea, 20–23 October 2013; pp. 1300–1303. Jung, P.G.; Lim, G.C.; Kong, K.C. A Mobile Motion Capture System Based on Inertial Sensors and Smart Shoes. In Proceedings of the 2013 IEEE International Conference on Robotics and Automation (ICRA), Karlsruhe, Germany, 6–10 May 2013; pp. 692–697. Chan, J.; Leung, H.; Tang, J.; Komura, T. A virtual reality dance training system using motion capture technology. IEEE Trans. Learn. Technol. 2011, 4, 187–195. [CrossRef] Ko, K.L.; Bae, S.B.; Choi, J.S.; Pan, S.B. Implementation of Inertial Sensor based Human Body Motion Capture System for the Self-Coaching. J. Korean Inst. Inf. Tech. 2014, 12, 171–179. (in Korean). [CrossRef]
Sensors 2016, 16, 664
25. 26. 27.
28. 29. 30.
31. 32. 33.
34.
35. 36. 37. 38.
18 of 18
Lim, S.J. A Development of Golf Coaching using Human Motion Analysis. J. Korea Saf. Manag. Sci. 2013, 15, 55–61. Ko, K.L.; Chae, S.H.; Bae, S.B.; Choi, J.S.; Pan, S.B. A Study on the 4-Joint Based Motion Capture System for Spinal Disease Prevention. J. Korean Inst. Inf. Tech. 2014, 12, 157–165. (In Korean) [CrossRef] Cheng, L.; Hailes, S. Analysis of Wireless Inertial Sensing for Athlete Coaching Support. In Proceedings of the IEEE Global Telecommunications Conference (IEEE GLOBECOM 2008), New Orleans, LO, USA, 30 November–4 December 2008; pp. 1–5. Connaghan, D.; Kelly, P.; O’Connor, N.; Gaffney, M.; Walsh, M.; O’Mathuna, C. Multi-Sensor Classification of tennis strokes. In Proceedings of the 2011 IEEE Sensors, Limerick, Ireland, 28–31 October 2011; pp. 1437–1440. Burchfield, R.; Venkatesan, S. A Framework for Golf Training Using Low-Cost Inertial Sensors. In Proceedings of the 2010 International Conference on Body Sensor Networks, Singapore, 7–9 June 2010; pp. 267–272. Lee, M.W.; Kwak, K.C. 3D Motion Analysis of National Rider Athletes by Riding Types in Horse Simulator. In Proceedings of the 2013 Third International Conference on Innovative Computing Technology (INTECH), London, UK, 29–31 August 2013; pp. 12–16. Costa, F.B. Boundary Wavelet Coefficients for Real-Time Detection of Transients Induced by Faults and Power-Quality Disturbances. IEEE Trans. Power Deliv. 2014, 29, 2674–2687. [CrossRef] Quellec, G.; Lamard, M.; Cazuguel, G.; Cochener, B.; Roux, C. Fast Wavelet-Based Image Characterization for Highly Adaptive Image Retrieval. IEEE Trans. Image Process. 2011, 21, 1613–1623. [CrossRef] [PubMed] Lin, C.; Yang, Y.C.; Wang, J.; Yang, Y. A Wearable Sensor Module With a Neural-Network Based Activity Classification Algorithm for Daily Energy Expenditure Estimation. IEEE Trans. Inf. Technol. Biomed. 2012, 16, 991–998. [PubMed] Wang, D.; Leung, H.; Kurian, A.P.; Kim, H.K.; Yoon, H.S. A Deconvolutive Neural Network for Speech Classification with Applications to Home Service Robot. IEEE Trans. Instrum. Meas. 2010, 59, 3237–3243. [CrossRef] Domingos, P.; Pazzani, M. On the optimality of the simple Bayesian classifier under zero-one loss. Mach. Learn. Res. 1997, 29, 103–130. [CrossRef] Ling, C.; Zhang, H. The representational power of discrete Bayesian networks. Mach. Learn. Res. 2002, 3, 709–721. Kim, N.Y. Step-size control for width adaptation in radial basis function networks for nonlinear channel equalization. J. Commun. Netw. 2010, 12, 600–604. [CrossRef] Jang, R. ANFIS: Adaptive-Network-Based Fuzzy Inference System. IEEE Trans. Syst. 1993, 23, 665–685. [CrossRef] © 2016 by the authors; licensee MDPI, Basel, Switzerland. This article is an open access article distributed under the terms and conditions of the Creative Commons Attribution (CC-BY) license (http://creativecommons.org/licenses/by/4.0/).