and man-made buildings. The classifier is a dynamic learning neural network (DL) using the Kalman filter technique as adap- tation rule. The network ...
ClassiJication of Multispectral Imagery Using Dynamic LQarning Neural Network K.S. Chen,Y.C. Tzeng', C.F. Chen,W.L. Kao, a n d C.L. Ni Center for Space a n d Remote Sensing Research National Central University Chung-Li, Taiwan, Republic of China
Abstract This paper presents the results of classification of SPOT high resolution visible (RHV) multispectral imagery using neural network. The test site. located near Taoyuan county of the northern Taiwan, is an agriculture area containing small ponds, bare and barren soils, vegetation. built-up land, near shore sea, and man-made buildings. The classifier is a dynamic learning neural network (DL) using the Kalman filter technique as adaptation rule. The network architecture is the multi-layer perceptrons,i.e., feed-forward nets with one or more layers of nodes bctween the input and output nodes. Methodology of selection of training data sets is addressed. Then, accordingly, selected data sets from 512x512 pixels three-band image are used to train the neural nets to categorize dilferent types of the landcover. Both simulated and real images are used to test the classification performance. Results indicate that the DL substantially reduces the training time as compared to commonly used backpropagation (BP)trained neural nctwork whose slow training process was shown to impede it from certain practical applications. As for the classification accuracy, the presented resulrs also shown to he excellent. It is concluded that the uw of dynamic learning network gives very promising classification results in terms of training time and classification accuracy. In particular, the proposed network significantly improves the practicality of the land-cover classification. I. Introduction The applications of the neural network to remote sensing is increasingly emerging in recent years and continues receiving attentions, although it is still in early stage, due to the following characteristics of a neural network[I,2,3]:(l) it has an intrinsic ability to generalize; (2) it makes a wcakcr assumptions about the statistics of the input data than a paramctiic Rayes classifier; and (3) it is capable of forming highly nonlinear decision boundaries in the feature space and therefore has the potential of outperforming a parametric Bayes classifier when a feature statistics deviate significantly from the assumed Gaussian statistics. The comparison of traditional statistical methods(such as k-nearest neighhor, and Gaussian classifier) made by Bcncdiktsson et a1141 indicates that the neural network has the potential for processing multisource remote sensing data. Heermann and Kha7enie[5] used a back-propagation neural network to classify the multispectral image data and concluded that neural network is a feaible classifier for very large volume images. Similar study way also carried out by Bischof et al [SI and showed that the neural network outperform the maximum likelihood classifier. In view of these studies. they all used hack-propagation - 896
leaming scheme which no doubt is the most popular one. Nevertheless, all these applications shows the drawback of slow learning process that inherently associated with back-propagation training scheme. In this paper, we shall use a newly developed dynamic learning neural nctwork to perform the classification of SPOT HRV image. Two scparated simulated images are constructed resembling a real image with known grey levels at each class; one is used for training the network and the other for classfication. The method of generation and simulation results are presenled in Section 2. Section 3 illustrates the experimental result using a SPOT image where the ground truth was collected when it was imaged, to show the classifying capability of the presented network. Finally, a concluding remark is included. 11. Test of Network A. Generation
of Simulated Images
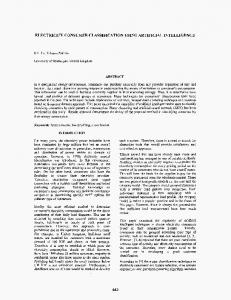
To test the performance of dynamic leaming neural network developed in [71, we use the testing image with known parameters including mean and variance of grey level at three bands for each class such that the classification accuracy can be more easily evaluated. It should be noted that the simulated images should also be generated in such a way that they remain similar spatial and spectral complexity as the actual multispectral image, if it is so. The testing image thus designed has in fact ruled out the possibility of ideal situations where the neural network may perform extremely well while with little practical value. Two images are generated for the purpose of network test: one is used for training, and the other for testing the classification. In the following, we will describe the procedures on gencrating of such images. First. select an 512 x 512-pixel frame from an arbitrary SPOT image and then apply ISODATA clustering algorithm [8] to classify it into several classes (eight classes in this study). Next, we assume that the distribution of the grey level are normal with predetermined mean and variance. The assignments of the mean and variance at each class and each band are listed in Table 1. Noted that the variability of grey levels depends on the choice of variance; larger overlap with larger variance. Then, the image(1mage 1) is formed by randomly spccifying grcy level to each class at each band according the statistical distributions. In this study, we choose variance equal to 4 for all bands and classes. The resulting image is shown in Fig. I. It is seen that the boundaries thus generatcd are rathcr complex, making the classification using conventional statistical methods very difficulf if not impossible. The second image (Imagc 11) is Constructed from another SPOT image in the same procedure pixserving similar properties hut
with different mean grey level values by one. Fig.2 shows the Image I1 which apprantly presents a different boundary pattern with Image I.
Table 1: Mean assignments, variance = 4 in all cases
B. Testing Results
The arrangement of the inputs and outputs of the neural network is illustrated in Fig.3. To present the multispectral data to network, we first encode the input data sets. The purpose of encoding of a feature, a set of data, is to provide a mean to discriminate the similarity that diminishes the accuracy of the neural network during the classification stage. The detail discussions of the issue can be found in[ IO]. The training cycle for eight classes is now compared between DL and backpropagation using delta rule as given in F i g 3 It is obviously that the BP fails to reach a predetermined error threshold which is set to be in this study, even after 200 training cycles. On the other hand, DL quickly achieves the required rms error in just a couple of iterations. Once the network has been trained using the training patterns from image I, generally, it should be able to classify images with sta~isticallysimilar response without additional training process. To illustrate this statement, we now apply the network directly to classify image 11. The resulting classification matrix is given in Table 2. As we can see, very high accuracy well over 95% for all classes under the consideration is obtained. It should be recalled that the mean grey level values of image I1 are all deviated from that of image I by one. The misclassfication rate is found to be dependent on the correlated properties of the related classes. In another word, higher overlapped may degrade the classification accuracy, which is in consistcnt with thc fact undcr the practical situations. To resolve this problem, other information contents, such as texture and radar response, are helpful for the classification. This is beyond the scope of this study and will not be addressed further here
Table 2: Classification Matrix Cor Image I1 using DL
III. Experimental Results In the previous section, we have demonstrated the excellent performance of the dynamic learning algorithm using two simulated images. Results indicate that the network training time is greatly reduced as compared to BP. while gives a very high classification accuracy. The application of DL to land-cover classification of SPOT high resolution imaginary data is now in order. A. Test Site
0.6
The test site selected for classification in this study, located near Taoyuan county of the northern Taiwan, is an agriculture area containing small ponds, bare and barren soils, vegetation, huiltup land, near shore sea, sea water wave, and man-made buildings. In this region, most areas were covered by the short vegetation within which several small ponds exist. Total of seven categories to be classified in this study based on the discriminating capability of the SPOT multi-spectral image: water. vegetation, bare soil, high reflection roof, b a m n land, sea wake, and built-up land. The false color imagery is shown in Fig.3 where The small in size but very bright area represented the highly reflective building roof. The correlation between different bands are computed to understand the correlated properties of different types of land-cover. High reflection roof is clearly the most distinguished one, while the bare land and building are not well discriminated. Also indicated is the fact that all types of landcover are almost not discernible except high reflection roof and bare soil.
0.4
B. Training Data Selection
P
Cover Class
green
0
Fig. 3. Typical configuration of the neural nenetwork
08
$
The neural network is trained by presenting a training data set of known category assignments. For the purpose of this study, we generate a set of training data by the aids of visualization and some of the ground truth. along with available base maps. The regions under these are selected as training data with total of 692 data points. The rest of the regions are then used for classification as will be presented in next section. Among them,
0.2 0 0
40
80
I20
160
203
Training Cycle
Fig. 4. Comparison of number of training cycle
-897-
high reflection roof and barren land have smallest percentage of training patterns due to a small regions they occupy in the feature space.
images using neural networks,” IEEE Trans. Geosci and Remote Sensing,28:482-489, 1992
[7]. Y.C. Tzeng and K.S. Chen, “A dynamic learning neural network using Kalman filtering technique.” submitted paper, 1993.
C. Classifcation Results
F i g 4 shows the classified image in which the major feature of the seven categories of interest can be identified. To asscs in a more derail the performance of DL neural network classifier, a set of total 2000 pixels are randomly picked up from the image frame. Additional IO00 pixels are selected to aid the assessmcnt of classification in the area of reflective roof and build-up land which are more difficulty to classify due to more complex decision boundaries. smaller occupied regions, and thus fewer representative training data sets. A simple random sampling scheme[9] is then applied to evaluate the classified map. Both 1 :5000 and 1:25OOO base maps, and field works are used as auxiliary data to assistant the performance evaluation. It is found that an overall 92% of accuracy is obtained. It should be emphasired at this point that in our previous test using the SPOT-like images, we have demonstratcd thc excellent performance of the proposed network. IV. Conclusions
The significant reduction of the training time required and high accuracy of the presented neural network using dynamic learning algorithm based on the hoth simulated and real SPOT imaginary results have k e n demonstrated. The capability of the neural network to resolve the highly nonlinear and complex decision boundary prohlems. which usually are the cases of remotely-sensed data, is also il! ustratcd. In comparison, the presented network outperforms Back-propagation network in that the newly developed learning algorithm has enhanced the practical uses in the land-cover classification from multispectral imagery. It should be emphasized that the use of Kalman filter enables the seasonal change detection from satcllite images hecause the update equation which accounts for the change of states can be incorporated into the network. This should he of interested for further investigation.
V. References [ 11. R.P. Lippmann. “An introduction to computing with neural
nets,” IEEEAcoustic, Speech and Signal processing Magnzine, 4(2):4-22, April 1987 121. D.R. Hush and B.G. Horne. “Progress in supervised neural networks,” IEEE Signal processing Magazine, 10(1):8-39, Jan. 1993
131. S. Haykin, W. Stehwien, C. Deng, P. Weber, and R. Mann, “Cla$sification of radar clutter in an air traffic control environment,” Proc. IEEE, 79(6):742-772, 1991. [4]. J.A. Benediktsson, P.H. Swain, and O.K. Ersoy, “Neural network approaches versus statistical methods in classification of multisourcc remote sensing data,” IEEE Tr0n.c. Geosci and Renmte Sensing, 28:(4), 540-552.1990.
151. P.D. Heermann and N. K h a 7 . n ~ “Classification . of multispectral remote sensing data using a hack-propagation neural network,” IEEE Trans. Geosci and Remote Sensing, 3031-88, 1992 [ 6 ] .H. Bischof. et al. “Multispectral classification of Landsat -898-
181. G.H. Ball and D.J. Hall, “Aclustering technique for summarizing multivariate data,” Behavioral Science. 12, 153155, 1967
[9]. R.G. Congalton, “A comparison of sampling schemes used in generating emor matrices for assessing the accuracy of maps generated from remotely sensed data,” Phofogrammetric Eng. & Remote Sensing. 54(5): 593-600, 1988 [ IO].J.L.McCelland, D.E. Rumelhart, and G.E. Hinton, ‘The
appcal of parallel distributed processing,” in Parallel Dislrihuted Pmcessing, vol I. Rumelhart and McCelland. Eds, Camhridgc. MA:MlT Prcss, 1986