Hindawi Publishing Corporation Journal of Artificial Evolution and Applications Volume 2009, Article ID 848532, 13 pages doi:10.1155/2009/848532
Research Article Classification of Oncologic Data with Genetic Programming Leonardo Vanneschi,1 Francesco Archetti,1, 2 Mauro Castelli,1 and Ilaria Giordani1 1 Department 2 Consorzio
of Informatics, Systems and Communication (D.I.S.Co.), University of Milano-Bicocca, 20126 Milan, Italy Milano Ricerche, 20126 Milan, Italy
Correspondence should be addressed to Leonardo Vanneschi,
[email protected] Received 14 November 2008; Revised 2 April 2009; Accepted 13 June 2009 Recommended by Jason Moore Discovering the models explaining the hidden relationship between genetic material and tumor pathologies is one of the most important open challenges in biology and medicine. Given the large amount of data made available by the DNA Microarray technique, Machine Learning is becoming a popular tool for this kind of investigations. In the last few years, we have been particularly involved in the study of Genetic Programming for mining large sets of biomedical data. In this paper, we present a comparison between four variants of Genetic Programming for the classification of two different oncologic datasets: the first one contains data from healthy colon tissues and colon tissues affected by cancer; the second one contains data from patients affected by two kinds of leukemia (acute myeloid leukemia and acute lymphoblastic leukemia). We report experimental results obtained using two different fitness criteria: the receiver operating characteristic and the percentage of correctly classified instances. These results, and their comparison with the ones obtained by three nonevolutionary Machine Learning methods (Support Vector Machines, MultiBoosting, and Random Forests) on the same data, seem to hint that Genetic Programming is a promising technique for this kind of classification. Copyright © 2009 Leonardo Vanneschi et al. This is an open access article distributed under the Creative Commons Attribution License, which permits unrestricted use, distribution, and reproduction in any medium, provided the original work is properly cited.
1. Introduction High-throughput microarrays have become one of the most important tools in functional genomics studies, and they are commonly used to address various biological questions, like disease classification and treatment prognosis. Although cancer detection and class discovery have often been studied over the past years, no general way to work out this problem has been found yet, probably because there can be many pathways causing cancer, and a tremendous number of varieties exist. Recently, array technologies have made it straightforward to measure and monitor the expression levels of thousand of genes during cellular differentiation and response. It has been shown that specific patterns of gene expression occur during different biological states such as embryogenesis, cell development, and during normal physiological responses in tissues and cells [1]. The expression of a gene provides a measure of its activity under certain biochemical conditions. The key problem of evaluation of gene expression data is to find patterns in the apparently unrelated values measured. With increasing numbers of
genes spotted on microarrays, visual inspection of these data has become impossible, and, hence, the importance of computer analysis, in particular by means of Machine Learning, has substantially increased in recent years. Wellstudied datasets of different phenotypes are publicly available to train and evaluate supervised pattern analysis algorithms for classification and diagnosis of unknown samples. Therefore, there is a strong need to build molecular classifiers made of a small number of genes, especially in clinical diagnosis, where it would not be practical to have a diagnostic assay to evaluate hundreds of genes in one test. In this study, we present an application of Genetic Programming (GP) [2] for molecular classification of cancer. In particular, we study two publicly available oncologic datasets: the first one contains data from healthy colon tissues and colon tissues affected by cancer; the second one contains data from patients affected by two different kinds of leukemia (acute myeloid leukemia and acute lymphoblastic leukemia). Four versions of GP are studied on those datasets; those GP variants differ by the way of handling the training set and by the fact that they may or may not affect training data
2 with noise. We test the usefulness of GP using two different fitness functions: the receiver operating characteristic (ROC) area under curve (AUC) and the measure of correctly classified instances (CCIs). For both these performance measures, results returned by GP are compared with the ones returned by three well-known nonevolutionary Machine Learning methods: Support Vector Machines, MultiBoosting and Random Forests. Even though (as described in the next section) GP has been previously applied by other authors to microarray data, we believe that the present manuscript contains the following interesting sources of novelty: it contains a study of various different GP versions with two different fitness measures on two different datasets, and it compares the results returned by GP with the ones of other, nonevolutionary, Machine Learning methods. The paper is structured as follows. Section 2 presents an overview of previous and related contributions. Section 3 presents the datasets that we have used, describes the four presented GP frameworks, and also introduces the three nonevolutionary Machine Learning methods whose results have been compared with the GP ones. Section 4 reports experimental results. In Section 5 we present the genotype of some of the best solutions found by GP. Finally, Section 6 concludes the paper and proposes some ideas for future research. The paper is terminated by two appendices where the most recurrent genes contained in the best solutions found by GP are defined.
2. State of the Art Given the large amount of data coming from DNA microarray analysis, in the last few years researchers have started paying a growing attention to cancer classification using gene expression. Studies have shown that gene expression changes are related with different types of cancers. Many different stochastic Machine Learning methods [3] have already been applied for microarray data analysis, like k-nearest neighbors [4], hierarchical clustering [5], self-organizing maps [6], Support Vector Machines [7, 8], or Bayesian networks [9]. All this different classification methods share some common issues that make classification a nontrivial task applied on gene expression data. In fact, the attribute space, or the number of genes, of the data is often huge: there are usually thousands to hundred thousands of genes present in each dataset. Also, if the samples are mapped to points in the attribute space, they often can be viewed as very sparse points in a very high dimensional space. Most of existing classification algorithms were not designed with this kind of data characteristics in mind. Thus, such a situation represents a challenge for most classification algorithms. Overfitting is a major problem due to the high dimension, and the small number of observations makes generalization even harder. Furthermore, most genes are irrelevant to cancer distinction: some researchers proposed to perform a gene selection prior to cancer classification to reduce data size, thus improving the running time and remove a large number of irrelevant genes which improves the classification accuracy [3].
Journal of Artificial Evolution and Applications In the last few years Evolutionary Algorithms (EAs) [10] have been used for solving both problems of selection and classification in gene expression data analysis. Genetic Algorithms (GAs) [11] have been employed for building selectors where each allele of the representation corresponds to one gene, and its state denotes whether the gene is selected or not [12]. GP on the other hand has been shown to work well for recognition of structures in large datasets [13]. GP has been applied to microarray data to generate programs that reliably predict the health/malignancy states of tissue or classify different types of tissues. An intrinsic advantage of GP is that it automatically selects a small number of feature genes during the evolution [14]. The evolution of classifiers from the initial population seamlessly integrates the process of gene selection and classifier construction. In fact, in [15] GP is used to cancer expression profiling data to select potentially informative feature genes, build molecular classifiers by mathematical integration of these genes, and classify tumour samples. Furthermore, GP has been shown a promising approach for discovering comprehensible rulebased classifiers from medical data [16] as well as gene expression profiling data [17]. Results presented in those contributions are encouraging and pave the way to a further investigation of GP for this kind of datasets, which is the goal of this paper.
3. Material and Methods 3.1. Dataset. We test our methods on two publicly available oncologic datasets: the first one contains data from healthy colon tissues and colon tissues affected by cancer and will be called Colon Dataset from now on; the second one contains data from patients affected by two different kinds of leukemia (acute myeloid leukemia and acute lymphoblastic leukemia) and will be called Leukemia Dataset from now on. These two datasets are described as follows. 3.1.1. Colon Dataset. The Colon Dataset is a collection of expression measurements from colon biopsy samples reported in [5]. The dataset consists of 62 samples of colon epithelial cells collected from colon-cancer patients. In particular the “tumour” biopsies were extracted from tumours, and the “normal” biopsies were collected from healthy parts of the colons of the same patients. The final assignments of the status of biopsy samples were made by pathological examination. Gene expression levels in these 62 samples were measured using high-density oligonucleotide arrays. Of the about 6000 genes represented in these arrays, 2000 genes were selected based on the confidence in the measured expression levels. The dataset, 62 samples over 2000 genes, is available at http://microarray.princeton.edu/ oncology/affydata/index.html. 3.1.2. Leukemia Dataset. The Leukemia Dataset (first introduced in [18]) contains data from 72 patients, half of which affected by acute myeloid leukemia and the remaining ones affected by lymphoblastic leukemia. For these patients, 7070 genes have been monitored. For measuring the
Journal of Artificial Evolution and Applications expression level of those genes, oligonucleotides microarrays produced by Affimetrix have been used. Thus, the dataset is composed by 7070 columns and 72 lines, each of which labelled with “myeloid” or “lymphoblastic” in order to separate these two kinds of leukemia. This dataset and a detailed description of it can be found at http://genecruiser .broadinstitute.org/cgi-bin/cancer/publications/pub paper .cgi?mode=view&paper id=43. 3.2. Classification Methods. After a discussion of our GP framework and variants, the Machine Learning methods used for comparing results, that is, Support Vector Machines (SVM), MultiBoosting, and Random Forests, are described here in a deliberately synthetic way, since they are wellknown and well-established techniques. References to master those methods are quoted. 3.2.1. Genetic Programming for Classification. Candidate classifiers (individuals) that are evolved by GP are Lisp-like tree expressions built using the function set F = {+, ∗, −, / } and a terminal set T composed by M floating point variables, where M is the number of columns in the dataset (i.e., M = 2000 for the Colon Dataset and M = 7070 for the Leukemia Dataset). Thus, GP individuals are arithmetic expressions (exactly the same method as in [19] has been used to avoid expressions containing divisions with a denominator equal to zero). These expressions can be transformed into binary classifiers (class “normal” for healthy tissues and class “tumour” for ill ones for the Colon Dataset; class “myeloid” for acute myeloid leukemia and class “lymphoblastic” for acute lymphoblastic leukemia for the Leukemia Dataset) by using a threshold. Here, we use two fitness functions: ROCAUC and CCI. In the first case each classifier is evaluated by a fitness function defined as the area under the ROC curve [20, 21]. In this work, the ROC curve is obtained by considering 20 different threshold values uniformly distributed in the interval [−1, 1]. For each one of these threshold values, a point is drawn having as abscissa the false positive rate and as ordinate the true positive rate obtained by the candidate classifier using that threshold. The area is calculated using the trapezoids method. The second type of fitness function is instead obtained by fixing a particular threshold value (equal to 0.5 in this work, following [14]) and calculating the CCI. CCI is defined as the correctly classify instances rate, that is, CCI = (TP + TN)/N, where TP indicates True Positives, TN specifies True Negatives, and N is the number of rows in the dataset. For calculating both these fitness values during the presented GP simulations, we have considered a static and a dynamic way of handling the training set, and we have considered training data as they are (i.e., without any explicit modification) or perturbing them with noise. These different strategies, used for improving GP generalization ability as suggested in [19], are described as follows. Static Training Set Handling. Fitness has been calculated using each line in the training set at each generation for all individuals in the population.
3 Dynamic Training Set Handling. The training set is partitioned into 5 subsets, and at each generation only 4 of those subsets are used to calculate fitness, while one of them is not used. At each 5 generations, one of the 4 used subsets is selected and replaced by the subset that was previously left unused. In this way, the training set is modified in a cyclic way at each 5 generations. The number of subsets in which the dataset has been partitioned (5) and the period of training set modifications (5 generations) have been chosen by means of a set of experiments, whose results are not reported here. No Noise Added to Data. When calculating fitness, each GP terminal symbol xi has been replaced exactly by the values in the ith column of the training set. Gaussian Noise Added to Data. Data have not been used exactly as they are in the original dataset, but a Gaussian noise (with average equal to zero and with a standard deviation equal to the datum value divided by 100) has been added to them. Each time a GP terminal symbol has to be evaluated, a new Gaussian perturbation of the original value is generated (in this way, the same variable is likely to have two slightly different values in two different fitness evaluations). Combining these different methods of handling training set and data have lead us to define four different versions of GP, that we call GP0, GP1, GP2, and GP3 for simplicity. (i) GP0 uses the static training set handling and data with no noise. This corresponds to standard GP. (ii) GP1 uses the static training set handling and data perturbed with Gaussian noise. (iii) GP2 uses the dynamic training set handling and data with no noise. (iv) GP3 uses the dynamic training set handling and data perturbed with Gaussian noise. The other parameters we have used in our GP experiments are population size of 200 individuals, ramped half-and-half initialization, tournament selection of size 7, maximum tree depth equal to 10, subtree crossover rate pc = 0.95; subtree mutation rate pm = 0.1, maximum number of generations equal to 500; furthermore, we have used generational tree-based GP with elitism, that is, unchanged copy of the best individual on the training set into the next population at each generation. 3.2.2. Other Machine Learning Methods. In this paragraph we briefly describe the other machine learning methods used for our tests. For more details on these algorithms and their use, the reader is referred to the respective references quoted here and after. Support Vector Machines. Support Vector Machines (SVMs) were originally introduced in [22]. Their aim is to device a computationally efficient way of learning separating hyperplanes in a high dimensional feature space. In this work we
4 use the implementation of John Platt’s [23] sequential minimal optimization (SMO) algorithm for training the support vector classifier. Training an SVM requires the solution of a large quadratic programming (QP) optimization problem. SMO works by breaking this large QP problem into a series of smallest ones. Parameter values used in this work are complexity parameter c equal to 1.0, size of the kernel cache equal to 1000003, epsilon value for the round-off error equal to 1 · 10−12 , exponent for the polynomial kernel equal to 1.0, and tolerance parameter equal to 0.001. All these parameter values correspond to the standard values offered by the Weka software [24]. These parameters are defined, for instance, in [23]. MultiBoosting. MultiBoosting is an extension to the classification method Adaptive Boosting (AdaBoost) [25]. AdaBoost is a meta-algorithm and can be used in conjunction with other learning algorithms to improve their performance. AdaBoost is adaptive in the sense that subsequent classifiers built are tweaked in favor of those instances misclassified by previous classifiers. Multiboosting can be viewed as combining AdaBoost with wagging. It is able to harness both AdaBoost’s high bias and variance reduction with wagging’s superior variance reduction. Using C4.5 as the base learning algorithm, multiboosting is demonstrated to produce decision committees with lower error than either AdaBoost or wagging significantly more often than the reverse over a large representative cross-section of datasets. It offers the further advantage over AdaBoost of suiting parallel execution. For more information, see [26]. Parameter values used in this work are 100 iterations, 3 subcommittees, and weight threshold for weight pruning equal to 100. All these parameter values correspond to the standard values offered by the Weka software [24]. Random Forests. Random Forests is an improved Classification and Regression Trees method [27]. It works by creating a large number of classification trees or regression trees. Every tree is built using a deterministic algorithm, and the trees are different owing to two factors. First, at each node, a best split is chosen from a random subset of the predictors rather than all of them. Secondly, every tree is built using a bootstrap sample of the observations. The out-of-bag data, approximately one-third of the observations, are then used to estimate the prediction accuracy. Unlike other tree algorithms, no pruning or trimming of the fully grown tree is involved. In this work we use the Breiman implementation presented in [28]. A number of trees equal to 300 have been used in this work. All the other parameters that we have used have been set to the standard values offered by the Weka software [24].
4. Experimental Results Results obtained by the nonevolutionary methods and by the different GP variants on the Colon Dataset and on the Leukemia Dataset are reported in Sections 4.1 and 4.2, respectively.
Journal of Artificial Evolution and Applications To obtain these results, we have generated 10 different partitions of the dataset into training and test set. For each one of these partitions, 70% of the lines in the dataset chosen at random (with uniform probability distribution) form the training set and the remaining 30% the test set (we have explicitly checked that the same training-test partition does not appear more than once). To report results in this paper, for each one of these partitions we have proceeded as follows. (i) For nondeterministic methods such as GP, Multiboosting and Random Forest, we have performed 100 independent executions, and we have retained the best values of CCI and ROC found on the test set. (ii) For SVM, which is deterministic in this work, we have retained the values of CCI and ROC on the test set of the returned solution. Thus, we have 10 values of CCI and 10 values of ROC for each method. We finally report the best, the average, and the standard deviation of these 10 solutions, both for CCI and ROC. Furthermore, we have also randomly generated 500 different training-test set partitions (also in this case 70% of the lines in the dataset chosen at random with uniform probability distribution form the training set and the remaining 30% the test set, where we have explicitly checked that the same training-test partition does not appear more than once), and we have executed one run of each one of the studied methods (both nonevolutionary ones and GP) for each one of these partitions. Results of these further experiments are reported in Section 4.3. Note on Computational Time. We have calculated the computational time for all the executions whose results are reported in Section 4.3. (i.e., 500 different executions for each Machine Learning method, each one with a different training-test partition) on a dedicated machine Intel Pentium III-500 with 128 M RAM, and we have calculated the averages of all these computational times. The various GP runs returned an average time of about 153 seconds; approximately the same average amount of time was requested by Boosting (about 155 seconds). Random Forests requested a larger average amount of time for one run (about 260 seconds); finally SVM was the fastest method (one run of SVM requested about 12 seconds on average). 4.1. Results on the Colon Dataset. Table 1 summarizes the experimental results obtained by the non-evolutionary methods on the Colon Dataset. SVM is the method that returns the best average results, both for CCI and ROC, while the best CCI results are returned by Random Forests and SVM, and the best ROC results are returned by Random Forests. We point out that we have applied these classification methods to our datasets without any explicit feature selection algorithm nor preprocessing. The motivation for this is that we wanted to compare these results with the ones obtained by GP, pointing out that GP is able to perform an automatic feature selection, while the other non-evolutionary methods do not have this capability.
Journal of Artificial Evolution and Applications
5
Table 1: Results returned by the nonevolutionary methods on the Colon Dataset. 10 different partitions of the dataset into training and test set have been considered. The best, average and standard deviations of the best CCI and ROC results obtained on each one of these 10 partitions are reported.
Best Random Forests SVM Multi Boosting
CCI Average Std. Dev.
0.9444 0.7417
0.0810
0.9444 0.8778 0.8889 0.7850
Best 1
Table 3: Results returned by the nonevolutionary methods on the Leukemia Dataset. 10 different partitions of the dataset into training and test set have been considered. The best, average, and standard deviations of the best CCI and ROC results obtained on each one of these 10 partitions are reported.
ROC Average Std. Dev. 0.8250
0.0755
0.0438
0.9545 0.8525
0.0874
0.0577
0.9861 0.8152
0.0488
Best Random Forests SVM Multi Boosting
CCI Average Std. Dev.
Best
ROC Average Std. Dev.
0.9048 0.7191
0.0939
0.9500 0.6999
0.1270
0.8571 0.7476
0.0552
0.8375 0.7274
0.0924
0.9524 0.7548
0.0733
1
0.7500
0.0895
Table 2: Results returned by the studied GP variants on the Colon Dataset. The same 10 partitions of the dataset into training and test set as in Table 1 have been considered. The best, average and standard deviations of the best CCI and ROC results obtained on each one of these 10 partitions are reported.
Table 4: Results returned by the studied GP variants on the Leukemia Dataset. The same 10 partitions of the dataset into training and test set as in Table 3 have been considered. The best, average and standard deviations of the best CCI and ROC results obtained on each one of these 10 partitions are reported.
CCI Best Average GP0 1 0.8926 GP1 1 0.8946 GP2 1 0.8947 GP3 1 0.895
CCI Best Average GP0 1 0.8323 GP1 1 0.8592 GP2 1 0.8325 GP3 1 0.8607
Std. Dev. 0.038 0.042 0.039 0.042
ROC Best Average 1 0.9437 1 0.9444 1 0.9437 1 0.9555
Std. Dev. 0.0472 0.0455 0.0455 0.0466
Table 2 reports the results obtained by the different GP variants studied using the same 10 training-test partitions as in Table 1. Comparing the results reported in Table 2 with the ones reported in Table 1, we can remark that all GP variants are able to find an ideal solution both for CCI and ROC, which is not the case for the non-evolutionary methods (with the exception of Random Trees for ROC). Also comparing the average values, we can remark that all GP variants outperform all non-evolutionary methods, and the respective standard deviations seem to hint that the difference between GP performances and the ones of the other methods is statistically relevant. Differences between the various GP variants seem marginal, which hints that both the dynamic dataset handling and the use of Gaussian noise are not useful to improve GP generalization ability, at least for this application. By the way, it has to be remarked that performances of standard GP (GP0) are already (informally) rather “high”, and thus difficult to improve. In the future, we plan to investigate the gain in using GP1, GP2, and GP3 for more complex problems, where GP0 is not able to find good solutions. 4.2. Results on the Leukemia Dataset. Results obtained by the studied non-evolutionary methods are summarized in Table 3. For the Leukemia Dataset, MultiBoosting is the method that has returned both the best results and the best average results, both for CCI and ROC. Table 4 reports the results obtained by the different GP variants studied using the same 10 training-test partitions as in Table 3. Also in this case, all GP variants outperform all non-evolutionary methods, and standard deviation values
Std. Dev. 0.0390 0.0425 0.0395 0.0407
ROC Best Average 1 0.8491 1 0.8777 0.9778 0.8500 0.9904 0.8778
Std. Dev. 0.0047 0.0400 0.0392 0.0381
seem to hint that the differences between the average results obtained by GP and the average ones obtained by the best non-evolutionary method on this dataset (MultiBoosting) are statistically relevant. All GP variants have been able to produce ideal solutions for CCI, while only GP0 and GP1 have been able to generate ideal ROC values. We finally remark that, also for the Leukemia Dataset, perturbing data with Gaussian noise or handling the training set in a dynamic way is not beneficial. 4.3. Further Experiments. In Sections 4.1 and 4.2, 10 different training-test set partitions were considered and, for each partition, 100 independent runs of each one of the nondeterministic methods (random forests, multiboosting and GP) were executed. In this section we present the results that we have obtained by considering 500 different training-test partitions and executing one run of each method for each different partition. Best, average, and standard deviations of the obtained results are reported. The other used parameters are exactly the same as the ones used to produce the results of Sections 4.1 and 4.2. Table 5 shows the results obtained by the nonevolutionary methods on these 500 different training-test partitions for the Colon dataset. The method that returns the best average results is SVM, both for CCI and ROC, even though SVM is the only method that is not able to obtain 1 as the best ROC. Results obtained by the GP variants on the same 500 training-test set partitions are shown in Table 6. All the GP variants have returned better average CCI and ROC
6
Journal of Artificial Evolution and Applications
Table 5: Results returned by the non-evolutionary methods on the Colon Dataset. 500 different partitions of the dataset into training and test set have been considered. The best, average, and standard deviations of the CCI and ROC results obtained on each one of these 500 partitions are reported.
Best Random Forests SVM Multi Boosting
CCI Average Std. Dev.
Best
ROC Average Std. Dev.
0.9444 0.8368
0.0688
1
0.8578
0.0627
0.9444 0.8567
0.0396
0.9545
0.864
0.075
0.9444 0.8295
0.051
1
0.823
0.0436
Table 6: Results returned by the studied GP variants on the Colon Dataset. The same 500 partitions of the dataset into training and test set as in Table 5 have been considered. The best, average, and standard deviations of the best CCI and ROC results obtained executing one run on each one of these 500 partitions are reported.
GP0 GP1 GP2 GP3
Best 1 1 1 1
CCI Average 0.8999 0.9038 0.9042 0.9017
Std. Dev. 0.0497 0.0499 0.0446 0.0454
Best 1 1 1 1
Table 7: Results returned by the non-evolutionary methods on the Leukemia Dataset. 500 different partitions of the dataset into training and test set have been considered. The best, average, and standard deviations of the CCI and ROC results obtained on each one of these 500 partitions are reported.
ROC Average 0.9472 0.9596 0.9528 0.9600
Std. Dev. 0.0440 0.0345 0.0385 0.0368
than the non-evolutionary methods. Furthermore, all the GP variants have returned a best CCI and best ROC equal to 1. The differences between the GP variants seem to be marginal. Finally, all the GP variants show a rather stable behavior given by the relatively small values of the standard deviations. Table 7 reports the values returned by the nonevolutionary methods on 500 different training-test partitions of the Leukemia dataset. This time, the method that has returned the best average ROC and CCI results is MultiBoosting. The results returned by the GP variants on the same 500 training-test set partitions of the Leukemia dataset are presented in Table 8. Also in this case, all the studied GP versions overcome all the studied non-evolutionary methods both for the average CCI and the average ROC. A best CCI and a best ROC value equal to 1 is found by each GP variant, and standard deviations are rather small, thus confirming that also on this dataset the studied GP variants have a rather stable behavior.
5. The Best Solutions Found by GP In this section, we report the genotype of some of the best solutions found by GP in the form of expressions in infix notation, and successively we describe the most recurrent genes contained in them (Appendices A and B). These expressions are reported here to allow the reader to have an idea of how the best solutions found by GP on the test sets look like; we do not pretend them to necessarily be the
Best Random Forests SVM Multi Boosting
CCI Average Std. Dev.
0.9048 0.7728
0.0747
0.9444 0.8153
0.0438
0.9444 0.8267
0.0611
Best 1
ROC Average Std. Dev. 0.7581
0.0873
0.8375 0.7368
0.0835
1
0.7974
0.081
Table 8: Results returned by the studied GP variants on the Leukemia Dataset. The same 500 partitions of the dataset into training and test set as in Table 7 have been considered. The best, average, and standard deviations of the best CCI and ROC results obtained executing one run on each one of these 500 partitions are reported.
GP0 GP1 GP2 GP3
Best 1 1 1 1
CCI Average 0.8348 0.8569 0.8304 0.8560
Std. Dev. 0.0419 0.0427 0.0477 0.0392
Best 1 1 1 1
ROC Average 0.8469 0.8890 0.8406 0.8871
Std. Dev. 0.0488 0.0481 0.0413 0.0470
model explaining the relationships between gene expressions and the studied pathologies. In order to build such a model, collaborations with domain experts are needed (and we are planning them in our future activity). Nevertheless, we hope that reporting those expressions here may be a starting point for this new and challenging research. Furthermore, we also report scatterplots of the Z-scores of the different genes contained in the best solutions found by GP (like, e.g., in [15]), and we show how those values are correlated when ROC and CCI are used as fitness functions. 5.1. Colon Dataset. We first report a solution with CCI = 1 on the test set found by GP0. Reported as an expression in infix notation, this solution is found in Algorithm 1. We remark that GP has performed an automatic feature selection; in fact, this solution contains only 15 over the 2000 possible genes. This fact distinguishes GP from the other studied Machine Learning, that can use a subset of features only if an explicit feature selection algorithm is executed before training (preprocessing). One of the solutions with area under the ROC curve on the test set equal to 1 returned by GP0 is K03460%X59131 ∗ (X66924 + H20709) - (T74896 + U28963) ∗ (R61359 + T86444) - (U20659 - T81460) ∗ R53941. In this case, GP’s feature selection has been even stronger: only 11 of the 2000 available genes are used by GP.
Journal of Artificial Evolution and Applications
((X51416+R99200∗X06614)%(H23544∗X61123 -T47213+M34344+(H79575-R50864)∗U18920 +R46739%(U20659+H04333) -R53941+L09604)>0.5) THEN Class = "tumour" ELSE Class = "normal" IF
Algorithm 1
(X05409%M28130+(U94855-M84526)%(U04270 ∗X55668%D28473 -(D38498-Z37976)%M96326)> 0.5) THEN Class = "tumour" ELSE Class = "normal" IF
Algorithm 2
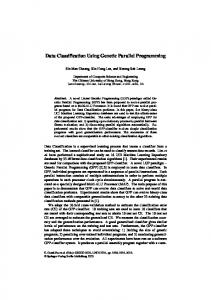
It is a widely agreed upon idea that only a restricted number of genes are correlated with tumour pathologies (those genes are often identified by domain experts as biomarkers). For this reason, the ability of GP to retain a limited number of genes into the proposed solutions is interesting. In order to identify and study the most important genes found by GP, for each one of the 4000 GP independent runs that we have performed to obtain the results reported in this paper (100 independent runs for each one of the 10 training-test different partitions and for each one of the 4 GP variants), we have retained the best solution found on the test set, both for CCI and ROC. In all those 8000 solutions, we have counted the number of occurrences of each gene in the dataset. We finally have extracted the 30 most recurrent genes. A detailed description of those genes is contained in Appendix A. Furthermore, we have considered all the genes that have appeared in at least one best solution found by GP using CCI and in at least one best solution found by GP using ROC (i.e., we have considered the set of genes contained in the best solutions found by GP using CCI, set of genes contained in the best solutions found by GP using ROC, and we have considered the intersection between these two sets). In Figure 1 we show the normalized Z-Score of these genes. Gene’s normalized Z-Score has been studied, for instance, in [15], and it is defined as follows: for a given gene i, Z-Score = (Si − E(Si ))/σ, where Si denotes the number of times genes i being contained in the studied GP solutions, E(Si ) is the expected number of times for gene i being contained in those solutions, and σ denotes the square root of the variance. The calculation of E(Si ) is ESi = (number of genes contained in the studied GP solutions)/(number of genes in the initial gene pool). Figure 1 shows the correlation between gene’s normalized Z-Score for the two fitness criteria for the four versions of GP that we have studied. For all these GP versions, normalized Z-scores seem positively correlated (Figure 1
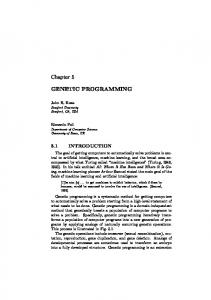
7 also reports the axis bisector, which represents the ideal correlation). 5.2. Leukemia Dataset. The genotype of one of the solutions with CCI = 1 found by GP0 is found in Algorithm 2. Also in this case, GP has operated an automatic feature selection, given that this solution contains only 10 of the 7070 possible genes. The genotype of a solution with area under the ROC curve on the test set equal to 1 returned by GP0 is (U15782 - J04990)%X04707 + X62822 - M27891 ∗ M96326. It contains only 6 of the 7070 possible genes. Also for the Leukemia dataset for each one of the 4000 GP independent runs, we have retained the best solutions found on the test set, both for CCI and ROC. In all those 8000 solutions, we have counted the number of occurrences of each gene in the dataset. We finally have extracted the 30 most recurrent genes. A detailed description of those genes is contained in Appendix B. In Figure 2 we report the correlation between the normalized Z-Scores of the genes that appear at least once in the best solutions found by GP using CCI and at least once in the best solutions found by GP using ROC. Also in this case, Z-Scores seem positively correlated (we also report the axis bisector in figure, to give an intuition of the ideal correlation).
6. Conclusions and Future Work Four different variants of Genetic Programming (GP) for classification have been presented in this paper. The difference between these four versions is that they may/may not use a cyclic algorithm to dynamically handle the training set and they may/may not perturb input data with (Gaussian) noise. These GP variants have been applied to two publicly available biomedical microarray datasets representing a collection of expression measurements from colon biopsy experiments and leukemia. One the main characteristic of these datasets is that they both contain a large number of features—that is, information about gene expressions— (2000 in the case of the colon dataset and 7070 in the case of the leukemia dataset) and a low number of samples (62 in the case of the Colon dataset and 72 for the leukemia one). We believe that GP may be a suitable method to mine these datasets, given the ability of GP to deal with complex expressions and structures and to perform an automatic feature selection. GP experiments have been executed using two different fitness functions: the ROC and the CCI. The first one of these fitness measures is calculated using a set of threshold values (20 uniformly distributed values in the range [−1, 1] in this work), while the second one is obtained by fixing a predefined threshold value (0.5 in this work, following [14]). Both those fitness measures have received a noteworthy attention in past literature, but (to the best of our knowledge) they have never been studied together before in GP applications.
8
Journal of Artificial Evolution and Applications 12
15
8
Z-score ROC
Z-score ROC
10
6 4
10
5
2 0
0
2
4
6 Z-score CCI
8
10
0
12
0
5
15
15
10
10
5
0
5
15
10
15
(b)
Z-score ROC
Z-score ROC
(a)
0
10 Z-score CCI
10
15
Z-score CCI (c)
5
0
0
5 Z-score CCI (d)
Figure 1: Normalized Z-score of the most recurrent common genes in the best solutions found by GP using CCI and ROC as fitness functions for the Colon dataset. (a): GP0, (b): GP1, (c): GP2, (d): GP3.
The experimental results returned by GP have been compared with the ones of three non-evolutionary Machine Learning methods (Support Vector Machines, MultiBoosting, and Random Forests). They show that GP is able to find better CCI and ROC results than the best non-evolutionary methods for both datasets. Even more interestingly, average results returned by GP (over a number of runs performed with different training-test partitions of the dataset) are better than the best ones returned by all the other nonevolutionary methods. Furthermore, the reported results have shown no clear difference in the performances of the different GP variants, and this seems to hint that using the proposed dynamic algorithm to handle the training set or perturbing input data with Gaussian noise is not helpful to improve GP generalization ability, at least for this particular application. We suspect that this is due to the fact that “standard GP” has good performances on these datasets, which are difficult
to improve. The other GP variants deserve to be further tested on more difficult problems, where standard GP fails to find good quality solutions or requests too large amounts of computational resources. These results are promising, even though they represent just a first preliminary step of a long term work, in which we wish to employ GP for cancer classifications in a more structured way and large scale. Many future activities are planned. First of all, we will train our GP system in a more sophisticated way, in order to improve its generalization ability. For instance, we could use more than one fitness criteria on the training set, following the idea presented in [29], where multioptimization on training is shown to increment GP generalization ability in many applications. For classification, it would be particularly interesting to use both ROC and CCI during training. Furthermore, we are planning to improve GP using more sophisticated methods for seeding the initial population compared to the standard ramped half and half method used here.
9
10
10
8
8 Z-score ROC
Z-score ROC
Journal of Artificial Evolution and Applications
6
4
2
0
6
4
2
0
2
4 6 Z-score CCI
8
0
10
0
10
10
8
8
6
4
2
0
10
(b)
Z-score ROC
Z-score ROC
(a)
5 Z-score CCI
6
4
2
0
2
4 6 Z-score CCI
8
10
(c)
0
0
5 Z-score CCI
10
(d)
Figure 2: Normalized Z-score of the most recurrent common genes in the best solutions found by GP using CCI and ROC as fitness functions for the Leukemia dataset. (a): GP0, (b): GP1, (c): GP2, (d): GP3.
One of the main limitations of this work is that we did not use any application specific problem knowledge: a “semantic” analysis of the best solutions found by GP could have helped us to generate new and possibly more effective solutions. We are currently working in this direction: we are trying to develop a sort of “application-based” feature selection, and in parallel we are trying to give a biological interpretation to solutions found by GP, trying to infer interesting properties.
Appendices A. Most Recurrent Genes Contained in the Best Solutions Found by GP for the Colon Dataset In Table 9 we describe the most recurrent genes contained in the best solutions on the test set of the Colon Dataset returned by GP. For a more detailed discussion of these genes, see http://microarray.princeton.edu/oncology/ affydata/index.html.
The first column of this table contains the gene IDs. They are entries of the GenBank database (see e.g., http://www.ncbi.nlm.nih.gov/Genbank/ for a description of this database of known genes). Other informations about these genes can be obtained by using these IDs as entries at the page: http://smd.stanford.edu/cgi-bin/source/ sourceBatchSearch.
B. Most Recurrent Genes Contained in the Best Solutions Found by GP for the Leukemia Dataset In Table 10 we present the most recurrent genes contained in the best solutions on the test set of the Leukemia Dataset returned by GP. For a more detailed discussion of these genes, see http://genecruiser.broadinstitute.org/cgi-bin/cancer/publications/pub paper.cgi?mode=view&paper id=43. Also in this case, as for the table presented in Appendix A, the first column of this table contains the gene IDs.
10
Journal of Artificial Evolution and Applications Table 9: Definition of the most recurrent genes contained in the best solutions found by GP for the Colon Dataset.
GENE ID H75955
Gene description C2H2-type zinc finger proteins, such as ZNF238, act on the molecular level as transcriptional activators or repressors and are involved in chromatin assembly.
L41268
Killer cell immunoglobulin-like receptors (KIRs) are transmembrane glycoproteins expressed by natural killer cells and subsets of T cells. The KIR genes are polymorphic and highly homologous and they are found in a cluster on chromosome 19q13.4 within the 1 Mb leukocyte receptor complex (LRC). The KIR proteins are classified by the number of extracellular immunoglobulin domains (2D or 3D) and by whether they have a long (L) or short (S) cytoplasmic domain. The ligands for several KIR proteins are subsets of HLA class I molecules; thus, KIR proteins are thought to play an important role in regulation of the immune response.
R99200
The protein encoded by this gene is a beta-amyloid peptide-binding protein. Beta-amyloid peptide has been established to be a causative factor in neuron death and the consequent dimunition of cognitive abilities observed in Alzheimer’s disease. This protein may be a target of neurotoxic beta-amyloid peptide and may mediate cellular vulnerability to beta-amyloid peptide toxicity through a G protein-regulated program of cell death.
R53941
The protein encoded by this gene is a GTPase which belongs to the RAS superfamily of small GTP-binding proteins. Members of this superfamily appear to regulate a diverse array of cellular events, including the control of cell growth, cytoskeletal reorganization, and the activation of protein kinases.
R51502
This gene encodes one of four subunits of the splicing factor 3B. The protein encoded by this gene cross-links to a region in the pre-mRNA immediately upstream of the branchpoint sequence in pre-mRNA in the prespliceosomal complex A. It also may be involved in the assembly of the B, C, and E spliceosomal complexes. In addition to RNA-binding activity, this protein interacts directly and highly specifically with subunit 2 of the splicing factor 3B.
X61123
The BTG1 gene locus has been shown to be involved in a t(8;12)(q24;q22) chromosomal translocation in a case of B-cell chronic lymphocytic leukemia. It is a member of a family of antiproliferative genes. BTG1 expression is maximal in the G0/G1 phases of the cell cycle and downregulated when cells progressed through G1. It negatively regulates cell proliferation.
H05814
This gene encodes a DEAD box protein. DEAD box proteins, characterized by the conserved motif Asp-Glu-Ala-Asp (DEAD), are putative RNA helicases. They are implicated in a number of cellular processes involving alteration of RNA secondary structure.
X66363 K03460
K02566
It may play a role in signal transduction cascades in terminally differentiated cells. This gene is thought to escape X inactivation. Tubulin is the major constituent of microtubules. It binds two moles of GTP, one at an exchangeable site on the beta chain and one at a nonexchangeable site on the alpha-chain. The active peptide bradykinin that is released from HMW-kininogen shows a variety of physiological effects: (4A) influence in smooth muscle contraction; (4B) induction of hypotension; (4C) natriuresis and diuresis; (4D) decrease in blood glucose level; (4E) it is a mediator of inflammation and causes (4E1) increase in vascular permeability; (4E2) stimulation of nociceptors (4E3) release of other mediators of inflammation (e.g., prostaglandins); (4F) it has a cardioprotective effect (directly via bradykinin action, indirectly via endothelium-derived relaxing factor action).
H05978
It could have a dual role in dynein targeting and in ACTR1A/Arp1 subunit of dynactin pointed-end capping. It could be involved in ACTR1A pointed-end binding and in additional roles in linking dynein and dynactin to the cortical cytoskeleton.
U20659
This gene encodes the seventh largest subunit of RNA polymerase II, the polymerase responsible for synthesizing messenger RNA in eukaryotes. In yeast, the association of this subunit with the polymerase under suboptimal growth conditions indicates that it may play a role in regulating polymerase function.
X17042
This gene encodes a protein best known as a hematopoietic cell granule proteoglycan. Proteoglycans stored in the secretory granules of many hematopoietic cells also contain a protease-resistant peptide core, which may be important for neutralizing hydrolytic enzymes. This encoded protein was found to be associated with the macromolecular complex of granzymes and perforin, which may serve as a mediator of granule-mediated apoptosis.
Z49269
This gene, CCL14, is one of several CC cytokine genes clustered on 17q11.2. The CC cytokines are secreted proteins characterized by two adjacent cysteines. The cytokine encoded by this gene induces changes in intracellular calcium concentration and enzyme release in monocytes.
H41017
Mitochondrial creatine (MtCK) kinase is responsible for the transfer of high-energy phosphate from mitochondria to the cytosolic carrier, creatine. Many malignant cancers with poor prognosis have shown overexpression of ubiquitous mitochondrial creatine kinase.
L09159 U31216
It regulates a signal transduction pathway linking plasma membrane receptors to the assembly of focal adhesions and actin stress fibers. L-glutamate is the major excitatory neurotransmitter in the central nervous system and activates both ionotropic and metabotropic glutamate receptors. Glutamatergic neurotransmission is involved in most aspects of normal brain function and can be perturbed in many neuropathologic conditions.
Journal of Artificial Evolution and Applications
11 Table 9: Continued.
GENE ID
Gene description
H20709
Myosin is a hexameric ATPase cellular motor protein. This gene encodes a myosin alkali light chain, that is, expressed in smooth muscle and nonmuscle tissues.
R15876
This gene encodes subunit 3 of the splicing factor 3a protein complex.
R43914
DNA- and RNA-binding protein is involved in several nuclear processes such as pre-mRNA splicing, apoptosis, and transcription regulation. In association with FUBP1 it regulates MYC transcription at the P2 promoter through the core-TFIIH basal transcription factor, involved in apoptosis induction when overexpressed in HeLa cells. Isoform 6 failed to repress MYC transcription and inhibited FIR-induced apoptosis in colorectal cancer. Isoform 6 may contribute to tumor progression by enabling increased MYC expression and greater resistance to apoptosis in tumors than in normal cells.
H79575
This gene encodes fibronectin, a glycoprotein present in a soluble dimeric form in plasma, and in a dimeric or multimeric form at the cell surface and in extracellular matrix. Fibronectin is involved in cell adhesion and migration processes including blood coagulation, host defense, and metastasis.
Table 10: Definition of the most recurrent genes contained in the best solutions found by GP on the Leukemia Dataset. GENE ID Gene description Elastases form a subfamily of serine proteases that hydrolyze many proteins in addition to elastin. Humans have six elastase genes which encode the structurally similar proteins elastase 1, 2, 2A, 2B, 3A, and 3B. Elastase 2 hydrolyzes proteins within M20203 specialized neutrophil lysosomes, called azurophil granules, as well as proteins of the extracellular matrix following the protein’s release from activated neutrophils. M28130
The protein encoded by this gene is a member of the CXC chemokine family. This chemokine is one of the major mediators of the inflammatory response. This chemokine is secreted by several cell types. It functions as a chemoattractant and is also a potent angiogenic factor. This gene is believed to play a role in the pathogenesis of bronchiolitis, a common respiratory tract disease caused by viral infection.
M84526
The protein encoded by this gene is a member of the trypsin family of peptidases. The encoded protein is a component of the alternative complement pathway best known for its role in humoral suppression of infectious agents. This protein is also a serine protease, that is, secreted by adipocytes into the bloodstream. Finally, the encoded protein has a high level of expression in fat, suggesting a role for adipose tissue in immune system biology.
M96326
Azurophil granules, specialized lysosomes of the neutrophil, contain at least 10 proteins implicated in the killing of microorganisms. The protein encoded by this gene is an azurophil granule antibiotic protein, with monocyte chemotactic and antibacterial activity. It is also an important multifunctional inflammatory mediator.
Z69881
This gene encodes one of the SERCA Ca(2+)-ATPases, which are intracellular pumps located in the sarcoplasmic or endoplasmic reticula of muscle cells. This enzyme catalyzes the hydrolysis of ATP coupled with the translocation of calcium from the cytosol to the sarcoplasmic reticulum lumen and is involved in calcium sequestration associated with muscular excitation and contraction. Alternative splicing results in multiple transcript variants encoding different isoforms.
D80006
It may provide positional cues for axon pathfinding and patterning in the central nervous system.
J04990
The protein encoded by this gene, a member of the peptidase S1 protein family, is found in azurophil granules of neutrophilic polymorphonuclear leukocytes. The encoded protease has a specificity similar to that of chymotrypsin C, and may participate in the killing and digestion of engulfed pathogens and in connective tissue remodeling at sites of inflammation. Transcript variants utilizing alternative polyadenylation signals exist for this gene.
U32944
Cytoplasmic dyneins are large enzyme complexes with a molecular mass of about 1200 kD. They contain two force-producing heads formed primarily from dynein heavy chains and stalks linking the heads to a basal domain, which contains a varying number of accessory intermediate chains. The complex is involved in intracellular transport and motility. The protein described in this record is a light chain and exists as part of this complex but also physically interacts with and inhibits the activity of neuronal nitric oxide synthase. Binding of this protein destabilizes the neuronal nitric oxide synthase dimer, a conformation necessary for activity, and it may regulate numerous biologic processes through its effects on nitric oxide synthase activity.
X55668
Polymorphonuclear leukocyte serine protease degrades elastin, fibronectin, laminin, vitronectin, and collagen types I, III, and IV (in vitro) and causes enphysema when administered by tracheal insufflation to hamster.
X74262
This gene encodes a ubiquitously expressed nuclear protein which belongs to a highly conserved subfamily of WD-repeat proteins. It is present in protein complexes involved in histone acetylation and chromatin assembly. It is part of the Mi-2 complex which has been implicated in chromatin remodeling and transcriptional repression associated with histone deacetylation. This encoded protein is also part of corepressor complexes, which is an integral component of transcriptional silencing. It is found among several cellular proteins that bind directly to retinoblastoma protein to regulate cell proliferation. This protein also seems to be involved in transcriptional repression of E2F-responsive genes.
12
Journal of Artificial Evolution and Applications Table 10: Continued.
GENE ID Gene description Defensins are a family of microbicidal and cytotoxic peptides thought to be involved in host defense. The protein encoded by M26602 this gene, defensin, alpha 1, is found in the microbicidal granules of neutrophils and likely plays a role in phagocyte-mediated host defense. M57731
It is produced by activated monocytes and neutrophils and expressed at sites of inflammation. Hematoregulatory chemokine, which, in vitro, suppresses hematopoietic progenitor cell proliferation. GRO-beta(5-73) shows a highly enhanced hematopoietic activity.
M27891
This gene is located in the cystatin locus and encodes the most abundant extracellular inhibitor of cysteine proteases, which is found in high concentrations in biological fluids and is expressed in virtually all organs of the body. A mutation in this gene has been associated with amyloid angiopathy.
U05259
The B lymphocyte antigen receptor is a multimeric complex that includes the antigen-specific component, surface immunoglobulin (Ig). Surface Ig noncovalently associates with two other proteins, Ig-alpha and Ig-beta, which are necessary for expression and function of the B-cell antigen receptor. This gene encodes the Ig-alpha protein of the B-cell antigen component.
U85767
This gene is one of several cytokine genes clustered on the q-arm of chromosome 17. Cytokines are a family of secreted proteins involved in immunoregulatory and inflammatory processes. The CC cytokines are proteins characterized by two adjacent cysteines. The cytokine encoded by this gene displays chemotactic activity on resting T lymphocytes and monocytes, lower activity on neutrophils and no activity on activated T lymphocytes. The protein is also a strong suppressor of colony formation by a multipotential hematopoietic progenitor cell line.
J04615
The protein encoded by this gene is one polypeptide of a small nuclear ribonucleoprotein complex and belongs to the snRNP SMB/SMN family. The protein plays a role in pre-mRNA processing, possibly tissue-specific alternative splicing events. Although individual snRNPs are believed to recognize specific nucleic acid sequences through RNA-RNA base pairing, the specific role of this family member is unknown.
X17042
This gene encodes a protein best known as a hematopoietic cell granule proteoglycan. Proteoglycans stored in the secretory granules of many hematopoietic cells also contain a protease-resistant peptide core, which may be important for neutralizing hydrolytic enzymes. This encoded protein was found to be associated with the macromolecular complex of granzymes and perforin, which may serve as a mediator of granule-mediated apoptosis.
M63438
HLA-C belongs to the HLA class I heavy chain paralogues. This class I molecule is a heterodimer consisting of a heavy chain and a light chain (beta-2 microglobulin). The heavy chain is anchored in the membrane. Class I molecules play a central role in the immune system by presenting peptides derived from endoplasmic reticulum lumen.
X95735
Focal adhesions are actin-rich structures that enable cells to adhere to the extracellular matrix and at which protein complexes involved in signal transduction assemble. Zyxin is a zinc-binding phosphoprotein that concentrates at focal adhesions and along the actin cytoskeleton. Zyxin has an N-terminal proline-rich domain and three LIM domains in its C-terminal half. The proline-rich domain may interact with SH3 domains of proteins involved in signal transduction pathways while the LIM domains are likely involved in protein-protein binding. Zyxin may function as a messenger in the signal transduction pathway that mediates adhesion-stimulated changes in gene expression and may modulate the cytoskeletal organization of actin bundles.
M69043
It inhibits the activity of dimeric NF-kappa-B/REL complexes by trapping REL dimers in the cytoplasm through masking of their nuclear localization signals. On cellular stimulation by immune and proinflammatory responses, it becomes phosphorylated promoting ubiquitination and degradation, enabling the dimeric RELA to tranlocate to the nucleus and activate transcription.
U49869
This gene encodes ubiquitin, one of the most conserved proteins known. Ubiquitin is required for ATP-dependent, nonlysosomal intracellular protein degradation of abnormal proteins and normal proteins with a rapid turnover. Ubiquitin is covalently bound to proteins to be degraded and presumably labels these proteins for degradation. Ubiquitin also binds to histone H2A in actively transcribed regions but does not cause histone H2A degradation, suggesting that ubiquitin is also involved in regulation of gene expression. This gene consists of three direct repeats of the ubiquitin coding sequence with no spacer sequence. Consequently, the protein is expressed as a polyubiquitin precursor with a final amino acid after the last repeat.
M17733
This gene encodes an actin sequestering protein which plays a role in regulation of actin polymerization. The protein is also involved in cell proliferation, migration, and differentiation. This gene escapes X inactivation and has a homolog on chromosome Y.
M19507
Myeloperoxidase (MPO) is a heme protein synthesized during myeloid differentiation that constitutes the major component of neutrophil azurophilic granules.
U46751
It is an adapter protein which binds ubiquitin and may regulate the activation of NFKB1 by TNF-alpha, nerve growth factor (NGF), and interleukin-1. It may play a role in titin/TTN downstream signaling in muscle cells, may regulate signaling cascades through ubiquitination, may be involved in cell differentiation, apoptosis, immune response, and regulation of K(+) channels.
X52056
This gene encodes an ETS-domain transcription factor that activates gene expression during myeloid and B-lymphoid cell development.
Journal of Artificial Evolution and Applications They are entries of the GenBank database (see e.g., http:// www.ncbi.nlm.nih.gov/Genbank/ for a description of this database of known genes). Other informations about these genes can be obtained by using these IDs as entries at the page http://smd.stanford.edu/cgi-bin/source/sourceBatchSearch.
References [1] P. Russel, Fundamentals of Genetics, Addison-Wesley, Reading, Mass, USA, 2000. [2] J. Koza, Genetic Programming, MIT Press, Cambridge, Mass, USA, 1992. [3] Y. Lu and J. Han, “Cancer classification using gene expression data,” Information Systems, vol. 28, no. 4, pp. 243–268, 2003. [4] D. Michie, D.-J. Spiegelhalter, and C.-C. Taylor, Machine Learning, Neural and Statistical Classification, Prentice-Hall, Upper Saddle River, NJ, USA, 1994. [5] U. Alon, N. Barkai, D. A. Notterman, et al., “Broad patterns of gene expression revealed by clustering analysis of tumor and normal colon tissues probed by oligonucleotide arrays,” Proceedings of the National Academy of Sciences of the United States of America, vol. 96, no. 12, pp. 6745–6750, 1999. [6] A. L. Hsu, S.-L. Tang, and S. K. Halgamuge, “An unsupervised hierarchical dynamic self-organizing approach to cancer class discovery and marker gene identification in microarray data,” Bioinformatics, vol. 19, no. 16, pp. 2131–2140, 2003. [7] I. Guyon, J. Weston, S. Barnhill, and V. Vapnik, “Gene selection for cancer classification using support vector machines,” Machine Learning, vol. 46, no. 1–3, pp. 389–422, 2002. [8] J. C. Hernandez, B. Duval, and J.-K. Hao, “A genetic embedded approach for gene selection and classification of microarray data,” in Proceedings of the 5th European Conference on Evolutionary Computation, Machine Learning and Data Mining in Bioinformatics (EvoBIO ’07), vol. 4447 of Lecture Notes in Computer Science, pp. 90–101, Springer, Valencia, Spain, April 2007. [9] N. Friedman, M. Linial, I. Nachman, and D. Pe’er, “Using Bayesian networks to analyze expression data,” Journal of Computational Biology, vol. 7, no. 3-4, pp. 601–620, 2000. [10] J. H. Holland, Adaptation in Natural and Artificial Systems, University of Michigan Press, Ann Arbor, Mich, USA, 1975. [11] D. E. Goldberg, Genetic Algorithms in Search, Optimization and Machine Learning, Addison-Wesley, Reading, Mass, USA, 1989. [12] J. J. Liu, G. Cutler, W. Li, et al., “Multiclass cancer classification and biomarker discovery using GA-based algorithms,” Bioinformatics, vol. 21, no. 11, pp. 2691–2697, 2005. [13] J.-H. Moore, J.-S. Parker, and L.-W. Hahn, “Symbolic discriminant analysis for mining gene expression patterns,” L. De Raedt and P. Flach, Eds., vol. 2167 of Lecture Notes in Artificial Intelligence, pp. 372–381, Springer, Berlin, Germany, 2001. [14] M. Rosskopf, H. A. Schmidt, U. Feldkamp, and W. Banzhaf, “Genetic programming based DNA microarray analysis for classification of tumour tissues,” Tech. Rep. 2007-03, Memorial University of Newfoundland, 2007. [15] J. Yu, J. Yu, A. A. Almal, et al., “Feature selection and molecular classification of cancer using genetic programming,” Neoplasia, vol. 9, no. 4, pp. 292–303, 2007. [16] C. C. Bojarczuk, H. S. Lopes, and A. A. Freitas, “Data mining with constrained-syntax genetic programming: applications to medical data sets,” in Proceedings of the Intelligent Data Analysis in Medicine and Pharmacology, 2001.
13 [17] J.-H. Hong and S.-B. Cho, “The classification of cancer based on DNA microarray data that uses diverse ensemble genetic programming,” Artificial Intelligence in Medicine, vol. 36, no. 1, pp. 43–58, 2006. [18] T. R. Golub, D. K. Slonim, P. Tamayo, et al., “Molecular classification of cancer: class discovery and class prediction by gene expression monitoring,” Science, pp. 531–537, 1999. [19] M. Keijzer, “Scaled symbolic regression,” Genetic Programming and Evolvable Machines, vol. 5, no. 3, pp. 259–269, 2004. [20] C. E. Metz, “Basic principles of ROC analysis,” Seminars in Nuclear Medicine, vol. 8, no. 4, pp. 283–298, 1978. [21] M. H. Zweig and G. Campbell, “Receiver-operating characteristic (ROC) plots: a fundamental evaluation tool in clinical medicine,” Clinical Chemistry, vol. 39, no. 4, pp. 561–577, 1993. [22] V. Vapnik, Statistical Learning Theory, John Wiley & Sons, New York, NY, USA, 1998. [23] J. Platt, “Fast training of support vector machines using sequential minimal optimization,” in Advances in Kernel Methods: Support Vector Learning, B. Schoelkopf, C. Burges, and A. Smola, Eds., MIT Press, Cambridge, Mass, USA, 1998. [24] Weka, a multi-task machine learning software developed by Waikato University, http://www.cs.waikato.ac.nz/ml/weka/. [25] Y. Freund and R. E. Schapire, “A decision-theoretic generalization of on-line learning and an application to boosting,” Journal of Computer and System Sciences, vol. 55, no. 1, pp. 119–139, 1997. [26] G. I. Webb, “MultiBoosting: a technique for combining boosting and wagging,” Machine Learning, vol. 40, no. 2, pp. 159–196, 2000. [27] L. Breiman, J. H. Friedman, R. A. Olshen, and C. J. Stone, Classification and Regression Trees, Wadsworth International Group, Belmont, Calif, USA, 1984. [28] L. Breiman, “Random forests,” Machine Learning, vol. 45, no. 1, pp. 5–32, 2001. [29] L. Vanneschi, D. Rochat, and M. Tomassini, “Multioptimization for generalization in symbolic regression using genetic programming,” in Proceedings of the 2nd Annual Italian Workshop on Artificial Life and Evolutionary Computation (WIVACE ’07), G. Nicosia, et al., Ed., 2007.