NordiCHI 2006, 14-18 October 2006
Papers
Classification of Usability Problems (CUP) Scheme: Augmentation and Exploitation Sigurbjörg Gróa Vilbergsdóttir1, Ebba Thora Hvannberg2 University of Iceland Hjardarhaga 2-6, 107 Reykjavik, Iceland 1
[email protected],
[email protected]
Effie Lai-Chong Law Eidgenössische Technische Hochschule Zürich Gloriastrasse 35, CH-8902, Zürich, Switzerland
[email protected]
ABSTRACT
knowledge about the abstraction level of the problem might help to motivate a solution. Finally, comprehension of the problem’s root cause in developer’s work is searched so that the reoccurrence of such a defect type may be prevented in the future. Several defect classification schemes have been suggested, but a few of them are tailored specifically for human computer interaction development, including Classification of Usability Problems, or CUP.
Existing defect classification schemes are mainly used to characterize software defects. A few of them are specifically applicable to usability problems, but they have not been validated and their reliability has been assessed in a limited way. The aim of this study is to evaluate comprehensively the Classification Usability Problems (CUP) scheme. First, the reliability was evaluated with raters of different levels of expertise and experience in using CUP. Second, the acceptability was assessed with a questionnaire. Third, the validity was assessed with developers in a field study. Results show that some form of training is required for inexperienced evaluators to exploit CUP fully, but a simplified version of CUP may still be useful for developers and usability practitioners. The evaluation framework employed proved effective for revising CUP and may be applied to validate other related schemes.
There are three major rationales underpinning the current work. (1) To expand the scale and scope of studying reliability of the classification scheme with usability practitioners of different levels of expertise in applying CUP and domain knowledge. (2) To assess the acceptability of CUP among its users. (3) To establish the validity of CUP by assessing its usefulness during the redesign of the system of interest.
Author Keywords
RELATED WORK
The Classification of Usability Problems (CUP) scheme was developed by Hvannberg and Law [13]. The basic justification behind the creation of CUP is that defects (i.e. a list of usability problems) identified in usability tests will much enhance product quality and process improvement if precise and concrete information about these defects can be presented to the development team. The development of CUP was inspired by Freimut’s [9] proposed structure of a Defect Classification System (DCS). Other existing DCSs were also used as reference frameworks such as: Card [3], Chillarege et al. [4], Grady [10], Lezak et al. [16] and Mays et al. [17]. Hvannberg and Law [13] adjusted the granularity of existing attributes and their subsuming values and created new values to meet the specific needs of user interface developers. A number of attributes from other DCSs are not relevant because in principle when usability problems (UPs) are classified, the raters as usability engineers do not necessarily have access to the source code of the interface. To better understand the basis of CUP and its distinction from other DCS, three DCSs were selected for comparison to CUP. They are: Orthogonal Defect Classification (ODC) [4, 9], Root Cause Defect Analysis (RCA) [16] and User Action Framework (UAF) [2]. These three schemes were selected because we believe they have most relevance to CUP. An important factor that all four
Usability, defect classification, think-aloud, user test, validity, reliability, acceptance. ACM Classification Keywords
H.5.2 [Information Interfaces and Presentation]: User Interfaces -- Evaluation/methodology
INTRODUCTION
All too often, a method or a tool is suggested for developers of software, without prior understanding of their ways of working and lacking the validity of the method based on empirical knowledge. The same can be said of the work of designers and evaluators of user interfaces. In particular, better definition and understanding of usability problems is needed. Once the problem is understood, an enhanced Permission to make digital or hard copies of all or part of this work for personal or classroom use is granted without fee provided that copies are not made or distributed for profit or commercial advantage, and that copies bear this notice and the full citation on the first page. To copy otherwise, to republish, to post on servers or to redistribute to lists, requires prior specific permission and/or a fee. NordiCHI 2006: Changing Roles, 14-18 October 2006, Oslo, Norway
Copyright 2006 ACM ISBN 1-59593-325-5/06/0010…$5.00
281
NordiCHI 2006, 14-18 October 2006
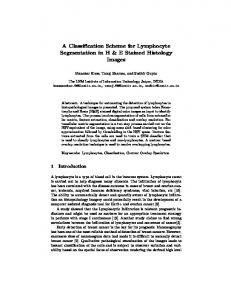
Attribute Defect ID Frequency Trigger
Context Description Defect Removal Activity
Impact
Severity Task Efficiency (%/min) Completion Task rate Effectiveness Mean time on task (min) Instances of Frustration Instances of Help Sought
Only for UPs found using user tests (UT), calculations based on the tasks scenario that the user was performing.
Failure Qualifier
Describes how the user/expert experienced a UP: Missing, Incongruent Mental Model, Irrelevant, Wrong, Better Way and Overlooked.
Expected Phase
Indicates in which phase of a software development lifecycle the developer is expected to be able to fix the UP: Task analysis and context of use (TAN), Functional requirements (FUR), Quality attribute analysis (QAN), Conceptual modelling (COM), Dialogue design (DIA), Navigational design (NAV), Presentation design (PRE) and Implementation (IMP)
Type of Fault Removed
Cause
Error Prevention Technique
assessed the validity of the scheme, but the current study of CUP attempts to do so as described in section Validity analysis. Only CUP and UAF have systematically evaluated reliability. The current study aims to evaluate CUP’s reliability more extensively as described in the section Reliability Analysis. None of the schemes have evaluated user acceptance. All the schemes except CUP estimated the mean effort for applying the scheme. We view this as an important dimension, which the current study aims to estimate.
Values Identification number Number of users/experts that experience/predict a UP Describes what an user is doing when s/he discovers the UP i.e. task scenario, heuristic, reflective question Describes in what part of the user interface the user/expert was when the UP occurred Concise description of the UP Usability Evaluation Method e.g. user test and heuristic evaluation Indicates what effects the UP had on the user/expert: Severe, Moderate, and Minor.
Actual Phase
Papers
CLASSIFICATION OF USABILITY PROBLEMS (CUP) Goal
The goal of a defect classification scheme has to be clear and serve the needs of an organization to improve the quality of the system under development and the development process. Specifically, the goal of CUP is: Classify Usability Problems (UPs) further in order to give the developers better feedback to improve their understanding of the UP, help them manage the maintenance of usability, enable them to find effective fixes for UPs as well as preventing such problems from reoccurring in the future. Application of CUP
The CUP scheme can be divided into two parts, Pre-CUP and Post-CUP. Pre-CUP consists of nine attributes that describe in more detail UPs that are found in usability testing by representative end-users or usability experts. Those results are presented to developers. After some or all of the UPs have been corrected, the developers record four attributes in Post-CUP. The following section provides an overview of the attributes. It also discusses the two changes that were made to the original CUP scheme for this study before the reliability and validity analysis were carried out. Attributes and Attribute Values
Table 1 shows short definitions of the CUP attributes and lists their values, with the four Post-CUP attributes highlighted in grey. In response to developers'comments, two attributes were added to the original Pre-CUP scheme [13], Frequency and Context. The developers were interested in knowing how many users/experts experience/predict a particular UP. It provides the developer with an idea of how much different users/experts agree on that particular UP. In the Context variable, a screenshot from the user interface can be used for additional information and clarification. This was added to separate the context description from the UP description itself and to make it easier to group the UPs according to their context. The definitions of the Failure Qualifier values are as follows: Missing: When the test participant fails to find something in the user interface that she expected to be present. Incongruent mental model: When the user interface is unclear, because it does not match the test participant’s mental model or her previous experience.
The phase where the UP was fixed: Same values as Expected Phase. Describes what in the user interface was changed to fix the UP. Aimed to understand why the developers committed the error: Personal, Communication, Technical, Methodological, Managerial and Review. Ideas on what can be done in the future to prevent the fault
Table 1 List of CUP attributes and their values. The Post-CUP attributes are highlighted in grey.
schemes have in common is that none of them have 282
NordiCHI 2006, 14-18 October 2006
Papers
The size of the application is roughly 11 thousand lines of code and the first version was released four years ago.
Irrelevant: When the user interface contains information/object that, while perhaps true, does not contribute to system services and is not needed. Wrong: When the test participant can notice that something has gone wrong e.g. an apparent programming bug. Better way: When the test participant suggests that something in the user interface could have been done differently. Overlooked: When the test participant is given a task but she overlooks an entity in the user interface, i.e. the user does not see the existing entity or fails to realize that she is supposed to interact with it.
Method and Procedure
Eleven participants were recruited for the user tests (UT), five teachers and six students. The student participants were paid about €32 for participating in the tests. None of the participants had used the Owl Teaching Version 2.0 in their courses. The user groups had different tasks that they were required to perform but both groups had nine task scenarios covering the core functionalities of their user group. While performing the tasks, the participants were asked to think aloud. At all the sessions, an assistant UT tester was present and he recorded the test participant’s thinking aloud verbatim. The sessions were also recorded using Camtasia Studio [21] to capture screen activity and the audio of thinking aloud verbatim.
When designing the attribute Expected phase we had two objectives. First, an indication of in what development phase the problem originated, could help the developer fix it. Thus, if the phases are too few, e.g. only requirement analysis and prototyping, the variable may not help the developer. Second, the phases need to reflect current practices so that the phases are likely familiar to usability engineers and developers. With this in mind, we coarsely analyzed the current literature on user interface lifecycles. To meet the first goal above, we selected lifecycle models and integrated the phases into the Expected phase variable. The lifecycle models were Constantine and Lockwood’s model [5], Idiom [22] and Hudson’s UCUML [12]. We hoped that they would be candidates for our second goal because of their wide dissemination, maturity and acceptance in practice. The Expected phase variable is not described in more detail here but the reader is referred to Hvannberg and Law [13] or an available handbook of CUP. For the study described in this paper, we have conducted three tests for different purposes. (i) User tests with 11 participants to obtain a list of usability problems used as a baseline in the next two tests. (ii) Reliability tests with eight novice participants and two experts to assess the reliability of CUP. (iii) Presentation of the Pre-CUP classification to two developers in a field study to assess the validity of the scheme.
Measurements
The performance measures were mainly obtained through observations, including time on task, number of screens of online help consulted, and number of instances of expressed frustration. Primarily, the test participants reported the subjective measures in a think-aloud verbatim protocol, post-task and post-test questionnaires. The users experienced in total 112 usability problems (UPs). The UPs were filtered by consolidating those that were the same, i.e. the users experienced same types of problems in the same parts of the application. This is done by going over the list of UPs, one at a time, and checking whether a similar UP has come up previously on the list. After the filtering, there were 71 unique UPs, 46 in the teachers group and 25 in the student group. Of the 71 unique UPs there were: 26 Minor, 30 Moderate and 15 severe. The average number of UPs experienced per user was 10.2 (SD=4.0, N=11). Reliability and Acceptance Studies
The reliability of the CUP scheme depends on its repeatability. It is only repeatable if there exists consistent shared understanding of the scheme. The classification of defects is a subjective exercise, and therefore it is possible that different raters classify the same defect differently. The credibility of defect data is unconvincing if such disagreement in classifications is dominant [13]. The reliability analysis only addresses the Pre-CUP attributes because they constitute the feedback that developers receive from the usability testing. Concerning the reliability and acceptance of the Pre-CUP scheme, we aim to answer the following three questions to meet the first, ((1) Reliability, RQ1, RQ2), and the second goal listed in the introduction ((2) Acceptance, AQ1)):
RESEARCH METHODOLOGY User test
The purpose of the user test, reported in this section, is to produce data that will be used in the two studies on validity and reliability. Application
This study uncovers defects in a user interface, called the Owl Teaching Web Version 2.0, with a think-aloud user test. It is a university learning management system, which allows teachers to manage their courses online. The application has two user groups, teachers and students. Teachers can provide students with online course materials e.g. lecture notes and web links, send announcements to students, create online discussions and they can also maintain a calendar of events in their course. The student group has fewer functions available to them and mainly uses the system to access the provided learning resources.
RQ1: How reliable is the Pre-CUP scheme among a group of novice raters? RQ2: To what extent is the level of interrater agreement influenced by the raters’ expertise in applying Pre-CUP scheme and by their involvement in usability testing the application? 283
NordiCHI 2006, 14-18 October 2006
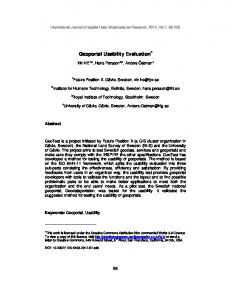
8 Participants
90 minutes presentation about CUP, read CUP materials and try out the Owl system
27 presentation slides 5 page booklet about CUP
Experimental Treatment
Access to the Owl system 21 UPs
1. Pre-questionnaire 2. Rate 21 UPs
Papers
Experimental Tasks
3. Post-experiment questionnaire
7 screenshots Excel template for rating results
Measures
v. Identify 21 UPs of those extracted in iv that cover most of the attribute values i.e. at least one UP from each of the values of the attributes Expected Phase, and Failure Qualifier. At step i, the UPs were classified according to 18 tasks. At step iii, 40 UPs were extracted. The rationale of step v was to maximize the number of types of UPs with different attributes and attribute values, thereby allowing the reliability test participants to work on various types of UPs. After step v, we ended up with about 30% of the total UPs or 21 UPs.
a. Time spent on preparation for experimental tasks
At step ii, two raters were involved that will be referred to as CUP expert and UT expert. The CUP expert has better knowledge about CUP than does the User Test (UT) expert but she conducted the UT. The UT expert carried out the selection process and prepared the data on the 21 UPs i.e. filled out the Defect ID, Context, Description, Defect Removal Activity and Trigger attributes. The agreement between the experts on the severity rating was only fair (kappa value =0.303). The CUP expert received the same materials as the Pre-CUP experiment participants who all deal with so-called ‘second hand’ data about the UPs because they did not conduct the UT themselves.
b. Time spent on PRE-CUP rating c. Interrater reliability d. Agreement with the CUP expert
Owl system
e. Perceived Ease of Use f. Perceived Usefulness g. Intention to Use
Figure 1 Experiment Design
AQ1: To what extent do evaluators’ perceived ease of use and usefulness of the CUP scheme relate to their intention to adopt it in the future?
Participants
To answer these questions an experiment was conducted which is described in detail in the following section and illustrated in Figure 1.
Eight participants were recruited to participate in the reliability experiment and they were each paid about €64 for their participation. There were four master degree students, two bachelor degree students and two developers working in industry. Three of the master’s degree students were studying computer science and one was studying bioinformatics. The bachelor’s degree students were from computer science and industrial engineering. One of the software developers held a bachelor’s degree in computer science and the other a master’s degree in language technology.
Selection of Usability Problems for Experiment
There were in total 71 unique UPs identified in the user test of the Owl application. We developed a scheme to select a subset of UPs to use in the reliability experiment. When developing the scheme we kept in mind that the classification should not take more than about 90 minutes for the participants because otherwise they would get tired. We anticipated that the participants should be able to rate about 20 UPs in 90 minutes. We reviewed two selection schemes. A case study of Root Cause Analysis [16] used a rather complicated scheme where many items had to be selected, and in the User Action Framework [2] the selection of UPs was based on their real-world expected frequency. In considering the tradeoffs of these selection schemes, we have developed our own to select a subset of UPs to be examined in the reliability experiment:
The participants aged from 20-50 years and the majority of them were 20-24 years old. Half of the participants had work experience in either software development, in user interface design or in user interface testing. Four of the participants had used earlier versions of the Owl system in their studies at the university for 2-3 years, two for 1-2 years and two of the participants had not used the application before the experiment.
i. Sort all the UPs according to the UT tasks where they occur. ii. For each of these UT tasks first sort UPs according to their frequency, which is an objective parameter and then according to their severity. Two raters should perform this severity rating, to find out inter-rater reliability. One of the raters should have conducted the UT. iii. Select the top half or 50% of the sorted list of UPs per task. iv. Apply the Pre-CUP scheme to these extracted UPs. A rater who has conducted the UT performs the rating.
Experimental Treatment
The experiment (see Figure 1) involved two sessions, which the participants had to attend. A presentation about PreCUP was followed by a session where participants had to classify 21 UPs according to Pre-CUP (3 attributes). The presentation about Pre-CUP covered the following items: explanation of what user tests (UT) are, the goal of Pre-CUP, information about the system where the UPs were identified, explanations about the Pre-CUP attributes and their values, example of a UP that had been classified
284
NordiCHI 2006, 14-18 October 2006
Papers
VQ3. How well do the developers understand the CUP attributes and their values? Do developers propose any changes to the CUP scheme?
according to Pre-CUP and instructions on what participants were supposed to do in the experiment. All participants received the following materials during experimental treatment: a printout of the 27 slides that were used in the training presentation, a 5 pages booklet about Pre-CUP with an example of its application, the tasks that were used in the UT on the system and access to the part of the Owl system which was used in the UT.
The remainder of this section describes the environment in which the study was performed, the data that was collected and how it was analyzed. The results are presented in section Validity Analysis. Environment of Study
Two software developers of Owl were involved in the study. One is the manager of the software development department and the other is the main programmer of the Owl system. They work together on the design of the application and decisions regarding it; one of them does the programming. They both perform testing on the Owl system, which is mostly unit testing and have never used the results of a UT. The programmer of the application has a B.Sc. in computer science and had worked for the company for 15 months when the study began. The department manager has worked for the company for nine years and he is self-educated.
Experimental Task
The information session about Pre-CUP was held by the CUP expert and the UT expert, and the participants joined the second session two or three days later. They were instructed to familiarize themselves with the materials about Pre-CUP so that they would be better at applying it to the UPs. They were also asked to try out the Owl system between the two sessions in order to know the domain better and have an enhanced understanding of the UPs. The participants were instructed to record the time they spent on these activities. The second session of the experiment was conducted in a computer lab so that the participants could examine the system as they were classifying the UPs. The participants received, on paper, 21 UPs where the first five Pre-CUP attributes had been filled out for each UP. The attributes that had been filled out beforehand were: Defect ID, Context, Description, Defect Removal Activity and Trigger. The participants also received a printout and an electronic version of the seven screenshots that the Context attribute referred to. The participants rated three attributes for each UP i.e. Severity, Failure Qualifier and Expected Phase. The participants then entered their result into a provided Excel template where they also recorded the time they spent on preparation for the session and the time they had spent on the CUP classification. All participants filled out a questionnaire about their age, education, previous experience of the system and whether they had software development experience.
Data Collected
The data was mainly collected in the form of semi structured interviews and meetings with the developers of the system over a three month period. All the meetings and interviews were audio taped, transcribed and coded using a qualitative analysis tool called QSR N6 [19]. From the time when the developers received the CUP results from the UT, ten meetings were held with them, a total of 12 hours. Three meetings were spent on discussing particular UPs and their CUP ratings. These meetings provided the developers with a feel for the scheme and opened discussion for what they thought about it. We also examined the documentation available for the Owl system, which was limited because their software development process is mainly agile, and did not involve a great deal of documentation. The most relevant documentation was a list of 177 non-unique items that included comments and error reports from users of the system. The items on the list have been collected through the company’s help line and by running web surveys about the company’s services and applications. To motivate solutions to items/problems, the developer went through this list of items, which includes: suggestions for enhancements, errors, and comments about functionality, usability and performance. Then he categorized all the items according to a potential solution or change in design. Both developers estimated next how long it would take to implement the changes and prioritize them.
At the end of the second session the participants filled out a post-experiment questionnaire based on the Technology Acceptance Model (TAM) [6] which had been adapted to evaluate the CUP scheme to empirically examine the raters’ perceptions of the CUP scheme. Validity Study
The validity study of the CUP scheme was carried out in a real software development environment, with the aim of answering the following three questions intended to answer the third goal in the introduction (3):
RESULTS AND DISCUSSIONS
VQ1: Do developers think that the CUP scheme aids their understanding of a UP?
Reliability analysis RQ1: Reliability of Novice Raters
VQ2. Do developers find the CUP scheme useful when prioritizing what UPs to fix and when deciding how to correct UPs?
To evaluate reliability, Fleiss’ [8] generalized kappa was used as referenced in [15]. The generalized kappa statistic is an extension of the kappa statistic to include multiple
285
NordiCHI 2006, 14-18 October 2006
Papers
raters and it is useful to measure interrater agreement among three or more raters [15]. We used King’s Microsoft Excel spreadsheet to calculate the generalized kappa values [14].
Rater Rater 1 Rater 2 Rater 3 Rater 4 Rater 5 Rater 6 Rater 7 Rater 8 Mean SD
The generalized kappa results are reported in Table 2. The reliability for the Severity attribute is the highest and it is the lowest for the Expected Phase attribute. The reliability results for the Expected Phase attribute suggest that its definition and values require refinement. This was confirmed by the post experiment questionnaire where the participants commented that the values for this attribute needed to be defined more clearly. There are probably too many values defined for this attribute. Another explanation may be that raters do not have adequate background in user interface development to be able to distinguish the difference between the phases, e.g. between navigational and dialogue design.
raters it is poor and for half of the raters it is fair. If we consider the time that the participants spent on preparing themselves for the second session of the experiment then five of them spent less than an hour on preparation, two spent 1-2 hours and one participant spent 2-3 hours. The time that participants spent on the Pre-CUP classification itself in the second session ranged from 60117 minutes and the mean time was 86 minutes (SD=17.01). In comparison, the CUP expert spent 50 minutes on the Pre-CUP classification, which is considerably less than the mean time and can probably be explained by the fact that she knows the CUP scheme well.
RQ2: Interrater Agreement and Influencing Factors
Since the participants were all novices in CUP, we wanted to compare their ratings pairwise to the ratings of a CUP expert. The ratings of every participant were compared to the ratings done by the CUP expert. The CUP expert was as familiar with the UPs as the novice raters and received the same data on the defects. Second, we aimed to see how much knowledge about the UTs themselves helped the rater. Therefore, we compared the ratings of the CUP expert to the UT expert.
All, but one of the raters, have a poor level of agreement with the CUP expert for one of the three attributes. One rater has poor agreement for two attributes and that is rater 5. Rater 5 is also the only rater who has a negative kappa value, and that is for the Expected Phase attribute, which implies that these raters agreed less than would be expected just by chance. Rater 5 spent less than one hour on preparation and spent the least time of all the participants on the Pre-CUP classification i.e. 60 minutes. It is possible that Rater 5 rushed himself too much.
In this part of the reliability evaluation we used Kappa coefficient because it is the recommended statistical method for verifying interrater agreement for nominal scale data classified by two raters like this case [20]. Kappa values can be qualified into five levels of agreement ranging from “poor” to “very good” [1].
The raters who spent more than an hour on preparation were raters 1, 2 and 4. As shown in Table 3 raters 2 and 4 have the highest level of agreement for the Severity attribute and rater 1 has the highest level of agreement for Failure Qualifier. However, these three raters all have a poor agreement for the Expected Phase attribute.
Table 3 shows the kappa results for the comparison between the raters in the Pre-CUP experiment and the CUP expert. The Severity attribute has the highest level of agreement, moderate (0.41-0.61) for three raters but five raters have poor (