Classification of Wood Plates by Neural Networks and Fuzzy Logic Celso A. França*a, Adilson Gonzaga**b a
b
Computing Science Department, University Federal at São Carlos Electrical Engineering Departament, School of Engineering at São Carlos
ABSTRACT The automated visual inspection is an important task for the industrial productivity. It could be applied for quality control or for replacing manual work under dangerous or repetitive activity. The classification stage in quality control of the industrial production is often based on the human knowledge. It seems, therefore, to be a great concern to supply an automated visual inspection system with fuzzy or ambiguous data. The neuro-fuzzy system is a good way to do this. This work contributes with a new approach for the classification of wood plates in pencil production. The method is based on two neural networks, each one working with just an input feature. The results of the neural networks are combined through fuzzy logic giving the system a greater classification power than those that use traditional methods. The system is characterized by being agile, repetitive, with a defined classification pattern and low cost. Keywords: pattern recognition, computer vision, neural networks, fuzzy logic, neuro-fuzzy system, image processing, backpropagation neural network, OR/AND neuron, supervised learning, visual inspection.
1 - INTRODUCTION In order to get the best quality and the smallest cost, industries are investing in the automation of their production line. The quality control of wood plates by Automated Visual Inspection is the most important step towards a completely automated wood processing. Nowadays, this inspection is done by trained people that take into account the visual homogeneity of each plate. Visual homogeneity can be defined as the wood fiber distribution or knots in the surface, and it reflects directly the plate quality1,2. It is often difficult for human operators to consistently classify the plates, because the complex variations of the plate patterns. Moreover, when the human brain does a repetitive task for a long time, it could fail due to tiredness, humor, mental state and physical condition. The majority of papers published in visual inspection of wooden plates deal with defect classification. Szymani and McDonald3 published in 1981 a state-of-the-art that defines and classifies defects in wood plates, and describes various methods for detecting defects in lumber. Conners et al2 describes an Automatic Lumber Processing System (ALPS) that employs computer tomography, optical scanning technology, the calculation of an optimum cutting strategy, and a computer-driven laser cutting device. They use tonal measures combined with texture measures based on the cooccurrence matrices getting 88,3% of correct classification on eight common defect classes. Bustler et al4 used statistical classifiers. They subdivide an image into no-overlapping rectangles. A pixel intensity transformation (RGB) is processed in each one, through an intensity channel defined as (R+G+B)/3 and a color channel defined as (R-B)/2. For each tile, four features are defined: mean and variance of each channel. The histograms are used to compute an index for each tile that quantifies how similar their features are. Tiles with relatively low index values are marked as defectives. They detect streaks in the range of 79,2% to 95%.
a b
E-mail:
[email protected] E-mail:
[email protected]
Koivo and Kim5 extracted features using random field models to classify defects on wood boards. The images of the boards are assumed to be governed by causal autoregressive (CAR) models, and two hierarchical tree classifiers are constructed. Kim and Koivo6 proposed a hierarchical recognition procedure to improve the resolution of the defect detection and to reduce the commutation time needed for the classification. They used a priori knowledge about surface defects as well as texture information to classify sample boards of red oak into one of the nine classes, eight classes of surface defects and a class of clear wood. Zhu et al7 use Computer Tomograph (CT) imagery to locate and identify certain classes of defects in hardwood logs. An adaptive filter smoothes each bi-dimensional CT image. Then, a multi-threshold and bi-dimensional segmentation scheme are applied for separate potential defect areas from clear wood areas. Morphological operations, such as erosion and dilation, are applied in a segmented image slice to eliminate rugged boundaries and spurious areas. After this, a tridimensional image is generated by scene analysis. A set of test is applied on this image. The system limitations are the segmentation process, many thresholds and processing time. Sobey and Semple8 divide the image of the board into non-overlapping rectangles, referred as local area, and used the calculated tonal measures (mean, variance, skewness and kurtosis) to classify each local area separately. The local areas that are identified as containing features are joined, if necessary, with their neighbours to fully define the extension of the features. They detect 95% of the local areas containing defects. Rodrigues9 used an automatic method based on Shannon’s entropy to extract features to classify the quality of wood plates. França et al10 classified the quality of wood plates through a neuro-fuzzy approach based on variables extracted from human knowledge. They used neurons MIN-MAX to do the classification and they got near 61.7% to 96.5% of success. Gonzaga et al11 used features of the histogram of difference (2nd moment, entropy, IDM, sum of dark pixels) and a neuro-fuzzy system to classify the wood quality, getting 75% to 85.71% of success. The aim of this paper is to develop a new approach to improve the classification of wood plates, for the pencil industry. This method is based on two neural networks, each one working with just an input feature. The results of the neural networks are combined through a fuzzy logic giving the system a greater discriminating power than those that use human inspectors.
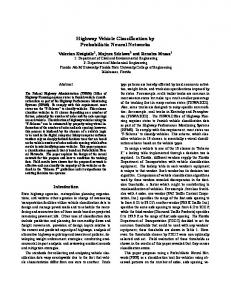
2 – THE WOOD SPECIFICATION The wood is an important raw material because the diversity of its application, such as: structures and parquets, furniture and utensils, firewood for heating, railroad sleepers. The wood plates used in this work are from species Pinus caribaea hondurensis, and the wood is good for this purpose due to the dry climate and the poor ground that prevail in places from where they are cultivated. The transversal cut of a tree presents concentric and alternated rings of clear and dark wood (figure 1). The clearest zone of the growth ring is formed in spring. It has the widest cells and the thinner cellular walls, generating a soft wood of low density and resistance. It is more accessible to the water and to the light, being designated as spring wood (or earlywood)12. The darkest zone is denominated summer wood (or latewood). It has the smallest cells with thicker cellular walls, generating a hard wood of high density and high mechanical resistance12.
Figure 1 - Transversal cut of the tree.
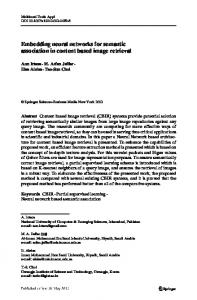
The cut and the study of wood can be made through three main planes13 (figure 2).
Transversal surface - it is exposed when the cut section is perpendicular to the longitudinal axis of the stem. The growth rings in this cut can be easily distinguished. Radial surface - it is exposed when the cut section is longitudinal, going through the center of the log, parallel to the rays and perpendicular the growth rings. Figure 2 - Transversal surface (X), Tangential surface (T) and Radial surface (R).
Tangential surface - it is exposed when the cut section is longitudinal, perpendicular to the wood rays and tangential the growth rings.
2.1 – CLASS DEFINITION The wood plates are classified in five categories, taking into account their visual homogeneity, that is, how the growth rings are arranged in the plate surfaces. In the first class (class A), they don’t have the latewood of the growth rings and there are not stains in their surfaces. So, they have a good visual homogeneity (figure 3). They are the best plates for pencil production. The presence of latewood makes the pencil to warp or to split. Figure 3 - Plate A.
The plates of class B can present few growth rings in their surfaces or small dark areas (figure 4). This class contains the plates between the homogeneous ones (class A) and those ones from radial cut (class C).
Figure 4 - Plate B.
The plates of class C are gotten from radial cut. They have longitudinal stripes that correspond to hard wood due to the growth rings (figure 5). The experts classify in this class, plates that contain five to nine stripes.
Figure 5 - Plate C.
The class D contains plates between those ones obtained from radial cut (class C) and those ones from tangential cut (class S). They have many longitudinal stripes, that is, the number of stripes is bigger than nine. They can present small areas of hard wood (figure 6).
Figure 6 - Plate D.
The plates of class S are obtained by tangential cut of the tree (figure 7). They have areas with different pigments. Pencils manufactured with this class of plate have possibility to split. Therefore, they are the worst class for pencil manufacture.
Figure 7 - Plate S.
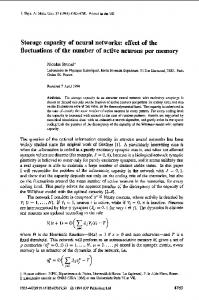
3 – THE CLASSIFICATION METHODOLOGY The proposed system, for quality inspection of the wood plates, is composed of five parts: image acquisition, preprocessing, feature extraction, neural networks and fuzzy logic (figure 8).
Figure 8 - Neuro-fuzzy system for plate inspection.
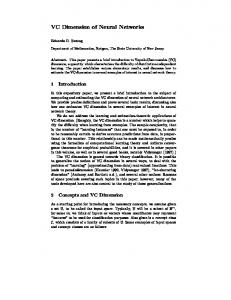
Image acquisition: The plate image is acquired by a CCD camera and digitized by a frame-grabber with 128 x 256 pixels of space resolution and 256 gray levels. Preprocessing: To get a binary image enhancing the features, it’s applied the iterative selection method. This method can be seen in Parker14. Figure 9 shows two images of the same plate: the first one (a) is the acquired image and the other (b) is the preprocessed image.
Figure 9 – (a) Acquired image
and
(b) preprocessed image.
Feature extraction: The plate is subdivided in 16 regions (4 x 4) and from each region are extracted the first and second order statistics. The second order statistics are extracted by the sum and difference histograms proposed by Unser15. Without the binary image the second order statistics have a better performance than the first order, and with the binary image the first order statistics are superior. The first order statistics are: Mean:
µ = Σ i.p(i)
Variance:
σ = Σ (i-µ)2.p(i)
Entropy:
e = Σp(i) .log(p(i))
IDM:
IDM = Σ [p(i)/(1+i2)]
Dark pixels:
np =Σ p(i)
(it indicates the image dispersion) p/p(i)≠0
(it measures the image non uniformity) (it measures the local uniformity)
p / i