growth. But except for tree height growth, scant literature exists on the ... The mediterranean climate is characterized by high temperatures associated with low .... chosen following the same protocols than for architectural studies. .... to 2007) and good years (1995 to 1998) were stable across all analyses, other years being.
Chapter 4
Climate Change Impact on Tree Architectural Development and Leaf Area Michel Vennetier, François Girard, Olivier Taugourdeau, Maxime Cailleret, Yves Caraglio, Sylvie-Annabel Sabatier, Samira Ouarmim, Cody Didier and Ali Thabeet Additional information is available at the end of the chapter http://dx.doi.org/10.5772/51510
1. Introduction 1.1. Context The response of forests to the forecasted increase in climate stress occurrence is considered a key issue in climate change scenarios [1]. Although forest productivity increased in most ecosystems during the 20th century [2,3], a review by Allen et al. [4] underlined an emerging trend of heat and drought induced forest decline and dieback at global scale. Several and generally combined physical and biological causes contribute to observed tree decline or die-off [4-7]. Apart extensive insect outbreaks [8], understanding the respective role of hydraulic failure and carbon starvation due to excessive or long lasting water stress is one of the major research goal in order to predict forest response to climate change [9]. The consequences of climatic events on forest health can be immediate but are often delayed up to 5 to 10 years [5,10], and may be significant for decades and sometimes irreversible on tree growth [11]. Recent studies on tree architectural development and primary growth suggested that the long lasting impact of repeated droughts on tree crown development could be one of the causes of these delayed effects [12-14]. Primary growth corresponds to the creation of new tissues outside existing organs, and includes bole, branch and root length growth, branching (birth of new branches or roots), creation and growth of leaves or needles and rootlets, flowering and fruiting [15,16]. It is therefore fully linked to plant architectural development patterns and processes. In contrast, secondary growth for trees corresponds to the radial growth of existing branches, bole and roots. In single trees and forests, although secondary growth usually exceeds primary growth and leaf production [17], the total amount of biomass allocated to primary growth may be very © 2013 Vennetier et al., licensee InTech. This is an open access chapter distributed under the terms of the Creative Commons Attribution License (http://creativecommons.org/licenses/by/3.0), which permits unrestricted use, distribution, and reproduction in any medium, provided the original work is properly cited.
104 Climate Change – Realities, Impacts Over Ice Cap, Sea Level and Risks
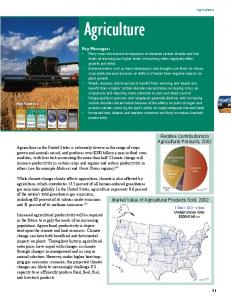
important [18]. As an example, leaf and fruit production measured through litter bags in French adult broadleaved stands (mainly beech and oak) reached 20 to 40% of wood production by stems [19]. The relative allocation to new shoots was not correctly assessed up to now but it can be inferred from leaf production and the leaf mass fraction (LMF), ratio between leaves and whole twig mass. In a recent study, twig wood/leaf biomass ratio was found to reach from 25 to 50% and from 50 to 75% during respectively dry and humid years for Pinus halepensis [20] which means low LMF values (25 to 75%). However, LMF was generally higher on dry sites in south eastern France: 40-70% for Abies alba [21], 70-80% for Quercus ilex [22]. It was found to vary between 80 and 90% for 107 Chinese species at various elevations [23]. As a whole, primary growth may represent between 25 and 70% of secondary growth. But except for tree height growth, scant literature exists on the relationship between tree primary growth processes and climate change or accidents, whatever the species, and plant architecture is commonly neglected in climate change impact studies. The mediterranean climate is characterized by high temperatures associated with low rainfall in summer, drought being the main environmental constraint for vegetation growth [24]. For the 21st century, climatic models forecast that the Mediterranean basin will be prone to a faster warming than most other continental areas over the world, associated with a reduction of rainfall during the growth season [1,25]. Therefore, this area is a good place to detect and model any climate change impact on vegetation, all the more since a rapid decline in precipitation and higher temperatures were already noticeable in parts of this basin [26,27]. In Southeastern France, the period 1998-2007 was characterized by mean annual temperature and mean summer temperature 0.9°C and 1.3°C above the 30-year average (figure 1) Moreover, eight to ten of the twelve hottest years since 1850 were recorded during this time lapse [28] which give a foretaste of the climate forecasted for the next decades. In addition strong climatic events also recently occurred such as the 2003 heat
Figure 1. Average annual precipitations (grey bars) and temperatures (black line) in Font-Blanche since 1995. Horizontal lines are 1961–2010 average, grey line = mean rainfall, dotted black line = mean temperature.
Climate Change Impact on Tree Architectural Development and Leaf Area 105
wave which significantly impacted French Mediterranean forests as well as most of Europe [29]. Such extreme climatic events are likely to become frequent with global warming [1,30]. Scorching heat had direct and delayed negative effects on tree growth, especially on pine species [31]. The resulting increase in summer and spring water stress may reduce tree growth in Mediterranean areas [32-35]. Raising temperature may also lead to phenological lags [36], particularly in the beginning and end of the growth season, with direct consequences on some primary growth processes and architectural development such as polycyclisme and branching rates [37,38].
1.2. Goals This study aimed at quantifying the influence of recent climatic trend and events, particularly intense heat and drought, on the primary growth and architectural development of six conifers and one broadleaved species growing in Mediterranean plains (Pinus halepensis, P. pinea, P. pinaster, Quercus ilex) and mountains (P. nigra, P .silvestris, Abies alba). The three last ones are at the lower limit of their distribution area in southern France. One of the final goals was to model the direct and delayed effects of climatic accidents on tree leaf area in order to help assessing the resulting risk in terms of decline and die-back.
2. Material and methods 2.1. Study area and species The study area included 8 sites distributed between 80 and 1400 m of elevation, from the coast to hinterland mountains of Provence-Alpes-Côte d'Azur region in south-eastern France (figure 2).
Figure 2. Study area and studied sites.
106 Climate Change – Realities, Impacts Over Ice Cap, Sea Level and Risks
Nearly 5150 twigs from 1050 branches of 210 trees and 7 species were sampled between 2005 and 2011 (Table 1). Their architectural development was retrospectively measured from morphological markers (figure 3) over a period of 15 to 25 years. For each tree, the sampling design considered separately three thirds of the crown (top, middle and base), branch orientation (north and south), but also branch hierarchy (principal or secondary axis – figure 4) and branch vigor. Secondary axes were chosen according to their relative vigor (strong vs weak axes) within the branch they belong to (figure 4). Twig absolute vigor for each species was later split in three groups of equal number (vigorous, medium, frail) according to their total length growth in the last three years before sampling date. Site name Saint Mitre Font-Blanche Siou Blanc Sainte Baume Sainte Victoire 1 Sainte Victoire 2 Trigance Courchons Ventoux
Species (number of trees) PH (11) QI (6) PH (58) QI (34) PH (11) QI (6) PS (5+5+5), PM (5) PS (5); PN (5) PM (5); PP (5) PS (5) PS (5) PS (5), PN (10), AA (19)
Altitude (m) 80 420 650 950 650 500 1000 1350 1100 to 1400m
exposition Flat Flat Flat North North Flat Flat North-east North
Dates of mesures 2008-2009 2005-2011 2008-2009 2005-2006 2009-2010 2010 2005-2006 2005-2006 2009-2010
PH = Pinus halepensis Mill, PS = Pinus sylvestris L., PM = Pinus pinaster Aiton, PN = Pinus nigra ssp nigra Arn, PP = Pinus pinea L., AA = Abies alba Mill
Table 1. Study sites
2.2. Growth and architectural parameters When present, 5 to 10 needles were randomly chosen from the base to the end of each twig and all around it to measure their length and width. Needle number per twig was counted on a subsample of twigs (1/3) with consideration of missing needles which were counted using their scars on the twig. As needles are lined up in three to five lines or spirals along the shoot, counting needles along one or two of these lines or spirals and then bulking up the count proved to be a very reliable assessment (error < 5%) In order to bridge primary and secondary growth, ring width was measured for all studied trees. Two cores per tree were collected perpendicularly at 1.3 m height. Ring widths of each core were measured using a micrometer (±0.002 mm, Velmex Inc., Bloomfield, NY). Some trees were also logged for stem analysis and rings were counted along 4 perpendicular directions. Ring width series were firstly cross-dated and standardized with the classical methods of dendroecology, to remove age-related tendencies from the growth curve and to obtain a homogenised variance. Then elementary raw and detrended series were respectively averaged for each tree and master chronologies were constructed for each species and for each plot by averaging tree series. For Pinus halepensis and Quercus ilex, a follow-up of phenology and architectural development was performed twice a month from 2008 to 2011 on one site (Font-Blanche) to
Climate Change Impact on Tree Architectural Development and Leaf Area 107
understand their relationship with climate and their interrelations. Branches and twigs were chosen following the same protocols than for architectural studies.
Figure 3. Morphological markers used for twig growth reconstruction in conifers. All growth units start by sterile scales, small and clustered on the first one, larger and spaced out on the following ones in case of polycyclisme (mainly Pinus halepensis and P. pinaster). Male flowering (left): male flowers appear at the base of the first annual growth unit over sterile scales for pines. The scars they left on the twig are generally different from needle scars. Female flowering (right): cones (with very few exceptions) appear at the top of the first annual growth unit. For pines, cones or their peduncles remain a long time on the branch or leave a specific scar. The presence of at least one branch or of a whorl indicates the limit of a growth unit for pines, but some growth units may be branchless. For firs and oaks, intermediate branches may appear, during all the branch life. A given pine twig never bears male and female flowers the same year. For Quercus ilex, a pseudo-whorl of branches indicates the limit between two annual shoots. The retrospective analysis of branch growth is far more difficult than for conifers.
2.3. Branch modeling The observed variations of architectural parameters, needle number and needle size were integrated into a 2D-model of pine branch architectural development to simulate the impact of climate on pine total leaf area (figure 5c). We designed the model for the more complex of studied conifers: Aleppo pine (Pinus halepensis). Aleppo pine gives potentially the higher number of growth units per year, so that the model can easily be simplified for other species. In a first attempt we considered medium vigor branches located in the middle part of the crown as representative of the average branch of a tree. Parameters for each twig category (principal and secondary axes, vigor, medium and frail axes) were implemented according to scenarios of successive years considered as "normal" or "bad" (defined afterwards; figure 5 a -b, table 2). As pine architectural development for a given year is partly
108 Climate Change – Realities, Impacts Over Ice Cap, Sea Level and Risks
to fully pre-determined by the climate of the previous year, the impact of bad years on polycyclism and the number of needles are delayed compared to the impact on leaf size.
Figure 4. Twig sampling. Five axes are measured on each branch: the principal axis and two pairs of secondary axes one weak and one strong by pair five years-old and 10 years-old. The classes "weak" and "strong" are relative to each other in the concerned pair and their absolute vigour depends on branch vigour.
a
c
b
Figure 5. Example of the development of a medium vigor secondary axis of Pinus halepensis without (a) or with (b) 1 to 3 bad years. Example of a middle crown / medium vigor branch (principal and secondary axes) and development after 7 years with 4 successive bad years. The model includes strong and weak secondary axes and 3 classes of twig vigor. Color changes each year along each axis: blue and green for good years, orange and red for bad years.
At each step of branch development and at the end of each year, active twigs (with needles) could be counted and sorted by vigor. The number and size of needles per active twig was set according to table 2. Total needle surface (length*width*needle number) was calculated for each twig and bulked up for the whole branch.
Climate Change Impact on Tree Architectural Development and Leaf Area 109
This model was used to simulate branch growth for 10 years, as all parameters for secondary axes were obtained for this time span. For longer periods, the interaction and competition with neighboring branches, twig self pruning, branch aging and accidents may significantly change these parameters, so that a 3D model taking these interactions into account is necessary. For Abies alba, some specific sampling and analyses were made to compare trunk, lateral axes and ring width responses to climate. Trees were sampled at 3 different elevations (1150, 1250 and 1350m) [26]. For 14 trees, annual shoot length was measured on the trunk. Laterals axis sampling and measurements followed the same protocol as other species.
2.4. Statistical analyses As most architectural and growth parameters slowly evolve with branch aging, it was necessary to remove this natural trend. This was systematically done for each parameter using the difference measured at equal cambial age for branches of respectively top vs middle and middle vs base of the crown, for the period 1995-2000 considered as accidentfree (figure 8, method in references [12,37]). To quantify inter-annual variability between traits, an individual detrended coefficient of variation (dCV), for the period 1990-2010, was computed, for each trait of each tree, as follow: (i) individual trend was removed by taking the residuals of the linear or non-linear model with time as explanatory variable and (ii) the standard deviation of the detrended sequence was divided by the raw sequence mean (i.e. the mean trait value for each tree). Thus, the detrended coefficient of variation of trait j for tree i can be written:
dCV j,i =
SD X j,i β0 j,i β1j,i * Time X j,i
with X
j,i
the sequence of trait j values for tree i ; β0j,i and
β1j,i the corresponding estimates of the model used for detrending and mean (Xj,i) the mean value of the trait j for tree i. For a global assessment of the relationship between growth, architectural parameters and climate, a Principal Component Analysis (PCA) was performed considering years as observations and all detrended architectural and growth parameters as variables, species by species. PCA was also used to help sorting good years (favorable climate for tree growth) and bad years (figure 7). As some parameters were not common to all species (polycyclism, male flowering, needle number), each PCA was performed with and without these variables to check the stability of years and variables in PCA planes. Needle length was not always available for the same period than other factors. Thus each PCA was also performed with needle length for available years and without needle length on the whole studied period (1995-2010). All growth and architectural variables were averaged per species for bad and normal years. Bad years were defined as the four worst years in the 2003-2008 period for each individual
110 Climate Change – Realities, Impacts Over Ice Cap, Sea Level and Risks
variable. All other years were merged to compute the data for "normal years": as exceptionally low values due to repeated severe drought were excluded, we considered other data as normally good, mean or bad, representative of the normal interannual variability. Partial least square (PLS) regressions were used to investigate relationships between architectural or growth parameters and climate. This method was chosen because it handles many variables with relatively few observations [39] and deals with correlated variables [40]. The number of significant PLS components was chosen by a permutation test [41] with a 5% threshold for the explained variance. Variables were tested with a 1000-step crossvalidation [42]: they were retained only when the confidence interval (p