Bian et al. World Journal of Surgical Oncology (2015) 13:128 DOI 10.1186/s12957-015-0502-0
WORLD JOURNAL OF SURGICAL ONCOLOGY
RESEARCH
Open Access
Clinical outcome and expression of mutant P53, P16, and Smad4 in lung adenocarcinoma: a prospective study Chunan Bian1,3†, Zhongyou Li2†, Youtao Xu1, Jie Wang2, Lin Xu1* and Hongbing Shen4*
Abstract Background: Whole-exome sequencing has shown that lung adenocarcinoma (LAC) can be driven by mutant genes, including TP53, P16, and Smad4. The aim of this study was to clarify protein alterations of P53, P16, and Smad4 and to explore their correlations between the protein alterations and clinical outcome. Methods: We investigated associations among P53 mutant (P53Mut) expression, and P16 and Smad4 loss-of-expression, with clinical outcome in 120 LAC patients who underwent curative resection, using immunohistochemical (IHC) methods. Results: Of the 120 patients, 76 (63.3%) expressed P53Mut protein, whereas 54 (45.0%) loss of P16 expressed and 75 (62.5%) loss of Smad4 expressed. P53Mut expression was associated with tumor size (P = 0.041) and pathological stage (P = 0.025). Loss of P16 expression was associated with lymph node metastasis (P = 0.001) and pathological stage (P < 0.001). Loss of Smad4 expression was associated with tumor size (P = 0.033), lymph node metastasis (P = 0.014), pathological stage (P = 0.017), and tumor differentiation (P = 0.022). Kaplan-Meier survival analysis showed that tumor size (P = 0.031), lymph node metastasis (P < 0.001), pathological stage (P < 0.001), P53Mut protein expression (P = 0.038), and loss of p16 or Smad4 expression (P < 0.001) were significantly associated with shorter overall survival(OS), whereas multivariate analysis indicated that lymph node metastasis (P = 0.014) and loss of p16 or Smad4 expression (P < 0.001) were independent prognostic factors. Analysis of protein combinations showed patients with more alterations had poorer survival (P < 0.001). Spearman correlation analysis showed that loss of Smad4 expression inversely correlated with expression of P53Mut (r = −0.196, P = 0.032) and positively with lost P16 expression (r =0.182, P = 0.047). Conclusions: The findings indicate that IHC status of P53Mut, P16, and Smad4 may predict patient outcomes in LAC. Keywords: Lung adenocarcinoma, Mutant P53, P16, Smad4, Immunohistochemistry, Prognosis
Background Lung cancer is the leading cause of cancer death worldwide [1], and the proportion of lung cancer patients with lung adenocarcinoma (LAC) is reportedly increasing [2]. Survival rates for LAC have improved dramatically in the last decade, owing to identification of driver mutations in LAC [3]. For example, EGFR tyrosine kinase inhibitor have been approved for treatment of LACs that carry EGFR gene mutations, which has greatly improved the prognosis of such patients [4,5]. Discovery of genetic * Correspondence:
[email protected];
[email protected] † Equal contributors 1 Department of Thoracic Surgery, Nanjing Medical University-Affiliated Cancer Hospital, Nanjing 210009, China 4 The Public Health College of Nanjing Medical University, Nanjing 210029, China Full list of author information is available at the end of the article
biomarkers for cancers is expected to rapidly expand [6]. Identified driver gene alteration for LAC currently includes mutations of EGFR, KRAS, PIK3CA, BRAF, STK11, DDR2, TP53, Smad4, P16, RET, and ALK, among others [7-11]. As driver genes are found, their relationships to each other and to patients’ prognoses must be verified. Genetic alterations of P53, P16, and Smad4 have been found in pancreatic cancer, and appear to be strongly associated with its malignant behavior [12-14]. In our previous study with a genetically engineered mouse model, we found P53Mut’s potentially malignant gain-of-function was promoted by inactivating the inhibitory actions of transforming growth factor β (TGF-β), caused by downregulation of smad4, which in turn was synergistically caused by P53Mut and deficient P16/P19. Although these
© 2015 Bian et al.; licensee BioMed Central. This is an Open Access article distributed under the terms of the Creative Commons Attribution License (http://creativecommons.org/licenses/by/4.0), which permits unrestricted use, distribution, and reproduction in any medium, provided the original work is properly credited. The Creative Commons Public Domain Dedication waiver (http://creativecommons.org/publicdomain/zero/1.0/) applies to the data made available in this article, unless otherwise stated.
Bian et al. World Journal of Surgical Oncology (2015) 13:128
three genes have been studied individually in LAC, little is known about how they interact, or their combined effect on prognosis. Here, we investigated mutant P53, P16, and Smad4 in LAC by immunohistochemical (IHC) staining and correlated these mutations with clinicopathological features and patients’ OS.
Methods Patients and tissue samples
This study included 120 patients with LAC who underwent surgical resection between January 2007 and March 2009 at the Nanjing Medical University-Affiliated Cancer Hospital, Nanjing, China. All patients had complete medical records and complete follow-up data. The last followup date was March 2014. Patients who died of causes other than LAC before this date were excluded. Their clinicopathological data were collected from medical records and follow-up data were obtained through telephone interviews or by consulting the police population information system. These patients’ mean age was 59.4 years (range: 35 to 85 years), including 58 men and 62 women. Before their surgeries, all patients underwent CT scans or B-ultrasonic examinations to exclude locoregional or widespread metastases. All patients underwent radical resections; no patients received radiotherapy or chemotherapy before surgery. This study was approved by the Ethics Committee of Nanjing Medical University. IHC analyses
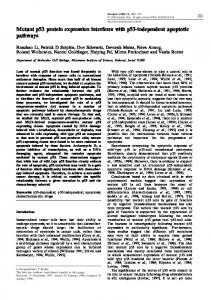
Specimens of primary LAC from 120 patients were cut into 5-μm tissue sections and deparaffinized by routine methods. The slides were steamed for 20 min in sodium citrate buffer. After cooling for 5 min, the slides were IHC stained for P53Mut, P16 and Smad4. At least five different distinct regions of the primary tumor were IHC-labeled for each case to evaluate for potential heterogeneity. IHC labeling was carried out using P53Mut mouse monoclonal antibody (clone SC126 diluted 1:100, Santa Cruz Biotechnology, Dallas, USA), CDKN2A/P16 rabbit monoclonal antibody (clone SC468 diluted 1:100, Santa Cruz Biotechnology), and Smad4/Dpc4 mouse monoclonal antibody (clone SC-7966, diluted 1:100, Santa Cruz Biotechnology) as reported [15]. Labeling was detected by adding biotinylated secondary antibodies. Positive controls were taken from sections known to be positive from pancreatic carcinoma specimens. For the negative controls, 1% PBS was used in place of primary antibodies. Results were evaluated independently by two experienced pathologists. P53Mut was considered positive when ≥10% of tumor cell nuclei showed strong staining with a dark brown color. P16 and Smad4 were considered positive when ≥ 20% of tumor cell cytoplasm and nuclei showed staining with a brown color (Figure 1).
Page 2 of 8
Statistical analysis
Statistical analysis of group differences was performed using χ2 tests. The 1-, 3-, and 5-year survival rates were estimated using life tables; OS was estimated using the Kaplan-Meier method, and the differences were assessed by the log-rank test. Cox proportional hazards models were generated for multivariate analysis. Correlation analysis used the Spearman test. P < 0.05 was considered statistically significant. Statistical analyses were performed using SPSS software (version 17.0, SPSS).
Results Clinicopathological features and outcome
Of the 120 patients (58 men and 62 women), 47 (39.2%) were older than 60 years at the time of surgery; their mean and median ages were 59.4 and 58 years, respectively. At the last follow-up date (March 2014), 25 (20.8%) patients were still alive. Median OS was 35.14 months, with 1-, 3-, and 5-year survival rates of 61.0%, 39.0%, and 33.0%, respectively. In all 120 patients, 24 (20.0%) had T1 tumors, 73 (60.8%) had T2 tumors, and 23 (19.2%) had T3/4 tumors. Lymph node metastases were present in 49/120 (40.8%). We found 26.7% of tumors were well differentiated, 34.1% were moderately differentiated, and 39.2% were poorly differentiated. Only 13 (10.8%) patients had pleural invasion. Of the 120 patients, 37 (30.8%), 47 (39.2%), 36 (30.0%), and 0 (0%) presented with the Union for International Cancer Control stage I, II, III and IV disease, respectively (Table 1). Protein alterations in LAC
Using IHC labeling, we detected positive P53Mut in 76 patients (63.3%), negative P16 in 54 patients (45.0%), negative Smad4 in 75 patients (62.5%) (Table 1), alterations of all three proteins (P53mut+/P16-/Smad4-) in 28 (23.3%) patients, and normal expression of the three proteins (P53mut-/P16+/Smad4+) in 17 (14.2%) patients (Table 2). Protein alterations and clinicopathological features
Positive IHC labeling of P53Mut was significantly linked to tumor size (P = 0.041) and pathological stage (P = 0.025). Negative P16 IHC labeling was significantly associated with lymphatic metastasis (P = 0.001) and pathological stage (P < 0.001). Negative Smad4 IHC labeling was associated with tumor size (P = 0.033), lymph node metastasis (P = 0.014), differentiation (P = 0.022), and pathological stage (P = 0.017) (Table 1). Clinicopathological features and OS
Univariate analysis results were based on log-rank tests of clinicopathological characteristics in relation to OS. Tumor size (P = 0.031), lymph node metastasis (P < 0.001), and pathological stage (P < 0.001) were significantly associated with shorter OS (Table 2).
Bian et al. World Journal of Surgical Oncology (2015) 13:128
Page 3 of 8
Figure 1 P53Mut, P16, and Smad4 expression in lung adenocarcinoma, shown immunohistochemically (SP × 200). (A) P53Mut positive staining detected in nucleus. (B) P16 positive staining detected in cytoplasm and nucleus. (C) Smad4 positive staining detected in cytoplasm and nucleus.
Protein alterations and OS
Loss of P16 and Smad4 IHC labeling was associated with a significantly shorter OS (P < 0.001). There were significant differences in positive labeling of P53Mut with regard to OS (P = 0.038). Next, based on the number of altered proteins, we classified the patients into eight groups: P53mut−/P16+/Smad4− (n = 11); P53mut−/P16+/Smad4+ (n = 17); P53mut−/P16−/Smad4+ (n = 5); P53mut−/P16− /Smad4− (n = 11); P53mut+/P16+/Smad4− (n = 25); P53mut+/P16+/Smad4+ (n = 13); P53mut+/P16−/Smad4+ (n = 10); and P53mut+/P16−/Smad4− (n = 28). Kaplan-
Meier survival analysis showed that the P53mut−/ P16+/Smad4+ group had the longest OS and the P53 mut+/P16−/Smad4- group had the shortest OS (P < 0.001). The higher number of altered proteins robustly reflected major differences in survival outcome. The results showed patients with more protein alterations had poorer survival rates (Table 2, Figure 2). Multivariate analyses of factors affecting OS
Multivariate models using Cox proportional hazards analysis were conducted with the parameters that were
Table 1 Mutant P53, P16, and Smad4 expression in relation to clinicopathological parameters (n = 120) Mutant P53 expression
P
P16 expression Negative (%)
Positive (%)
0.766
34 (46.6%)
39 (53.4%)
20 (42.6%)
27 (57.4%)
27 (46.6%)
31 (53.4%)
27 (43.5%)
35 (56.5%)
8 (33.3%)
16 (66.7%)
Negative (%)
Positive (%)
Age ≤60 year
26 (35.6%)
47 (64.4%)
Age >60 year
18 (38.3%)
29 (61.7%)
Male
25 (43.1%)
33 (56.9%)
Female
19 (30.6%)
43 (69.4%)
T1 (≤3)
14 (58.3%)
10 (41.7%)
T2 (>3 ≤ 7)
24 (32.9%)
49 (67.1%)
34 (46.6%)
T3/4 (>7)
6 (26.1%)
17 (73.9%)
12 (52.2%)
Negative
27 (38.0%)
44 (62.0%)
23 (32.4%)
48 (67.6%)
Positive
17 (34.7%)
32 (65.3%)
31 (63.3%)
18 (36.7%)
0.157
P
Smad4 expression Negative (%)
Positive (%)
0.666
47 (64.4%)
26 (35.6%)
28 (59.6%)
19 (40.4%)
0.741
32 (55.2%)
26 (44.8%)
43 (69.4%)
19 (30.6%)
11 (45.8%)
13 (54.2%)
39 (53.4%)
45 (61.6%)
28 (38.4%)
11 (47.8%)
19 (82.6%)
4 (17.4%)
38 (53.5%)
33 (46.5%)
37 (75.5%)
12 (24.5%)
P 0.595
0.109
Tumor size (cm) 0.041
0.392
0.033
Lymph nodes 0.709
0.001
0.014
Differentiation Well
16 (50.0%)
16 (50.0%)
13 (40.6%)
19 (59.4%)
15 (46.9%)
17 (53.1%)
Moderate
13 (31.7%)
28 (68.3%)
0.188
14 (34.1%)
27 (65.9%)
0.077
24 (58.5%)
17 (41.5%)
Poor
15 (31.9%)
32 (68.1%)
27 (57.4%)
20 (42.6%)
36 (76.6%)
11 (23.4%)
Negative
39 (36.4%)
68 (63.6%)
47 (43.9%)
60 (56.1%)
66 (61.7%)
41 (38.3%)
Positive
5 (38.5%)
8 (61.5%)
7 (53.8%)
6 (46.2%)
9 (69.2%)
4 (30.8%)
Stage I
20 (54.1%)
17 (45.9%)
11 (29.7%)
26 (70.3%)
18 (48.6%)
19 (51.4%)
Stage II
15 (31.9%)
32 (68.1%)
17 (36.2%)
30 (63.8%)
28 (59.6%)
19 (40.4%)
Stage III
9 (25.0%)
27 (75.0%)
26 (72.2%)
10 (27.8%)
29 (80.6%)
7 (19.4%)
0.022
Pleural invasion 0.887
0.497
0.596
Pathological stage
The italicized values indicate P values less than 0.05.
0.025
60
47
40.396
32.890 to 47.902
30.000
17.931 to 42.069
M
58
41.563
34.672 to 48.454
36.000
18.585 to 53.415
F
62
40.535
33.685 to 47.385
30.000
17.461 to 42.539
Age (year)
Sex 0.917
Tumor size (cm) T1 (≤3)
24
49.125
40.950 to 57.300
45.000
31.797 to 58.203
T2 (3 to 7)
73
41.959
35.673 to 48.245
35.000
17.325 to 52.675
T3/4 (>7)
23
28.587
17.986 to 39.188
15.000
10.340 to 19.660
0.031
Lymph nodes Negative
71
50.437
44.488 to 56.387
49.000
39.870 to 58.130
Positive
49
27.497
20.990 to 34.003
17.000
13.571 to 20.429
32
48.869
40.548 to 57.190
49.000
33.785 to 64.215