Hindawi Wireless Communications and Mobile Computing Volume 2018, Article ID 9576978, 15 pages https://doi.org/10.1155/2018/9576978
Research Article Cluster-Based Arithmetic Coding for Data Provenance Compression in Wireless Sensor Networks Qinbao Xu, Rizwan Akhtar, Xing Zhang, and Changda Wang School of Computer Science and Communication Engineering, Jiangsu University, Zhenjiang, China Correspondence should be addressed to Changda Wang;
[email protected] Received 8 March 2018; Revised 25 May 2018; Accepted 5 June 2018; Published 27 June 2018 Academic Editor: Kim-Kwang Raymond Choo Copyright © 2018 Qinbao Xu et al. This is an open access article distributed under the Creative Commons Attribution License, which permits unrestricted use, distribution, and reproduction in any medium, provided the original work is properly cited. In wireless sensor networks (WSNs), data provenance records the data source and the forwarding and the aggregating information of a packet on its way to the base station (BS). To conserve the energy and wireless communication bandwidth, the provenances are compressed at each node along the packet path. To perform the provenances compression in resource-tightened WSNs, we present a cluster-based arithmetic coding method which not only has a higher compression rate but also can encode and decode the provenance in an incremental manner; i.e., the provenance can be zoomed in and out like Google Maps. Such a decoding method raises the efficiencies of the provenance decoding and the data trust assessment. Furthermore, the relationship between the clustering size and the provenance size is formally analyzed, and then the optimal clustering size is derived as a mathematical function of the WSN’s size. Both the simulation and the test-bed experimental results show that our scheme outperforms the known arithmetic coding based provenance compression schemes with respect to the average provenance size, the energy consumption, and the communication bandwidth consumption.
1. Introduction Wireless sensor networks (WSNs) are composed of a large number of low-cost, low-power, and randomly distributed wireless sensor nodes (nodes, for short), which are intended to monitor physical or environmental data from the detecting areas and cooperatively pass the data to the base station (BS) or a desired actuator through wireless communication. They are widely deployed in a vast number of different application areas, such as health monitoring, meteorology, and military operations. Because of the diversity of the environment and the large number of sensor types involved, in order to use the reliable information to make an accurate decision, it is essential to evaluate the trustworthiness of the received data at the base station (BS) of a WSN. In practice, there are some examples of significant losses because the faulty data are used [1]. In a multihop WSN, provenance of each data packet presents the history of the data acquisition and the actions performed on the data while the data are transmitted to the BS. Provenance provides the knowledge about how the data come to be in its current state, including where the
data originated, how it was generated, and the operations it has undergone since its generation. Therefore, provenance plays an important role in assessing the data’s trustworthiness [2, 3]. With the increase in packet transmission hops, the provenance’s size expands rapidly and sometimes the size even largely exceeds the size of the data packet itself. WSNs are a kind of resource constrained network. Because of storage and computational resource constraints, sensor nodes deployed in WSN do not have the ability to manipulate the provenance if its size is very large. Generally, sensor nodes utilize batteries to supply power, so the amount of energy is limited. Data transmission is the major part of the energy consumption. When the sensing data item is fixed, the packet size mainly depends on the provenance. Besides, the transmission channels do not have sufficient capacity for transmitting large provenance. As a result, in large-scale WSNs, the provenances generally cannot be directly and completely transmitted due to both the bandwidth and the energy constraints on wireless sensor nodes. For the same reason, the provenance encoding schemes for wired computer networks, e.g., the works of [4– 6], are not applicable for WSNs. Hence, several lightweight
2
Wireless Communications and Mobile Computing
or compact data provenance schemes [7–9] as well as the compression schemes [1, 10, 11] have been proposed. The lightweight schemes drop some information with less significance in the provenance, e.g., the provenance graph’s topology, and then shorten the provenances size. The compression schemes decrease the provenances size through arithmetic coding [12], LZ77 [13], and LZ78 [14]. Note that for a given packet path, the provenance compression has a determined entropy upper bond according to Shannon’s theory. Even the dictionary-based scheme [10] can achieve the highest provenance compression rate up to date, in a large-scale network the provenance overload problem is inevitable. To mitigate the average provenance size increases as well as utilize the provenance data efficiently, we propose a CBP (cluster-based provenance) encoding scheme for WSNs. The CBP scheme focuses on encoding and decoding the provenance incrementally (like Google Maps, can be zoomed in and out according to the user’s requirement) at the BS. The specific contributions of the paper are as follows: (i) We proposed a cluster-based lossless provenance arithmetic encoding scheme (CBP) for WSNs. Our approach not only has the ability of encoding and decoding the provenance incrementally, but also achieves a higher average provenance compression rate. (ii) We derived the optimal cluster size for the CBP scheme as a mathematical function of the number of the nodes in a WSN. (iii) We provided a detailed performance analysis, simulation, and experimental evaluations of our CBP scheme and a comparison with other related schemes. The rest of the paper is organized as follows: Section 2 surveys the related works. Section 3 introduces the system model and the related background. Section 4 gives an overview of our method. Section 5 describes our proposed encoding and decoding approaches for simple and aggregated provenances, respectively. The cases study is presented in Section 6. Section 7 theoretically analyzes the performances of our method. Sections 8 and 9 show the simulation and experimental results, respectively. Section 10 concludes the paper.
2. Related Work Shebaro et al. [9] proposed an in-packet Bloom filter (BF, for short) based lightweight secure provenance scheme, in which every node on packet’s path is embedded into an array with fixed size through a set of hash functions. A BF is a simple but space efficient randomized data structure which supports fast membership queries with false positive, where the false positive rate depends on the array’s size. Alam et al. [7] proposed an energy-efficient provenance encoding scheme based on the probabilistic incorporation of the nodes’ IDs into the provenance, in which the entire provenance is scattered into a series of packets that are transmitted along the same route. Therefore, all the sections carried by the packets have to be retrieved correctly at the BS and then the provenance can be decoded. The major advantage of such a
method is that it successfully limits the size of the provenance attached to a single packet, whereas the drawback is that it has a higher decoding error rate compared to the methods that encode the entire provenance into a single packet. The above methods are all lossy provenance encoding schemes because the topology information of the WSN is not included. Hussain et al. [1] proposed an arithmetic coding based provenance scheme (ACP). The ACP scheme assigns a global cumulative probability for each node according to its occurrence probability in the used packet paths. For a given packet path in a WSN, the ACP scheme utilizes the global cumulative probability of the source node as the initial coding interval, and then the cumulative probabilities acquired from the associated probabilities derived from each connected nodes pair are used to generate the provenance; i.e., all the nodes IDs along the path are sequentially encoded into a half-open interval through arithmetic coding. Unlike most of the known provenance schemes whose average provenance size is directly in proportion to the increases in the packet transmission hops, the ACP scheme’s provenance size is decided by the packet path’s occurrence probability in a WSN. Wang et al. [10] proposed a dictionary-based provenance encoding scheme (DP). The DP scheme treats every packet path as a string of symbols consisting of the node IDs along the packet path. Just like building a dictionary for symbol strings in LZ compression [13, 14], the DP scheme builds the dictionary for packet paths with the used packet paths at every node and the BS holds a copy of each node’s dictionary. Therefore, the provenance can be encoded through an index or a series of indices of the packet paths at each node along the packet path and be decoded by looking up the dictionaries at the BS. When the topology of the WSN is relatively stable, the provenance size under the DP scheme can be even shorter than the provenance’s entropy; on the contrary, the provenance compression rate increases drastically with the quick change of the WSN’s topology. Wang et al. [11] proposed a dynamic Bayesian network based provenance scheme (DBNP) for WSNs. The DBNP scheme encodes edges instead of node IDs along the packet path into the provenance by overlapped arithmetic coding. Compared to the known lossless provenance schemes, a higher provenance compression rate can be achieved by the DBNP scheme. Furthermore, such a scheme is not sensitive to the WSN’s topology changes. However, applying the overlapped arithmetic coding leads to decoding false positives [15], where extra knowledge is added to eliminate the false positives. Therefore, it is difficult to make a tradeoff between the acceptable false positive rate and the optimum compression rate. All the approaches mentioned above focus on how to mitigate the provenances size rapid expansion in WSNs. However, none of these approaches supports the provenance incremental encoding and decoding, which can raise both the efficiencies of the provenances decoding and the data trust assessment.
3. Background and System Model In this section, we provide a brief primer on arithmetic coding. We also introduce the system model applied in this
Wireless Communications and Mobile Computing
3
BS
BS
(a)
(b)
Figure 1: The two data collection modes in cluster-based WSNs. BS
BS
n1 n1
n2 n3
n2 n5
n3 (a)
n4 n6
n7
(b)
Figure 2: (a) Simple provenance. (b) Aggregated provenance.
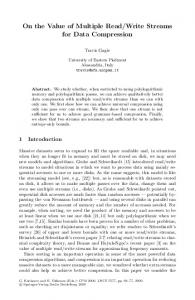
paper. Some of these definitions are partly from our previous work [1, 10, 11]. 3.1. Clustering Model. In WSNs, clustering management refers to selecting a series of nodes as cluster-heads according to a certain communication protocol, e.g., EEHC (EnergyEfficient Hierarchical Clustering) [16]. A cluster-head aggregates the data generated by the nodes in its cluster and then sends such data to the BS. Figure 1 shows the two data collection modes in clusterbased WSNs, where the solid circles and the empty circles denote the member nodes of a cluster and the cluster-heads, respectively. Figure 1(a) shows an example of the singlehop communication between the cluster-heads and the BS, which is applied for small-scale WSNs; Figure 1(b) shows an example of multihop communication among the clusterheads and the BS, which is applied for large-scale WSNs because some cluster-heads cannot reach the BS in one hop. 3.2. Provenance Model. In WSNs, the provenance of a data packet refers to where the data packet is generated and how it is transmitted to the BS [1, 2, 8]. In our provenance model, a data source is a node generating data periodically through the sensors attached to the node; a forwarder is a node that relays the packet toward the BS along the packet path; an aggregator is a node that aggregates two or more received data packets from its upstream nodes as a new one and then sends the new packet toward the BS. The aggregator nodes in our scheme are not selected. While being transmitted toward
the BS, only the packets that fulfill the aggregation conditions are aggregated [17]. Note that such a process results in the provenances aggregation accordingly. Each packet contains the following: (i) a unique packet’s sequence number; (ii) a cluster-head sequence number; (iii) data source node ID; (iv) data value; (v) provenance; and (vi) a message authentication code (MAC), which binds the provenance and its data together to prevent any unauthorized modification. There are two different kinds of provenance in WSNs. Figure 2(a) presents a simple provenance, where data is generated at leaf node 𝑛3 and forwarded by nodes 𝑛2 and 𝑛1 toward the BS; Figure 2(b) shows an aggregated provenance, where data are aggregated at nodes 𝑛4 and 𝑛2 on the way to the BS. The aggregated provenance can be presented as a tree through a recursive expression ⟨((𝑎)(𝑏)), 𝑐⟩, where c denotes the root and (𝑎) and (𝑏) denote the left and the right subtrees, respectively. Therefore, the aggregated provenance in Figure 2(b) has the form ⟨((((𝑛5 ) , 𝑛3 )) (((𝑛6 ) (𝑛7 ) , 𝑛4 )) , 𝑛2 ) , 𝑛1 ⟩ .
(1)
Without loss of generality, the formal definition of data provenance in a WSN is as follows [11]. Definition 1 (provenance). For a given data packet 𝑑, the provenance 𝑝𝑑 is a directed acyclic graph 𝐺(𝑉, 𝐸), each vertex V𝑥 ∈ 𝑉, where 1 ≤ 𝑥 ≤ |𝑉| and |𝑉| represents the cardinality of the set 𝑉, is attributed to a specific node 𝑛𝑖 , and represents the provenance record for that node. One refers to this relation as 𝐻𝑂𝑆𝑇(V) = 𝑛𝑖 ; i.e., node 𝑛𝑖 is the host of V𝑥 . Each
4
Wireless Communications and Mobile Computing Table 1: Probability model for the alphabet N= {a,b,c}.
Symbol a b c
Occurrence Probability 0.3 0.3 0.4
0.0
0.3
a
a
b 0.6
a 0.516
b
0.48
c
1.0
0.48
0.39
0.3
Assigned Interval [0, 0.3) [0.3, 0.6) [0.6, 1)
b
0.552
c
0.6
c
0.6
Figure 3: The processes of arithmetic coding with the probability model shown in Table 1.
edge 𝑒𝑥𝑦 ∈ 𝐸 represents a directed edge from vertex V𝑥 to V𝑦 , where 1 ≤ 𝑦 ≤ |𝑉|. Meanwhile 𝐺(𝑉, 𝐸) satisfies the following properties: (1) 𝑝𝑑 is a subgraph of the WSN; (2) for, V𝑥 , V𝑦 ∈ 𝑉, V𝑦 is a child of V𝑥 iff 𝐻𝑜𝑠𝑡(V𝑦 ) forwards 𝑑 to 𝐻𝑜𝑠𝑡(V𝑥 ); (3) 𝑈 ⊂ 𝑉 is a set of children of V𝑥 ∈ 𝑉 iff, for each V𝑦 ∈ 𝑈, 𝐻𝑜𝑠𝑡(V𝑥 ) receives data packets from 𝐻𝑜𝑠𝑡(V𝑦 ). 3.3. Arithmetic Coding. Arithmetic coding [1, 18, 19] is a lossless data compression method that assigns short code words to the symbols with high occurrence probabilities and leaves the longer code words to the symbols with lower occurrence probabilities. The main idea of arithmetic coding is that each symbol of a message is represented by a halfopen subinterval of the initial half-open interval [0, 1), and then each subsequent symbol in the message decreases the interval’s size by a corresponding subinterval according to the symbol’s occurrence probability [19]. Figure 3 shows the process in which a message “bca” is encoded with the probability model in Table 1. The encoding and decoding operations are as follows: (1) Encoding: The initial interval is [0, 1). When the first symbol “b” is encoded, it narrows the interval from [0, 1) to [0.3, 0.6), where [0.3, 0.6) is the interval assigned to “b”. After the second symbol “c” is encoded, it narrows the [0.3, 0.6) to [0.48, 0.6) according to the interval assigned to “c”. Finally, the message “bca” is encoded as the interval [0.48, 0.516). (2) Decoding: The decoding algorithm utilizes the same probability model in Table 1. With the interval [0.48, 0.516)
of being encoded, the first symbol “b” is decoded because the [0.48, 0.516) is a subinterval of the interval [0.3, 0.6) which is the interval assigned to “b”. In what follows, the subinterval of “b” is further divided in the same manner to derive the subsequent symbols until the interval of being decoded is equal to the interval of being encoded, namely, [0.48, 0.516) in this example. The detailed encoding and decoding algorithms of arithmetic coding can be found in [1, 18].
4. Overview of Our Method In a large-scale WSN, the provenance decoding load at the BS is heavy, which also results in the low efficiency for the data trust evaluation. The layered clustering management provides a good way to manage large-scale WSNs. With a multilayer cluster structure, provenance can be encoded hierarchically, where the final provenance consists of multiple segments. By decoding the provenance segment on the higher layers, the BS obtains the provenance information roughly and then assesses the trustworthiness of the data quickly. Whether to decode the provenance on the next layer depends on the current decoding results; i.e., if we assure that the data have been tempered, the decoding stops immediately. Compared to the ACP scheme, our scheme has the following characteristics: (1) Because the layered clustering management is applied, the provenance on each layer can be encoded as an independent segment and the final encoded provenance is composed of a series of segments from different cluster layers. When the BS receives a provenance, it decodes the segment from the highest layer first, and then the BS obtains the provenance information on the most coarse-grained layer, which can be used for a rapid data trust evaluation. Thereafter, the BS continues to decode the provenance step by step. Finally, the BS reconstructs the accurate provenance by combining each segment’s decoding result. Therefore, our scheme can encode and decode the provenance in an incremental manner. Such a decoding method raises the efficiencies of the provenance decoding as well as the data trust evaluation. (2) Compared to the ACP scheme, which uses global probabilities to encode provenance, our scheme encodes the provenance through local probabilities which are only valid in a cluster. By using local probabilities, our scheme not only has a higher compression rate but also can update the probability model partially, which raises the provenance’s encoding and decoding efficiencies. A large WSN can be managed through a multilayer cluster structure, in which the cluster-heads of the same layer are the nodes of an upper layer cluster. As shown in Figure 4, we manage the WSN by different clusters and then form a twolayer cluster managing structure. In each cluster, the local cumulative probabilities are assigned for each member node. Note that the local cumulative probability is only valid in a cluster, which is quite different from the ACP scheme using global cumulative probabilities [1]. In Figure 4, the highlighted packet path starts from a data source node in a layer-1 cluster, and then
Wireless Communications and Mobile Computing BS
5 Table 2: The main symbols used in the scheme and algorithms. Symbols used in scheme/algorithms
Layer-2
Layer-1
Figure 4: The topology of a two-layer cluster-based WSN.
the packet passes through the nodes in a layer-2 cluster before it reaches the BS. Therefore, the provenance can be encoded into two segments for incremental decoding as shown in Figure 5. When the BS receives the encoded provenance, it can decode the provenance incrementally and reconstruct the provenance in a way of stepwise refinement. From the first provenance segment decoded results, the BS derives the packet path on layer-2 and the source node of the packet path indicates the cluster from which the packet comes. Then the second segment of the provenance is decoded and yields the packet path on layer-1. Finally, we can recover the entire packet path by combining the two parts decoding. Note that if we know that the packet has passed through some undependable nodes by the layer-2 decoding, the provenance and its packet will be dropped without further decoding, which increases the efficiencies of both provenance decoding and data trust assessment. Besides, applying a local cumulative probability rather than a global cumulative probability achieves a higher compression rate compared to the ACP scheme. Furthermore, in contrast to the DBNP scheme [11], we use nonoverlapped arithmetic coding which has no false positives. Because our CBP scheme uses the encoding intervals generated from each node’s cumulative probability, the cumulative probabilities are then not changed drastically with respect to the WSN’s topology changes. Hence, our scheme is robust to the WSN’s topology changes.
5. Cluster-Based Provenance Encoding and Decoding Before introducing our scheme, we first define the main symbols used in the scheme and algorithms. See Table 2 for details. At the beginning, the BS trains the network for a certain period to get the number of the times each node 𝑛𝑖 appears on the packets’ paths as the node’s occurrence frequency 𝑜𝑓𝑖 . During the training process, we let each source node in the network send a certain number of packets to the BS. Upon receiving these packets, the BS computes the occurrence frequencies for each node in the network. Then the local probabilities of each node are computed in their cluster, respectively. How long the training process takes depends
ofi opi cpi ofij opij cpij
Corresponding meanings Occurrence frequency of 𝑛𝑖 Occurrence probability of 𝑛𝑖 Cumulative occurrence probability of 𝑛𝑖 Associated frequency of 𝑛𝑖 and 𝑛𝑗 Associated probability of 𝑛𝑖 and 𝑛𝑗 Cumulative associated probability of 𝑛𝑖 and 𝑛𝑗
[Lx , Hx ) nCx buffer
Coding interval Cluster-head ID Data cache for the most significant digits
on the WSN’s scale as well as the accuracy requirement. The more packets used in the training process, the more model accuracy attained, which is also time consuming. For each node 𝑛𝑖 , its occurrence probability 𝑜𝑝𝑖 can be computed by the following formula: 𝑜𝑝𝑖 = 𝑜𝑓𝑖 /𝑜𝑓, where 𝑜𝑓 = ∑|𝑁| 𝑖=1 𝑜𝑓𝑖 . Thereafter, the BS computes the cumulative occurrence probability 𝑐𝑝𝑖 for each node 𝑛𝑖 by the following equation: 𝑐𝑝0 = 0, 𝑐𝑝𝑖 = 𝑐𝑝𝑖−1 + 𝑜𝑝𝑖 .
(2)
In what follows, the BS calculates the occurrence frequency with which 𝑛𝑖 appears next to 𝑛𝑗 as the associated frequency 𝑜𝑓𝑖𝑗 . Because the number of times a node appears on all the packet paths is equal to the number of the packets that the other nodes receive from it, the total associated frequency of node 𝑛𝑗 is then equal to its occurrence frequency 𝑜𝑓𝑗 . Hence, the associated probability 𝑜𝑝𝑖𝑗 = 𝑜𝑓𝑖𝑗 /𝑜𝑓𝑗 . At the BS, the cumulative associated probability 𝑐𝑝𝑖𝑗 for each node 𝑛𝑖 is thus derived as 𝑐𝑝0𝑗 = 0, 𝑐𝑝𝑖𝑗 = 𝑐𝑝(𝑖−1)𝑗 + 𝑜𝑝𝑖𝑗 .
(3)
Once the nodes of the WSNs we considered in our scheme are deployed, they stay stationary. In our scheme, we hypothesize that topology changes of the WSNs are slow and infrequent. This kind of slow and infrequent topology changes cannot drastically modify the occurrence frequencies and the probabilities assigned to the nodes. To keep the occurrence frequencies and the probabilities as accurate as possible, we update the probability model periodically or on request by the BS. 5.1. Simple Provenances Encoding and Decoding. Along a packet transmission path, in our simple provenance encoding algorithm (see Algorithm 1), the initial coding interval at the data source is [𝐿 0 , 𝐻0 ) = [0, 1). In what follows the
6
Wireless Communications and Mobile Computing
Input: [𝐿 𝑥1 −1 , 𝐻𝑥1 −1 ) Output: 𝑛𝐶𝑥 [𝐿 𝑥1 , 𝐻𝑥1 ), 𝑏𝑢𝑓𝑓𝑒𝑟 1 𝑙𝑜𝑤 = 𝐿 𝑥1 −1 , ℎ𝑖𝑔ℎ = 𝐻𝑥1 −1 𝑟𝑎𝑛𝑔𝑒 = ℎ𝑖𝑔ℎ − 𝑙𝑜𝑤 𝑏𝑢𝑓𝑓𝑒𝑟 = 0 IF 𝑛𝑖 is a source node or a cluster source node THEN ℎ𝑖𝑔ℎ = 𝑙𝑜𝑤 + 𝑐𝑝𝑖 × 𝑟𝑎𝑛𝑔𝑒 𝑙𝑜𝑤 = 𝑙𝑜𝑤 + (𝑐𝑝𝑖 − 𝑜𝑝𝑖 ) × 𝑟𝑎𝑛𝑔𝑒 ELSE IF 𝑛𝑖 is a forwarder node or a cluster forwarder node receiving packet from 𝑛𝑗 THEN ℎ𝑖𝑔ℎ = 𝑙𝑜𝑤 + 𝑐𝑝𝑖𝑗 × 𝑟𝑎𝑛𝑔𝑒 𝑙𝑜𝑤 = 𝑙𝑜𝑤 + (𝑐𝑝𝑖𝑗 − 𝑜𝑝𝑖𝑗 ) × 𝑟𝑎𝑛𝑔𝑒 ELSE IF 𝑛𝑖 is a cluster-head THEN ℎ𝑖𝑔ℎ = ℎ𝑖𝑔ℎ 𝑙𝑜𝑤 = 𝑙𝑜𝑤 𝑛𝐶𝑥 = 𝑛𝑖 1 END IF WHILE MSD(𝑙𝑜𝑤)=MSD(ℎ𝑖𝑔ℎ) DO /∗MSD(x) returns the most significant digit of x∗/ 𝑏𝑢𝑓𝑓𝑒𝑟 = 𝑏𝑢𝑓𝑓𝑒𝑟 ∪ 𝑀𝑆𝐷(𝑙𝑜𝑤) 𝑙𝑜𝑤 = 𝑆ℎ𝑖𝑓𝑡𝐿(𝑙𝑜𝑤, 1) ℎ𝑖𝑔ℎ = 𝑆ℎ𝑖𝑓𝑡𝐿(ℎ𝑖𝑔ℎ, 1) /∗ShiftL(x,y) function returns x shifted by y digits in the left∗/ END WHILE 𝐿 𝑥1 = 𝑙𝑜𝑤 𝐻𝑥1 = ℎ𝑖𝑔ℎ Algorithm 1: Simple provenance encoding.
The compressed provenance
The first provenance segment derived from Layer-2
The second provenance segment derived from Layer-1
Recover the packet path on Layer-2
Recover the packet path on Layer-1
Figure 5: The encoded provenance with two segments.
interval [𝐿 𝑥−1 , 𝐻𝑥−1 ) is used to denote the provenance at the (x-1)th node. When the provenances come from different clusters, the ID of the cluster-head is attached to distinguish the provenances that may share the same coding interval. A cluster-head of the first layer may play the role of a data source, forwarder, or aggregator node on the second layer. The time complexity of the compression at a clusterhead is the same as that of a data source node, forwarder, or aggregator node, where the space complexity which depends on the layer where the cluster-head is located is doubled or even more. (1) If node 𝑛𝑖 is the data source with the occurrence probability 𝑜𝑝𝑖 and the cumulative probability 𝑐𝑝𝑖 , the interval [𝐿 1 , 𝐻1 ) is then encoded as follows: [𝐿 0 , 𝐻0 ) = [0, 1) ; 𝐻1 = 𝐿 0 + 𝑐𝑝𝑖 × (𝐻0 − 𝐿 0 ) ;
𝐿 1 = 𝐿 0 + (𝑐𝑝𝑖 − 𝑜𝑝𝑖 ) × (𝐻0 − 𝐿 0 ) . (4) (2) If node 𝑛𝑖 is a forwarder node which receives an interval [𝐿𝑥−1 , 𝐻𝑥−1 ) from the (x−1)th node 𝑛𝑗 , the provenance [𝐿 𝑥 , 𝐻𝑥 ) is then encoded as follows: 𝐻𝑥 = 𝐿 𝑥−1 + 𝑐𝑝𝑖𝑗 (𝐻𝑥−1 − 𝐿 𝑥−1 ) ; 𝐿 𝑥 = 𝐿 𝑥−1 + (𝑐𝑝𝑖𝑗 − 𝑜𝑝𝑖𝑗 ) × (𝐻𝑥−1 − 𝐿 𝑥−1 ) .
(5)
Although real numbers are used in our algorithms to represent the values of the probabilities and the intervals, at each sensor node the real numbers are replaced by integers to fit for the limited computational ability. Therefore, to meet the demands for the increasing precision as well as avoid transmitting duplicated data, when the most significant digits of the two numbers that define the interval [𝑙𝑜𝑤, ℎ𝑖𝑔ℎ) are
Wireless Communications and Mobile Computing
7
Input: 𝑛𝐶𝑥 [𝐿 𝑓 , 𝐻𝑓 ), 𝑏𝑢𝑓𝑓𝑒𝑟 𝑖 Output: Provenance P 𝑙𝑜𝑤 = 𝐿 𝑓 ℎ𝑖𝑔ℎ = 𝐻𝑓 IF 𝑏𝑢𝑓𝑓𝑒𝑟 = 0THEN (𝑙𝑜𝑤 + ℎ𝑖𝑔ℎ) 𝑐𝑜𝑑𝑒 = 2 ELSE 𝑐𝑜𝑑𝑒 = 𝑆ℎ𝑖𝑓𝑡𝑅(𝑏𝑢𝑓𝑓𝑒𝑟 + (𝑙𝑜𝑤 + ℎ𝑖𝑔ℎ)/2, |𝑏𝑢𝑓𝑓𝑒𝑟|) /∗ShiftR(x,y) function returns x shifted by y digits in the right∗/ END IF /∗If code is equals to the one we retrieved. ∗/ /∗Then we retrieve the path which includes 𝑛𝐶𝑥 ∗/ 𝑖 FOR 𝑖=1 to |N| DO IF (𝑐𝑝𝑖 − 𝑜𝑝𝑖 ) ≤ 𝑐𝑜𝑑𝑒 < 𝑐𝑝𝑖 THEN 𝑠𝑜𝑢𝑟𝑐𝑒 = 𝑛𝑖 BREAK END IF END FOR 𝑑𝑐 = 𝑠𝑜𝑢𝑟𝑐𝑒/∗source decoded∗/ 𝑃 = 𝑃 ∪ 𝑑𝑐 𝑅𝑑𝑐 = 𝑜𝑝(𝑑𝑐) /∗probability range of decoded∗/ 𝐿 𝑑𝑐 = 𝑐𝑝(𝑑𝑐) − 𝑜𝑝(𝑑𝑐) /∗lower end of probability range∗/ WHILE 𝑑𝑐 =the ̸ node from which BS received packet do /∗remove effect of decoded node∗/ 𝑐𝑜𝑑𝑒 − 𝐿 𝑑𝑐 𝑐𝑜𝑑𝑒 = 𝑅𝑑𝑐 FOR 𝑖=1 to|N| DO IF (𝑐𝑝𝑖(𝑑𝑐) − 𝑜𝑝𝑖(𝑑𝑐) ≤ 𝑐𝑜𝑑𝑒 < 𝑐𝑝𝑖(𝑑𝑐) ) THEN 𝑃 = 𝑃 ∪ 𝑛𝑖 𝐿 𝑑𝑐 = 𝑐𝑝𝑖(𝑑𝑐) − 𝑜𝑝𝑖(𝑑𝑐) 𝑅𝑑𝑐 = 𝑜𝑝𝑖(𝑑𝑐) 𝑑𝑐 = 𝑛𝑖 BREAK END IF END FOR END WHILE Algorithm 2: Simple provenance decoding.
identical, the most significant digit will be shifted out and stored in a buffer. For example, the interval [0.21, 0.26) is represented as [0.1, 0.6) {2}, where {2} is the buffer. Upon receiving a packet, the BS recovers the provenance through the encoded provenance 𝑛𝐶𝑥 [𝐿 𝑓 , 𝐻𝑓 ); refer to 𝑖 Algorithm 2. The middle point number of the 𝐿 𝑓 and the 𝐻𝑓 is selected using (6) as the flag code to locate the data source node’s interval and the data source node is then retrieved. Thereafter, the data source node’s effect is removed from the interval [𝐿 𝑓 , 𝐻𝑓 ) and the next node on the packet path will be retrieved through the new flag code by (7). 𝑐𝑜𝑑𝑒 = 𝑐𝑜𝑑𝑒𝑥 =
(𝐿 𝑓 + 𝐻𝑓 ) 2
,
𝑐𝑜𝑑𝑒𝑥−1 − (𝑐𝑝𝑥−1 − 𝑜𝑝𝑥−1 ) , 𝑜𝑝𝑥−1
(6) (7)
where 𝑐𝑝𝑥−1 and 𝑜𝑝𝑥−1 denote the cumulative occurrence probability and the occurrence probability of the node being
decoded, respectively. Furthermore, the cluster-head’s ID 𝑛𝐶𝑥 𝑖 is used to exclude the nodes that do not belong to such a cluster. 5.2. Aggregated Provenances Encoding and Decoding. Without loss of generality, at an aggregator node assume that there are two provenance intervals [𝐿 𝑏1 , 𝐻𝑏1 ), [𝐿 𝑏2 , 𝐻𝑏2 ). The aggregator node encodes its ID into both the [𝐿 𝑏1 , 𝐻𝑏1 ) and the [𝐿 𝑏2 , 𝐻𝑏2 ), which yields the new intervals [𝐿𝑏1 , 𝐻𝑏1 ) and [𝐿𝑏2 , 𝐻𝑏2 ), respectively. The aggregator node compares the
lengths of the two intervals [𝐿𝑏1 , 𝐻𝑏1 ) and [𝐿𝑏2 , 𝐻𝑏2 ) and then sets the longer one as the first interval which indicates that it is the active interval. Thereafter, the aggregator node randomly chooses a real number 𝑟𝑏 in the shorter interval and sends 𝑟𝑏 with the active interval to the next hop. Finally the aggregated provenance has the form 𝑛𝑐𝑏 [𝐿𝑏𝑎 , 𝐻𝑏𝑎 ), 𝑛𝑐𝑏 𝑟𝑏1 , . . . , 𝑛𝑐𝑏 𝑟𝑏𝜆−1 ; 𝑎 1 𝜆−1 refer to Algorithm 3.
8
Wireless Communications and Mobile Computing
Input: 𝑛𝐶𝑏 [𝐿 𝑏1 , 𝐻𝑏1 ), 𝑛𝐶𝑏 [𝐿 𝑏2 , 𝐻𝑏2 ), . . . , 𝑛𝐶𝑏 [𝐿 𝑏𝜆 , 𝐻𝑏𝜆 ) 1 2 𝜆 Output: 𝑛𝐶𝑏 [𝐿𝑏𝑎 , 𝐻𝑏𝑎 ), 𝑛𝐶𝑏 𝑟𝑏1 , . . . , 𝑛𝐶𝑏 𝑟𝑏𝜆−1 𝑎 1 𝜆−1 FOR x=1 to 𝜆 DO 𝑛𝑖 encodes itself with[𝐿 𝑏𝑥 , 𝐻𝑏𝑥 )using Algorithm 1 and results[𝐿𝑏𝑥 , 𝐻𝑏𝑥 ) IF(x=1) THEN 𝑀𝑎𝑥𝐿 = 𝐿𝑏1 𝑀𝑎𝑥𝐻 = 𝐻𝑏1 END IF IF(x>1) THEN IF (𝐻𝑏𝑥 − 𝐿𝑏𝑥 ≥ 𝑀𝑎𝑥𝐻 − 𝑀𝑎𝑥𝐿)THEN 𝑛𝑖 chooses a real number 𝑟𝑏𝑥 ∈ [𝑀𝑎𝑥𝐿, 𝑀𝑎𝑥𝐻) 𝑀𝑎𝑥𝐻 = 𝐻𝑏𝑥 𝑀𝑎𝑥𝐿 = 𝐿𝑏𝑥 ELSE 𝑛𝑖 chooses a real number 𝑟𝑏𝑥 ∈ [𝐿𝑏𝑥 , 𝐻𝑏𝑥 ) END IF END IF END FOR 𝐿𝑏𝑎 = 𝑀𝑎𝑥𝐿 𝐻𝑏𝑎 = 𝑀𝑎𝑥𝐻 prepend 𝑟𝑏1 , 𝑟𝑏2 , . . . , 𝑟𝑏𝜆−1 to [𝐿𝑏𝑎 , 𝐻𝑏𝑎 ) Algorithm 3: Aggregated provenance encoding.
Input: 𝑛𝐶𝑏 [𝐿𝑏𝑎 , 𝐻𝑏𝑎 ), 𝑛𝐶𝑏 𝑟𝑏1 , . . . , 𝑛𝐶𝑏 𝑟𝑏𝜆−1 𝑎 1 𝜆−1 Output: Aggregated provenance AP P=decode [𝐿𝑏𝑎 , 𝐻𝑏𝑎 ) using Algorithm 2 𝐴𝑃 = 𝐴𝑃 ∪ 𝑃 FOR x=1 to 𝜆 − 1 DO Let code=𝑟𝑏𝑥 P=decode code using 𝐴lgorithm 2 until it reaches a node on the path retrieved from [𝐿𝑏𝑎 , 𝐻𝑏𝑎 ) 𝐴𝑃 = 𝐴𝑃 ∪ 𝑃 END FOR Algorithm 4: Aggregated provenance decoding.
The BS decodes an aggregated provenance as a series of simple provenances which consists of the aggregated provenances (see Algorithm 4), where the simple provenances are packet path sections: (1) from a data source to an aggregator node, (2) from an aggregator node to another aggregator node, (3) from an aggregator node to the BS.
6. Cases Study In this section, two cases are provided. Without loss of generality, the WSN is organized in two levels in these cases. Our provenance scheme uses hierarchical arithmetic coding to compress provenance within and among the clusters. When the packets pass through the cluster-heads, the provenance will be encoded at a higher level. Figure 6 shows the topology of a WSN composed of four clusters in layer-1. The four cluster-heads, namely, 𝑛5 , 𝑛10 , 𝑛15 , and 𝑛20 , collect packets within their clusters and then transmit the packets to the BS.
In Figure 6, the initial probabilities for the member nodes and the cluster-heads were assigned evenly; refer to Tables 3 and 4. For simplicity, we take a sample provenance and an aggregated provenance that were generated in cluster A as the examples to illustrate how our provenance encoding scheme works. In Figure 7, the values assigned to the directed edge represent the associated probabilities between the nodes. Based on the data from Tables 3 and 4, the cumulative associated probabilities assigned to the nodes and the clusterheads were derived by (3). 6.1. Sample Provenance. Assume that the simple provenance to be encoded is ⟨𝑛8 , 𝑛9 , 𝑛7 , 𝑛10 , 𝑛20 , 𝐵𝑆⟩. As the occurrence probability’s range of the data source 𝑛8 is [0.5, 0.75), 𝑛8 then sends the provenance as {[0.5, 0.75), {0}} to its next node 𝑛9 , where {0} denotes that the buffer is now empty.
Wireless Communications and Mobile Computing
9
BS
n15
n5 n10 Layer-2 B
n3 n1
n4
n2
n6 A
n20
n9
n11
n14
n13 n18
n7
n8
n12
n19 Layer-1
n17
n16
C
D
Figure 6: The topology of a WSN which consists of four clusters and a BS.
Table 3: Occurrence probabilities and cumulative occurrence probabilities for the member nodes. Nodes 𝑛1 , 𝑛6 , 𝑛11 , 𝑛16 𝑛2 , 𝑛7 , 𝑛12 , 𝑛17 𝑛3 , 𝑛8 , 𝑛13 , 𝑛18 𝑛4 , 𝑛9 , 𝑛14 , 𝑛19
𝑜𝑝𝑖 0. 25 0. 25 0. 25 0. 25
𝑐𝑝𝑖 0. 25 0. 5 0. 75 1
BS 1
Range [0, 0.25) [0.25, 0.5) [0.5, 0.75) [0.75, 1)
0.5 n10
1 n7
Table 4: Occurrence probabilities and cumulative occurrence probabilities for the cluster-heads. Nodes 𝑛5 𝑛10 𝑛15 𝑛20
𝑜𝑝𝑖 0. 25 0. 25 0. 25 0. 25
𝑐𝑝𝑖 0. 25 0. 5 0. 75 1
Range [0, 0.25) [0.25, 0.5) [0.5, 0.75) [0.75, 1)
0.5
n6
n20
0.5
0.5 n9
0.5
0.5
0.5
(A)
0.5
n8
Figure 7: The topology of the cluster A in Figure 6.
Node 𝑛9 then derives the new coding interval through its associated probability and cumulative associated probability with respect to 𝑛8 . According to Algorithm 1, the new coding interval at 𝑛9 is equal to [0.625, 0.75). Similarly, the new interval at 𝑛7 is encoded as [0.625, 0.6875) and then the provenance is updated as {[0.25, 0.875), {6}} when being sent to 𝑛10 . Because 𝑛10 is a cluster-head, it simply adds its cluster ID to the provenance and updates the provenance as {{𝑛10 }, [0.25, 0.875), {6}}. Because the occurrence probability’s range of the data source 𝑛10 is [0.25, 0.5), 𝑛10 sends the provenance as {{0}, [0.25, 0.5), {0}} with {{𝑛10 }, [0.25, 0.875), {6}} to its next node 𝑛20 . Because 𝑛20 is a cluster-head, it only updates the provenance at the higher level, i.e., the cluster-head level, and then sends the updated provenance in the form of {{{0}, [0.25, 0.375), {0}}, {{𝑛10 }, [0.25, 0.875), {6}}} to the BS. Table 5 shows the encoding processes of the simple
provenance ⟨𝑛8 , 𝑛9 , 𝑛7 , 𝑛10 , 𝑛20 , 𝐵𝑆⟩ at each node along the packet path. When the packet arrives, the BS parses the attached provenance. Because there are two cluster levels, the provenance has two sections accordingly. For the first section, namely, {{{0}, [0.25, 0.375), {0}}, the BS filtrates the interval [0.25, 0.375) and the buffer and then derives that 𝑐𝑜𝑑𝑒1 = 0.3125 which belongs to the cumulative probability of 𝑛10 . The data source node of the first section is thus 𝑛10 . Thereafter, the BS removes the effect of 𝑛10 from the 𝑐𝑜𝑑𝑒1 and then derives that 𝑐𝑜𝑑𝑒2 is equal to 0.26. Because the associated probability of 𝑛20 with respect to 𝑛10 is [0, 0.5), 𝑛20 is yielded from the decoding. The BS stops decoding the first section because the packet was received from 𝑛20 and yields the decoding result of layer-2 as ⟨𝑛10 , 𝑛20 , 𝐵𝑆⟩. With the second section, the BS filtrates that the cluster-head ID is 𝑛10 , the
10
Wireless Communications and Mobile Computing Table 5: Simple provenance encoding at each node along the packet path.
Pack Path 𝑛8 𝑛8 𝑛9 𝑛8 𝑛9 𝑛7 𝑛8 𝑛9 𝑛7 𝑛10 𝑛10 𝑛10 𝑛20
Encoded Node 𝑛8 𝑛9 𝑛7
Cluster-head ID 0 0 0 𝑛10 0 0
𝑛10 𝑛20
Coding Interval [0.5, 0.75) [0.625, 0.75) [0.625, 0.6875)
Buffer 0 0 6
[0.25, 0.5) [0.25, 0.375)
0 0
Provenance {{0}, [0.5, 0.75), {0}} {{0}, [0.625, 0.75) , {0 }} {{0}, [0.25, 0.875), {6}} {{𝑛10 }, [0.25, 0.875), {6}} {{{0}, [0.25, 0.5), {0}}, {{𝑛10 }, [0.25, 0.875) {6}}} {{{0}, [0.25, 0.375), {0}}, {{𝑛10 }, [0.25, 0.875), {6}}}
Table 6: Simple provenance decoding at the BS. Parts of Provenance
Code
Cluster-head ID
Buffer
Decoded Node
Pack Path
First Part: {{0}, [0.25, 0.5), {0}}
0.3125 0.26
0 0
0 0
𝑛10 𝑛20
𝑛10 𝑛10 𝑛20
Second Part: {{𝑛10 }, [0.25, 0.875), {6}}
0.65625 0.625 0.25
𝑛10 𝑛10 𝑛10
6 0 0
𝑛8 𝑛9 𝑛7
𝑛8 𝑛8 𝑛9 𝑛8 𝑛9 𝑛7
{{},[0,0
n6
.25),{}}
n7 n9 n8
}}
),{}}
{{},[0,0.125),{}} {{},[0.25,0.875),{6}}
{{},[0,0.125),{}},{}0.65}
{{n10 },[0,0.125),{}},{n10 }0.65] BS n10
25,0.75
.6 {{},[0
,0.75),{
.5 {{},[0
Figure 8: Aggregated provenance encoding at each node along the packet path.
coding interval is [0.25, 0.875), and the buffer is {6}. The BS then derives that 𝑐𝑜𝑑𝑒1 = 0.65625 which belongs to the occurrence probabilities of 𝑛3 , 𝑛8 , 𝑛13 , and 𝑛18 . Note that the cluster-head’s ID is 𝑛10 ; the data source is thus 𝑛8 . Therefore, the BS removes the 𝑛8 ’s effect from the 𝑐𝑜𝑑𝑒1 and derives that 𝑐𝑜𝑑𝑒2 is equal to 0.625. Because the associated probability’s range of 𝑛9 with respect to 𝑛8 is [0.5, 1), 𝑛9 is yielded from the decoding. The BS stops decoding until the last node 𝑛7 is yielded. The decoding result is then ⟨𝑛8 , 𝑛9 , 𝑛7 , 𝑛10 ⟩. Finally, the BS combines the incremental decoding results and then knows the provenance is ⟨𝑛8 , 𝑛9 , 𝑛7 , 𝑛10 , 𝑛20 , 𝐵𝑆⟩. In order to explain the decoding process more clearly, Table 6 shows the steps of the simple provenance decoding ⟨𝑛8 , 𝑛9 , 𝑛7 , 𝑛10 , 𝑛20 , 𝐵𝑆⟩ at the BS. The BS decodes the first part of the provenance and reconstructs the data packet path on layer-2 which is composed of cluster-heads for the clusters on layer-1 (see Figure 6). According to the layer-2 decoding result, the BS knows from which cluster this data packet comes. If the BS finds any undependable information such as tampered nodes or faked packet path in the layer-2 decoding, it will discard the packet and stop decoding, which raises the provenance decoding efficiency as well as the data trust assessment efficiency. 6.2. Aggregated Provenance. In Figure 7, now we consider the encoding and decoding of an aggregated provenance (((𝑛6 )((𝑛8 ), 𝑛9 ), 𝑛7 ), 𝑛10 ). According to Algorithm 3, at the
beginning, the data source 𝑛6 sends [0, 0.25) (referred to as [𝐿 1 , 𝐻1 )) with a packet 𝑝1 to its next node 𝑛7 . At the moment, the data source 𝑛8 also sends [0.5, 0.75) as the provenance with packet 𝑝2 to its next node 𝑛9 , where the new coding interval [0.625, 0.75) (referred to as [𝐿 2 , 𝐻2 )) is derived. At the first aggregator node 𝑛7 , the two packets 𝑝1 and 𝑝2 are met. Because there are two coding intervals, i.e., [𝐿 1 , 𝐻1 ) and [𝐿 2 , 𝐻2 ), 𝑛7 encodes its ID into both of them and makes the new intervals as [𝐿1 , 𝐻1 )=[0, 0.125) and [𝐿2 , 𝐻2 )= [0.625, 0.6875), respectively. Thereafter, 𝑛7 compares the lengths of [𝐿1 , 𝐻1 ) and [𝐿2 , 𝐻2 ) and chooses a random real number 𝑟𝑏 belonging to the shorter interval. Subsequently, 𝑛7 updates the aggregated provenance to the form of {{{0}, [0, 0.125), {0}}, {0}0.65}, where 𝑟𝑏 = 0.65, and sends it with the new aggregated packet to 𝑛10 . Because 𝑛10 is a cluster-head, it simply adds its ID to the provenance and updates the provenance to the form of {{{𝑛10 }, [0, 0.125), {0}}, {𝑛10 }0.65}. Finally, the provenance of the aggregated packet is {{{𝑛10 }, [0, 0.125), {0}}, {𝑛10 }0.65} at the BS. Figure 8 shows the encoding of the aggregated provenance (((𝑛6 )((𝑛8 ), 𝑛9 ), 𝑛7 ), 𝑛10 ) at each node along the packet path. When the packet arrives, first, the BS decodes the foremost part {{𝑛10 }, [0, 0.125), {0}} of the provenance, which yields ⟨𝑛6 , 𝑛7 , 𝑛10 , 𝐵𝑆⟩. Second, the BS decodes {𝑛10 } 0.65 in the provenance according to Algorithm 4, because 𝑐𝑜𝑑𝑒 = 0.65 which belongs to the occurrence probability ranges of 𝑛3 ,
Wireless Communications and Mobile Computing
11 An aggregated provenance
{n10 }
Indicates that the data comes from the cluster n10
[0,0.125)
{Ø}
n 6, n 7, n 10 , BS
{n10 }
Indicates that the data comes from the cluster n10 n6
0.65
n 8, n 9, n 7
n 8 , n 9 , n 7 , n 10
Figure 9: The decoding processes for an aggregated provenance at the BS.
𝑛8 , 𝑛13 , and 𝑛18 . Note that the cluster-head’s ID is 𝑛10 ; the data source is thus decoded as 𝑛8 . In what follows, the BS removes the 𝑛8 ’s effect from the 𝑐𝑜𝑑𝑒 and yields 𝑐𝑜𝑑𝑒1 as 0.6. Because the associated probability of 𝑛9 with respect to 𝑛8 is [0.5, 1), 𝑛9 is then yielded from the decoding. The decoding process stops until 𝑛7 is yielded. As 𝑛7 is a node on the path decoded from the foremost part of the provenance, the decoding process ends with the result (((𝑛6 )((𝑛8 ), 𝑛9 ), 𝑛7 ), 𝑛10 ). Figure 9 shows the decoding processes of the aggregated provenance (((𝑛6 )((𝑛8 ), 𝑛9 ), 𝑛7 ), 𝑛10 ) at the BS.
7.3. The Optimal Cluster Size. Assume that the number of the nodes in a WSN is 𝑁 and the number of the cluster-heads is 𝑀, where 𝑀 < 𝑁 and M and N are positive integers. For the given 𝑀 and 𝑁, if the average provenance size has the minimum value compared to other values assigned to 𝑀 and 𝑁, 𝑀 is then the optimal clustering size for the WSN. Claim. With our cluster-based arithmetic coding provenance scheme (CBP), the optimal cluster size is 𝑀 = √𝑁.
7. Performance Analysis In this section, we theoretically analyze the performance of our CBP scheme with respect to the compressed provenance length and the optimal clustering size. 7.1. Entropy of Simple Provenance. In our approach, according to Shannon’s theory, it takes 𝐻𝑗 = ⌈− log 𝑜𝑝𝑗 ⌉ bits to represent a source node 𝑛𝑗 and 𝐻𝑖𝑗 = ⌈− log 𝑜𝑝𝑖𝑗 ⌉ bits to represent a forwarder node 𝑛𝑖 , where 𝑛𝑗 is 𝑛𝑖 ’s children node. Hence, we can derive the entropy of the provenance from the number of the bits required to represent an interval 𝑟; i.e., 𝐻𝑟 = ⌈− log 𝑟⌉. Note that the final interval’s size is equal to the product of the occurrence probabilities of the source node and the corresponding associated probabilities of the forwarder nodes; i.e., 𝑟 = 𝑜𝑝𝑗 × ∏𝑙𝑗𝑖 ∈𝐸 𝑜𝑝𝑗𝑖 . 𝐻𝑟 is thus calculated as ] 𝐻𝑟 = [ [− log (𝑜𝑝𝑗 × ∏ 𝑜𝑝𝑗𝑖 )] [ ] 𝑙𝑗𝑖 ∈𝐸 [ ]
aggregator nodes, where 𝑜𝑝𝑛𝑟 𝑗 is the associated probability of node 𝑛𝑟 with respect to its child node 𝑛𝑗 .
(8)
] =[ [− log 𝑜𝑝𝑗 − ∑ 𝑜𝑝𝑗𝑖 ] . ] [ 𝑙𝑗𝑖 ∈𝐸 ] [ 7.2. Entropy of Aggregated Provenance. Assume that the number of aggregator nodes is 𝑅 and the number of the branches is 𝑏𝑟 (𝑏𝑟 > 1) at an aggregator node 𝑛𝑟 (1 ≤ 𝑟 ≤ 𝑅). Therefore, 𝑏𝑟 −1 ⌈log 𝑜𝑝𝑛𝑟 𝑗 ⌉ bits are needed to represent all the − ∑𝑅𝑟=1 ∑𝑞=1
Justification. Assume that the occurrence probability 𝑜𝑝𝑖 of each node is evenly distributed. All member nodes’ occurrence probabilities are then evenly distributed too; i.e., 𝑜𝑝1 = 𝑜𝑝2 = ⋅ ⋅ ⋅ = 𝑜𝑝𝑖 = ⋅ ⋅ ⋅ = 𝑜𝑝𝑛 . Therefore, each node’s cumulative occurrence probability is 𝑐𝑝0 = 0, 𝑐𝑝𝑖 = 𝑐𝑝𝑖−1 + 𝑜𝑝𝑖 , where 𝑜𝑝 = ∑|𝑁| 𝑖=1 𝑜𝑝𝑖 = 1. According to the entropies of the simple provenance and the aggregated provenance, when 𝑀 = √𝑁, the average entropy of the provenances has the minimum value, which indicates that the average provenance size reaches its minimum value.
8. Simulations We used TinyOS 2.1.2 TOSSIM and PowerTOSSIMz for the implementation of our approach to evaluate the performance of our approach. In the simulations, a WSN consisting of 101 nodes with IDs 0 through 100 is deployed, where the node with ID 0 is set as the BS. The network diameters vary from 2 to 14 hops. The duration of each data collection round is set to 2 seconds. We define the topology of a WSN by offering onehop neighboring information between nodes. According to the topology of such a WSN, we randomly select some nodes either as the data source or aggregator nodes in TinyOS, and then we take a two-layer cluster to verify our scheme. First, all the 100 nodes are managed into different clusters. The clusterhead collects data from its member nodes and then sends the data toward the BS through multihops. At the beginning, the BS computes the occurrence probability, the cumulative occurrence probability for each node, and the associated
12
Wireless Communications and Mobile Computing
8.1. Performance Metrics. The following performance metrics are used in the paper: (i) Average provenance sizes (APS): When the BS receives a packet, it filtrates the 𝐶𝑓 [𝐿 𝑓 , 𝐻𝑓 ) and 𝑏𝑢𝑓𝑓𝑒𝑟 from the provenance. Assume that 𝑆𝐶𝑓 , 𝑆𝐿 𝑓 , and 𝑆𝐻𝑓 denote the sizes of 𝐶𝑓 , [𝐿 𝑓 , 𝐻𝑓 ), and 𝑏𝑢𝑓𝑓𝑒𝑟, respectively. The size of the provenance is then equal to (𝑆𝐶𝑓 + 𝑆𝐿 𝑓 + 𝑆𝐻𝑓 + 𝑆𝑏𝑢𝑓𝑓𝑒𝑟 ). In the simulations, we use 8 bits to denote 𝐶𝑓 and 16 bits to denote 𝐿 𝑓 and 𝐻𝑓 , respectively. Assume that there are 𝑚 packets 𝑝1 , 𝑝2 , 𝑝3 , . . . , 𝑝𝑚 ; APS is then defined as follows: 𝐴𝑃𝑆 =
∑𝑚 𝑖=1 𝑃𝑆𝑖 , 𝑚
(9)
where 𝑃𝑆𝑖 represents the provenance size of the packet 𝑝𝑖 . (ii) Total energy consumption (TEC): Suppose that there are 𝑛1 , 𝑛2 , 𝑛3 , . . . , 𝑛𝑚 nodes in a WSN. TEC is defined as follows: 𝑚
𝑇𝐸𝐶 = ∑𝐸𝐶𝑖 ,
(10)
𝑖=1
where 𝐸𝐶𝑖 denotes the energy consumed by node 𝑛𝑖 and 𝑚 represents the total number of the nodes in the WSN. 8.2. Simulation Results. The identical simulation environment is used to simulate the ACP scheme and our CBP scheme. Figure 10 shows the relationship between the number of the clusters and the average provenance size. The curve shows that when the number of clusters is equal to the number of the nodes in each cluster, the average provenance size reaches its minimum value. When all nodes are assigned in one cluster or each node forms an individual cluster, the average provenance size reaches its maximum value. Such simulation results also verified the conclusion in Section 7.3. From the trends of the two curves in Figure 11(a), it can be concluded that our scheme can achieve a higher compression rate than that of the ACP scheme. With the number of hops
12 Average provenance size (byte)
probability and the cumulative associated probability for each node pair in the WSN. For the purpose of simplicity, real numbers are used in this paper to represent the probabilities and define the coding intervals. In the simulations and the experiments, because of the computational limitations, integer arithmetic coding is applied because of the computational limitations at sensor nodes. By using a 2-byte integers, the initial interval [0, 1) is represented as [0, 216 − 1). In addition, we directly compare our approach with the ACP scheme [1] which has close relationship with our CBP scheme, where the ACP scheme assigns each node a global cumulative probability and then uses the cumulative conditional probabilities for each connected node pair to generate the provenance through arithmetic coding.
11 10 9 8 7 6
0
10
20
30
40 50 60 70 number of clusters
80
90
100
CBP
Figure 10: The relationship between the number of the clusters and the average provenance size in a WSN.
increasing, our scheme outperforms the ACP scheme with respect to the average provenance size. Figure 11(b) shows the total energy consumption of the ACP and the CBP schemes when 100 packets are transmitted. Compared to Figures 11(a) and 11(b), we can find that curves share the same trend. The more messages are transmitted through wireless signals, the more energy is consumed. As to the CBP and the ACP schemes, the total energy consumption of the CBP scheme at each node is lower than that of ACP scheme (see Figure 11(b)). From Figures 11(a) and 11(b), it can be concluded that the CBP scheme has better performance with respect to total energy consumption (TEC) and average provenance size (APS). Figure 12(a) shows the average provenance size for the ACP and the CBP schemes with respect to the number of packets sent by data source nodes. In the simulations, there are 100 nodes; 30 of them are data source nodes and 5 of them are aggregator nodes. Figure 12(b) shows the average provenance size for the ACP and the CBP schemes with respect to the number of packets sent by data source nodes. In the simulations, there are 100 nodes; 30 of them are data source nodes and 10 of them are aggregator nodes. It can be concluded that as the number of packets sent by data source nodes increases, the average provenance sizes of the ACP and the CBP schemes increase too, but the average provenance size of the CBP scheme is less than that of the ACP scheme. Furthermore, in [1], it has been shown that the ACP scheme is better than the Bloom filter based provenance scheme (BFP) [9], the Generic secure provenance scheme (SPS) [20], and the MAC based provenance scheme (MP) [8]. The comparisons between the CBP scheme and the ACP scheme indirectly show that the CBP scheme outperforms the BFP, the SPS, and the MP schemes with respect to both the average provenance size and the energy consumption. As to the dictionary-based scheme (DP) [10], it has been compared with the ACP and the DBNP schemes in [11] and the results show that the DP scheme is sensitive to the WSN’s topology change, whereas the CBP scheme keeps stable when the WSN’s topology changes.
Wireless Communications and Mobile Computing
13 1×10⁶ Total energy consumption (mJ)
Average provenance size (byte)
12
10
8
6
4 0
2
4
6 8 10 Number of Hops
12
14
1×10⁶ 1×10⁶ 1×10⁶ 1×10⁶ 9×10⁵ 8×10⁵
0
ACP CBP
2
4
6 8 10 Number of Hops
12
14
ACP CBP (a)
(b)
18
20
16
18
Average provenance size (byte)
Average provenance size (byte)
Figure 11: (a) The relationship between the number of packet transmission hops and the average provenance size for the ACP and the CBP schemes. (b) The total energy consumption of the CBP and the ACP schemes with respect to the number of packet transmission hops.
14 12 10 8 6
0
20 40 60 80 100 Number of packets sent by data source nodes ACP CBP
16 14 12 10 8 6 0
20 40 60 80 100 Number of packets sent by data source nodes ACP CBP
(a)
(b)
Figure 12: (a) With 30 data source nodes and 5 aggregator nodes, the average provenance size for the ACP and the CBP schemes with respect to the number of sent packets. (b) With 30 data source nodes and 10 aggregator nodes, the average provenance size for the ACP and the CBP schemes with respect to the number of sent packets.
9. Experiments To further evaluate the performance of our scheme, we deployed the ACP and the CBP schemes in a test-bed which included 26 sensor motes. In the experiments, the performances were evaluated by the average provenance size only. 9.1. Experimental Setup. We used ZigBee sensor motes to port the implementation. The ZigBee mote used by us has a CC2530 microcontroller, 2.4GHz radio, 8KB RAM, and
256KB external flash for data logging (see Figure 13(a)). ZigBee motes are placed in an indoor environment in a grid topology with network areas of 20×10m2 (see Figure 13(b)). In addition, the equipment also includes the IAR compiler environment, the serial port view tool. The mote connecting to the laptop computer through a USB port is set as the BS. The I/O functions of the TinyOS simulation codes are modified and then ported to the ZigBee mote. The experiments are performed with more than 100 packets’ transmission in the WSN.
14
Wireless Communications and Mobile Computing
(a)
(b)
Figure 13: (a) Zigbee sensor motes. (b) The test-bed.
Average provenance size (byte)
12
both the provenance decoding and the data trust assessment. Furthermore, the optimal cluster size for the CBP scheme is formally derived. Both the simulation and the experimental results show the effectiveness and the efficiency of our CBP scheme in the paper.
10
8
Data Availability
6
4 0
2
4
6 8 10 Number of Hops
12
14
ACP CBP
Figure 14: The average provenance size for the ACP and the CBP schemes with respect to the number of packet transmission hops.
9.2. Experimental Results. In the test-bed experiments, Figure 14 shows the average provenance sizes for the ACP and the CBP schemes with respect to the number of packet transmission hops. The data show that the curves have similar trends compared with the simulation results in Figure 11(a), which also shows that the CBP scheme under the optimal clustering size can achieve a much higher average provenance compression rate than that of the ACP scheme.
All data generated and analyzed during this study are from our simulations and experiments, rather than public repositories online. The simulator we used is TinyOS 2.1.2 TOSSIM. The energy consumption is measured through PowerTOSSIMz. We submitted our simulation code of the ACP scheme and our scheme when we submitted our article. The experiment results are generated by porting the simulation code to the ZigBee sensor nodes. The major changes in the simulation code were related to the I/O functions.
Conflicts of Interest The authors declare no conflicts of interest regarding the publication of this paper.
Acknowledgments This work was supported by the National Natural Science Foundation of China under Grant 61672269 and the Jiangsu Provincial Science & Technology Project under Grant BA2015161.
10. Conclusions
Supplementary Materials
In a large-scale WSN, in order to mitigate the data provenances size’s rapid expansion, we propose a cluster-based arithmetic coding provenance scheme (CBP). Compared to the known provenance schemes based on arithmetic coding, the CBP scheme not only yields a higher provenance compression rate, but also can encode and decode the provenance incrementally at the BS, which increases the efficiencies of
The supplementary material file we submitted includes the simulation code of the ACP scheme and our scheme. Before running the code, TinyOS 2.1.2 should be installed in the Linux environment (the version of the Linux we use is Ubuntu) and some related configurations should be made. Almost all the configurations can be found on the Internet. We just mention some main code execution
Wireless Communications and Mobile Computing instructions. After entering the specified directory, execute “make micaz” and “make micaz sim” instructions. After that, execute “python test.py”. The simulation results will be stored in “log.txt” file. Execute “python postprocessZ.py -powercurses Energy.txt > EnergyPowerCurses.txt” when the PowerTOSSIMz is successfully configurated. The energy consumption results will be stored in “EnergyPowerCurses.txt” file. Before porting the simulation code to the ZigBee sensor nodes, the I/O functions should be changed according to the specific node type. (Supplementary Materials)
References [1] S. R. Hussain, C. Wang, S. Sultana, and E. Bertino, “Secure data provenance compression using arithmetic coding in wireless sensor networks,” in Proceedings of the 2014 IEEE International Performance Computing and Communications Conference (IPCCC), pp. 1–10, Austin, TX, USA, December 2014. [2] H. S. Lim, Y. S. Moon, and E. Bertino, “Provenance-based trustworthiness assessment in sensor networks,” in Proceedings of the 7th International Workshop on Data Management for Sensor Networks, pp. 2–7, ACM, 2010. [3] F. Zafar, A. Khan, S. Suhail et al., “Trustworthy data: A survey, taxonomy and future trends of secure provenance schemes,” Journal of Network and Computer Applications, vol. 94, pp. 50– 68, 2017. [4] W. Zhuo, Q. Fei, A. Narayan, A. Haeberlen, B. Loo, and M. Sherr, “Secure Network Provenance,” in Proceedings of the 23rd ACM Symposium on Operating Systems Principles, 2011. [5] W. Zhou, M. Sherr, T. Tao et al., “Efficient querying and maintenance of network provenance at internet-scale,” in Proceedings of the ACM SIGMOD International Conference on Management of data, pp. 615–626, ACM, 2010. [6] M. T. Goodrich, “Probabilistic packet marking for large-scale IP traceback,” IEEE/ACM Transactions on Networking, vol. 16, no. 1, pp. 15–24, 2008. [7] S. M. I. Alam and S. Fahmy, “Energy-efficient provenance transmission in large-scale wireless sensor networks,” in Proceedings of the IEEE International Symposium on a World of Wireless, Mobile and Multimedia Networks, WoWMoM ’11, pp. 1–6, IEEE, 2011. [8] S. Sultana, G. Ghinita, E. Bertino, and M. Shehab, “A lightweight secure scheme for detecting provenance forgery and packet dropattacks in wireless sensor networks,” IEEE Transactions on Dependable and Secure Computing, vol. 12, no. 3, pp. 256–269, 2015. [9] B. Shebaro, S. Sultana, S. R. Gopavaram et al., “Demonstrating a lightweight data provenance for sensor networks,” in Proceedings of the ACM conference on Computer and communications security, pp. 1022–1024, ACM, 2012. [10] C. Wang, S. R. Hussain, and E. Bertino, “Dictionary Based Secure Provenance Compression for Wireless Sensor Networks,” IEEE Transactions on Parallel and Distributed Systems, vol. 27, no. 2, pp. 405–418, 2016. [11] C. Wang and E. Bertino, “Sensor network provenance compression using dynamic bayesian networks,” ACM Transactions on Sensor Networks, vol. 13, no. 1, p. 5, 2017. [12] M. Guazzo, “A general minimum-redundancy source-coding algorithm,” Institute of Electrical and Electronics Engineers Transactions on Information Theory, vol. 26, no. 1, pp. 15–25, 1980.
15 [13] J. Ziv and A. Lempel, “A Universal Algorithm for Sequential Data Compression,” IEEE Transactions on Information Theory, vol. 23, no. 3, pp. 337–343, 1977. [14] J. Ziv and A. Lempel, “Compression of individual sequences via variable-rate coding,” Institute of Electrical and Electronics Engineers Transactions on Information Theory, vol. 24, no. 5, pp. 530–536, 1978. [15] X. Artigas, S. Malinowski, C. Guillemot, and L. Torres, “Overlapped quasi-arithmetic codes for distributed video coding,” in Proceedings of the 14th IEEE International Conference on Image Processing, ICIP 2007, pp. II9–II12, usa, September 2007. [16] S. Bandyopadhyay and E. J. Coyle, “An energy efficient hierarchical clustering algorithm for wireless sensor networks,” in Proceedings of the IEEE Societies 22nd Annual Joint Conference of the IEEE Computer and Communications (INFOCOM ’03), vol. 3, pp. 1713–1723, March-April 2003. [17] S. Madden, M. J. Franklin, J. M. Hellerstein, and W. Hong, “TAG: a tiny aggregation service for ad-hoc sensor networks,” ACM SIGOPS Operating Systems Review, vol. 36, no. SI, pp. 131– 146, 2002. [18] P. G. Howard and J. S. Vitter, “Arithmetic coding for data compression,” Proceedings of the IEEE, vol. 82, no. 6, pp. 857– 865, 1994. [19] I. H. Witten, R. M. Neal, and J. G. Cleary, “Arithmetic coding for data compression,” Communications of the ACM, vol. 30, no. 6, pp. 520–540, 1987. [20] R. Hasan, R. Sion, and M. Winslett, “The case of the fake picasso: preventing history forgery with secure provenance,” FAST, vol. 9, pp. 1–14, 2009.
International Journal of
Advances in
Rotating Machinery
Engineering Journal of
Hindawi www.hindawi.com
Volume 2018
The Scientific World Journal Hindawi Publishing Corporation http://www.hindawi.com www.hindawi.com
Volume 2018 2013
Multimedia
Journal of
Sensors Hindawi www.hindawi.com
Volume 2018
Hindawi www.hindawi.com
Volume 2018
Hindawi www.hindawi.com
Volume 2018
Journal of
Control Science and Engineering
Advances in
Civil Engineering Hindawi www.hindawi.com
Hindawi www.hindawi.com
Volume 2018
Volume 2018
Submit your manuscripts at www.hindawi.com Journal of
Journal of
Electrical and Computer Engineering
Robotics Hindawi www.hindawi.com
Hindawi www.hindawi.com
Volume 2018
Volume 2018
VLSI Design Advances in OptoElectronics International Journal of
Navigation and Observation Hindawi www.hindawi.com
Volume 2018
Hindawi www.hindawi.com
Hindawi www.hindawi.com
Chemical Engineering Hindawi www.hindawi.com
Volume 2018
Volume 2018
Active and Passive Electronic Components
Antennas and Propagation Hindawi www.hindawi.com
Aerospace Engineering
Hindawi www.hindawi.com
Volume 2018
Hindawi www.hindawi.com
Volume 2018
Volume 2018
International Journal of
International Journal of
International Journal of
Modelling & Simulation in Engineering
Volume 2018
Hindawi www.hindawi.com
Volume 2018
Shock and Vibration Hindawi www.hindawi.com
Volume 2018
Advances in
Acoustics and Vibration Hindawi www.hindawi.com
Volume 2018