marketing research, software engineering and management. This chapter ... Clustering is perhaps the most frequently used data mining algorithm, being useful in it's own .... seasonal, trending, noisy, nonlinear and chaotic. Let D = {d1, d2,...
Clustering Time Series Data: An Evolutionary Approach Monica Chiş, Soumya Banerjee, and Aboul Ella Hassanien
*
Abstract. Time series clustering is an important topic, particularly for similarity search amongst long time series such as those arising in bioinformatics, in marketing research, software engineering and management. This chapter discusses the state-of-the-art methodology for some mining time series databases and presents a new evolutionary algorithm for times series clustering an input time series data set. The data mining methods presented include techniques for efficient segmentation, indexing, and clustering time series. Keywords: Time series, clustering, evolutionary computation, evolutionary clustering.
1 Introduction Time series are an ordered sequence of values of a variable at equally spaced time intervals. Time series analysis is often associated with the discovery and use of patterns (such as periodicity, seasonality, or cycles), and prediction of future values (specifically termed forecasting in the time series context). One key difference between time series analysis and time series data mining is the large number of series involved in time series data mining. As shown in a vast volume of time series literature, traditional time series analysis and modeling tend to be based on non-automatic and trial-and-error approaches. It is very difficult to develop time series models using a non-automatic approach when a large number of time series are involved. To automatic model building, discovery of knowledge associated with events known or unknown a priori can provide valuable information toward the success of a business operation. Adding the time dimension to real-world databases produces Time Series Databases (TSDB) and introduces new aspects and difficulties to data mining and knowledge discovery. Monica Chiş SIEMENS Program and System Engineering (PSE) Romania Soumya Banerjee Department of Computer Science & Engineering, Birla Institute of Technology, International Center Mauritius Aboul Ella Hassanien Cairo University, Faculty of Computer and Information, Information Technology Department A. Abraham et al. (Eds.): Foundations of Comput. Intel. Vol. 6, SCI 206, pp. 193–207. springerlink.com © Springer-Verlag Berlin Heidelberg 2009
194
M. Chiş et al.
Time series arise in many important areas. Some of this areas are: the evolution of stock price indices, share prices or commodity prices, the sales figures for a particular good or service, macroeconomic and demographic indicators, image sequences, acceleration measurements by sensors on a bridge, ECG recordings (a test that records the electrical activity of the heart; with each heart beat, an electrical impulse travels through the heart) or EEG recordings (EEG recording shows rhythmical electrical activity, often called brain waves. The brain waves may be normal or show abnormalities in certain regions. In people with epilepsy, there may be "epileptic activity" on the EEG indicating their predisposition to seizures), gene expression measurements at consecutive time points in bioinformatics, are a part of the field in which time series play a very important role. Typically, the analysis of time series used on these areas is oriented to estimating a good model that can be used for monitoring, producing accurate forecasts, providing structural information and/or information about the influence of a particular set of inputs on the desired output. Time series data is perhaps the most frequently encountered type of data examined by the data mining community. Clustering is perhaps the most frequently used data mining algorithm, being useful in it’s own right as an exploratory technique, and also as a subroutine in more complex data mining algorithms such as rule discovery, indexing, summarization, anomaly detection, and classification [18] [24] [25 ] [26]. Clustering of time series has attracted the interest of researchers from a wide range of fields, particularly from statistics [31], signal processing [12] and data mining [28]. A survey of current research in the field has been published in [39]. This growth in interest in time series clustering has resulted in the development of a wide variety of techniques designed to detect common underlying structural similarities in time dependent data. The chapter is organized as follows. Section 2 presents the related works in time series clustering. In Section 3 the novel Evolutionary Time Series Clustering Algorithm (ETSC) is proposed. In Section 4 concludes the chapter and outlines some directions for future research in this direction.
2 Related Works: Time Series Clustering The mining of time series data has attracted great attention in the data mining community in recent years ([1], [6], [7], [18], [19] [33] [40]). Clustering time series is an important topic, motivated by several research challenges including similarity search of bioinformatics sequences, as well as the challenge of developing methods to recognize dynamic change in time series ([15], [17], [34], [42]). In the field of marketing research and management problem the clustering time series is a very important topic. The mining of time series in general and the clustering of time series in particular has attracted the interest of researchers from a wide range of fields, particularly from statistics [31], signal processing [12] and data mining [30]. According to Keogh et al. [18] there are two main categories in time series clustering: whole clustering and subsequence clustering. Whole clustering is the clustering performed on many individual time series to group similar series into clusters.
Clustering Time Series Data: An Evolutionary Approach
195
Subsequence clustering is based on sliding window extractions of a single time series and aims to find similarity and differences among different time window of a single time series. Subsequence clustering is commonly used as a subroutine in many other algorithms, including rule discovery [11, 13, 16], indexing, classification, prediction [35, 38], and anomaly detection [43]. One of the most widely used clustering approaches is hierarchical clustering; due to the great visualization power it offers [19]. Hierarchical clustering produces a nested hierarchy of similar groups of objects, according to a pair wise distance matrix of the objects. One of the advantages of this method is its generality, since the user does not need to provide any parameters such as the number of clusters. However, its application is limited to only small datasets, due to its quadratic (or higher order) computational complexity. In [7], [32] was presented k-Means time series clustering which is considered to be the faster method to perform clustering. The basic intuition behind k-Means (and in general, iterative refinement algorithms) is the continuous reassignment of objects into different clusters, so that the withincluster distance is minimized. For time-series, the objective is to find a representation at a lower dimensionality that preserves the original information and describes the original shape of the time-series data as closely as possible. Many approaches have been suggested in the literature, including the Adaptive Piecewise Constant Approximation [22], Piecewise Aggregate Approximation (PAA) [9, 46], Piecewise Linear Approximation [20] and the Discrete Wavelet Transform (DWT) [39]. All these approaches have shared the ability to produce a high quality reduced-dimensionality approximation of time series. Wavelets are unique in that their representation of data is intrinsically multi-resolution. A novel version of partition clustering for time series is presented in [29]. The algorithm works by leveraging off the multi-resolution property of wavelets. Initializing the centers at each approximation level, using the final centers returned by the coarser representations, mitigated the dilemma of choosing the initial centers. In addition to casting the clustering algorithms as anytime algorithms, this approach has two other very desirable properties. By working at lower dimensionalities the author can efficiently avoid local minima. The quality of the clustering is usually better than the batch algorithm. In addition, even if the algorithm is run to completion, the proposed approach is much faster than its batch counterpart. Empirically demonstrate these surprising and desirable properties with comprehensive experiments on several publicly available real data sets. The algorithms presented in [29] have used a wavelet decomposition to perform clustering at increasingly finer levels of the decomposition, while displaying the gradually refined clustering results periodically to the user. Any wavelet basis (or any other multiresolution decomposition such as DFT) can be used. Haar Wavelet was used because of its simplicity. The Haar Wavelet decomposition is computed for all time-series data in the database. The complexity of the transformation is linear to the dimensionality of each object; therefore, the running time is reasonable even for large databases. The process of decomposition can be performed off-line, and needs to be done only once. The time series data can be stored in the Haar
196
M. Chiş et al.
decomposition format, which takes the same amount of space as the original sequence. One important property of the decomposition is that it is a lossless transformation, since the original sequence can always be reconstructed from the decomposition. Once the Haar decomposition is computed, the k-Means clustering algorithm was performed, starting at the second level (each object at level i has 2(i-1) dimensions) and gradually progress to finer levels. Since the Haar decomposition is completely reversible, the approximation data can be reconstructed from the coefficients at any level and performs clustering on these data. Another categorization of clustering time series is the classification in model based or model free. Model based approaches (also called generative approaches) assume some form of the underlying generating process, estimate the model from each data then cluster based on similarity between model parameters. The most commonly assumed model forms are: polynomial mixture models [4]; [5] [41]; ARMA [18]; [45], Markov Chain and Hidden Markov Models (MC and HMM) [37]; [35]; [44]. Reviews of methods used to cluster time series can be found in [4]. Model free approaches involve the specification of a specific distance measure and/or a transformation of the data. Measures based on common subsequences (used in [10], shape parameters [27] and correlation [36] have been proposed. Transformations used in conjunction with time series data mining include fast Fourier transforms; dynamic time warping; wavelet transforms; and piecewise constant approximation. A large number of transformations are evaluated in [39]. In [3], Alcock and Manolopoulus instead of calculating the Euclidean distance directly between two sequences, the sequences are transformed into a feature vector and the Euclidean distance between the feature vectors is then calculated. Results show that this approach is superior for finding similar sequences. This is a different approach of time series similarity. One common feature of time series is the likely presence of outliers. These uncharacteristic data can significantly affect the quality of clusters formed. In [4] a method of overcoming the detrimental effects of outliers is evaluated. Some of the alternative approaches to clustering time series are described and a particular class of model for experimentation with k-means clustering and a correlation based distance metric are presented. In Singhal & Seborg [43] a new methodology based on calculating the degree of similarity between multivariate time-series datasets using two similarity factors for clustering multivariate time-series data is proposed. One similarity factor is based on principal component analysis and the angles between the principal component subspaces. The other similarity factor is based on the Mahalanobis distance between the datasets. The standard K-means clustering algorithm is modified to cluster multivariate time-series datasets using similarity factors. The author showed with some comparisons with existing clustering methods several advantages of the proposed method. Another approach of time series clustering is the use of evolutionary computation techniques in order to cluster the data. In Chiş and Groşan [8] a new evolutionary algorithms for hierarchical time series clustering is proposed. A linear chromosome for solution representation is presented in the chapter.
Clustering Time Series Data: An Evolutionary Approach
197
3 Evolutionary Time Series Clustering Algorithm (ETSC) Evolutionary algorithms are randomized search optimization techniques guided by the principles of natural biology evolution processes. They are effective and robust search processes provide a near optimal solution of a fitness function. Evolutionary algorithms play an important role in the various steps of data mining process. Evolutionary algorithms are used to improve the robustness and accuracy of the more traditional techniques used in feature extraction, feature selection, classification and clustering [32]. In this chapter a new evolutionary algorithms focused on whole clustering of time series, called Evolutionary Time Series Clustering- ETSC is presented. A time series is the simplest form of temporal data. A time series is a sequence of real numbers collected regularly in time, where each number represents a value. A general representation of time series is listed below as an ordered set of m realvalued variables:
Yt = x1 , ...., x m
(1)
Time series can be described using a variety of qualitative terms such as seasonal, trending, noisy, nonlinear and chaotic. Let D = {d1, d2,...,dp} be a time series data set with p the cardinality of the dataset. di is a time series with m real-valued. The dataset could be described in matrix as follows:
⎡ d 11 ⎢ D = ⎢ ... ⎢d1m ⎣
.... d p1 ⎤ ⎥ ... ... ⎥ ... d pm ⎥⎦
(2)
The purpose of the presented algorithm is to classify all time series from dataset D, with respect to a similarity measure. The individual length is equal to cardinality of classification data set, denoted by p. An individual is represented as a vector:
c = (c1 , ..., c p ) Where cj is an integer number from 1 to p. Representation indicates how time series are assigned to classes. The value cj of the gene j indicates the classes to which the object dj is assigned. All the times series for dataset are assigned to a class (cluster). The number of classes is determining by the evolutionary algorithms [8]. The first step when apply an evolutionary algorithm for solving a problem is to find a suitable representation for candidate solutions by finding a good representation for clustering time series dataset. The fitness function will be considered a similarity measure of time series. Two time series are considered similar if they have enough non overlapping time ordered subsequences that are similar. The two subsequences are considered to be similar if one is enclosed within
198
M. Chiş et al.
an envelope of a user defined width around another. Amplitude of one of the two sequences is scaled by a suitable amount to make the matching scale invariant. Given a set of time series sequences, there are two types of similarity search. Subsequence matching finds all the data sequences that are similar to the given sequence, while whole matching finds those sequences that are similar to one other. The following are some examples of the similarity queries: • • • • •
Identify companied with similar growth pattern. Determine products with similar selling patterns. Discover Stocks with similar movement in stock prices. Find if a musical score is similar to one of the copyrighted scores. Find portions of seismic waves that are not similar to spot geological irregularities.
Given two time series, a standard approach for similarity is to compute Euclidean distance. In order to support efficient retrieval and matching of time series, indexing of time series data is needed. An indexing structure [29] was proposed for fast similarity searches over time-series, when the data as well as query sequences were of the same length. Discrete Fourier Transformation (DFT) is used to map a time sequence to the frequency domain, the first few frequencies are retained and the retained frequencies are used to store the subsequences in the R* tree [47] structure, to create the index for efficient and fast search. This work was generalized [41] to allow subsequence matching. Data sequence could now be of different lengths and the query sequence could be smaller than any of the data sequence. This work has the following limitations for employing it in practical applications: • •
The problems of amplitude scaling and offset translation have not been addressed. The problem of ignoring unspecified portions of sequences while matching sequences is not addressed.
The above mentioned shortcomings are taken care in the technique proposed by Agrawal et.al [2]. According to the paper, two sequences are considered to be similar if they have enough non overlapping ordered pairs of subsequences that are similar. Amplitude of one of the two sequences is allowed to be scaled by any suitable amount and its offset adjusted. Let us consider A cluster (class) of k time series is considered A = {d1,…, dk}. Each series of the cluster has m real valued terms. Definition 1 The mean time series of the cluster A is denoted by M and is a time series with the real-valued M = M1, …, Mm where of this series are given by: k
Mj =
∑d i =1
k
ij
; j = 1,…, m
(3)
Clustering Time Series Data: An Evolutionary Approach
199
For each class detected by the evolutionary algorithms is calculated:
k
f nc (c) = ∑ i =1
m
m
m
j =1
j =1
j =1
m∑ d ij ⋅ M j −∑ d ij ⋅ ∑ M j 2 2 ⎡ m ⎛ m ⎞ ⎤ ⎡ m ⎛ m ⎞ ⎤ 2 2 ⎢m∑ d ij − ⎜ ∑ d ij ⎟ ⎥ ⋅ ⎢m∑ M j − ⎜ ∑ M j ⎟ ⎥ ⎜ ⎟ ⎜ ⎟ ⎥ ⎢⎣ j =1 ⎝ j =1 ⎠ ⎥⎦ ⎢⎣ j =1 ⎝ j =1 ⎠ ⎦
(4)
Where nc is the number of classes (the indices of classes) and k is the number of the time series in the class. The first approach of fitness function proposed for this algorithm is
F1 (c) =
ntotc
∑f
nc
(c )
(5)
nc =1
where ntotc is the number of classes The fitness function will be maximized. The mean of a cluster the mean of each term of the time series enter the cluster. We consider that if exist a similarity between a mean series of a time series dataset and all the series exist a similarity between series from dataset. The second approach for fitness function use for this algorithm is the distance between time series in the classes. For each class detected by the evolutionary algorithms is calculated: k
f nc (c) = ∑
k
∑d
i
−dj
(6)
i =1 j =i +1
where nc is the number of classes (the indices of classes) and k is the number of the time series in the class. The second fitness function used is: ntotc
F2 (c) = ∑ f nc (c)
(7)
nc =1
This second fitness function will be maximized. The fitness functions presented here are used in the algorithm. In case of series with the linear form the fitness F1 was used. In other cases F2 was used. The main steps of the evolutionary time series clustering algorithm are outlined below. Evolutionary Time Series Clustering Algorithm (ETSC) Step-1: Input: time series dataset; Step-2: Initialization: Initialize the population P(t). {Random initialization of the chromosome population} Step-3: For each chromosome in the population Do Step-3.1: Calculate de mean of classes for the entire chromosome in the population;
200
M. Chiş et al.
Step-3.2: Calculate the fitness function; Step-3.3: Apply selection for P(t). • {Let P1 be the set of the selected solutions. The best 50 % individuals from current population are copied into P(t+1). All individual from P(t) compete for solution. Individuals from P1 entering the mating pool based on tournament selection. Choose chromosomes from P1 to enter the mating pool}. Step 3.4: Apply the mutation operator to the solutions from the mating pool. Mutate solutions in P1 offspring enter the next generation P(t+1). Step:4: Output: Classes of time series
4 Experimental Results To show that our approach is useful for clustering time series and to see that the evolutionary algorithm are useful for time series clustering. A series of experiments on publicly available real datasets are performed.
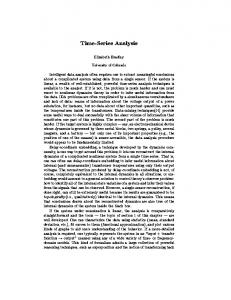
4.1 Data Description The data used are described below: • Dataset1: We use first for tested some dataset generated randomly. Four time series are represented in figure 1. These form the pattern for data set. Using the 4 patterns time-series as seeds, a variation of the original patterns by adding small deviations (2-3% of the series term). The final dataset is form for 44 time series, each time series has 12 terms (the number of months). Time series Dataset1 40.00
30.00
20.00
Value (um)
10.00
0.00 1
2
3
4
5
6
7
-10.00
-20.00
-30.00
-40.00 Time
Fig. 1 Time series dataset1
8
9
10
11
12
TS1 TS2 TS3 TS4
Clustering Time Series Data: An Evolutionary Approach
201
• Synthetic Control Chart Time Series (CC) [23]: This data consists of synthetically generated control charts. This dataset contains 600 examples of control charts synthetically generated.. There are six different classes of control charts: Normal, Cyclic, Increasing trend, Decreasing trend, Upward shift, Downward shift. The dataset has 60 period is one of the most used dataset for time series clustering. The following image shows ten examples from each class:
Fig. 2 Ten time series from each class of Synthetic Control Chart Time Series
• Cylinder Bell Funnel Data (CBF): This data set contains 300 series generated by implementing the Cylinder, Bell, and Funnel equations given in the UCR Time series Data Mining Archive [23]. • Trace dataset (Trace): this dataset contains the 4-class dataset with 200 instances, 50 for each class. The dimensionality of the data is 275 [23].
4.2 Algorithm Parameter The proposed algorithm is evaluated in terms of clustering quality and clustering efficiency. The parameters of evolutionary algorithms for algorithm are given in Table 1:
202
M. Chiş et al.
Table 1 Evolutionary algorithms parameters
W
Parameter Population Size Chromosome length Crossover probability Crossover type Mutation probability
Value
300
200
0.9
0.8
0.9
0.8
100 50 150 25 The cardinality of dataset 0.7 0.6 0.5 0.5 0.7
Uniform crossover 0.6 0.5 0.4
75
120
0.8
0.8
0.7
0.7
The population size is better to be small if the data series are very large.
4.3 Results Evaluation For data set 1 we obtained 4 classes. All the dataset generated from patterns time series are grouped together in the pattern class. The numbers of generation and the number of chromosome have increasing the possibility to find a better cluster structure. Fitness function F1 is better to use when the time series have linear trend. For Synthetic Control Chart Time Series after 15 runs we obtained 10, 12, and 8 classes. If the number of chromosome is very small the time series are not corrected clustered. The representation depends on the evolutionary algorithm parameters and the data from time series clustering. For Trace datasets the results are the best. After a number of 50 runs the dataset are clustered in 6-8 classes. Evaluating clustering systems could be done because clustering is an unsupervised learning process in the absence of the information of the actual partitions. We used classified datasets and compared how good the clustered results fit with the data labels, which are the most popular clustering evaluation method [16]. Three objective clustering evaluation criteria were used in our experiments: Jaccard, Rand and FM [16]. Consider G = G1 , G 2 , ..., G m as the clusters from a supervised dataset, and
A = A1 , A2 , ..., An as that obtained by a clustering algorithm under evaluations, in this case Evolutionary Time Series Clustering. Denote D as a dataset of original time series or features. For all the pairs of series d i , d j in D, we count the
(
)
following quantities: – – – –
a is the number of pairs, each belongs to one cluster in G and are clustered together in A. b is the number of pairs that are belong to one cluster in G, but are not clustered together in A. c is the number of pairs that are clustered together in A, but are not belong to one cluster in G. d is the number of pairs, each neither clustered together in A, nor belongs to the same cluster in G.
Clustering Time Series Data: An Evolutionary Approach
203
The used clustering evaluation criteria are defined as below: 1. Jaccard Score (Jaccard):
a a+b+c
(8)
a+d a+b+c+d
(9)
Jaccard = 2. Rand statistic (Rand):
Rand =
3. Folkes and Mallow index (FM):
FM =
a a ⋅ a+b a+c
(10)
All the used clustering evaluation criteria have value ranging from 0 to 1, where 1 corresponds to the case when G and A are identical. A criterion value is the bigger, the more similar between A and G. Each of the above evaluation criterions has its own benefit and there is no consensus of which criterion is better than other criteria in data mining community. Table 2 describes the mean of the evaluation criteria values of 100 runs for K-means with original data. In Table 2 , Table 3 and Table 4 we use the following notations: - CC is the Synthetic Control Chart Time Series data set; - CBF is the Cylinder Bell Funnel Data; - Trace is Trace dataset. Table 2 The mean of the evaluation criteria values obtained from 100 runs of K-means algorithm with the original data
Jaccard Rand FM
CBF 0.3490 0.6438 0.5201
CC 0.4444 0.8529 0.6213
Trace 0.3592 0.7501 0.5306
Table 3 gives the mean of the evaluation criteria values of 100 runs for Kmeans with extracted features. Table 3 The mean of the evaluation criteria values obtained from 100 runs of K-means algorithm with the extracted features
Jaccard Rand FM
CBF 0.3439 0.6447 0.5138
CC 0.4428 0.8514 0.6203
Trace 0.3672 0.7498 0.5400
204
M. Chiş et al.
Table 4 gives the mean of the evaluation criteria values of 100 runs for ETSC. Table 4 The mean of the evaluation criteria values obtained from 100 runs of ETSC
Jaccard Rand FM
CBF 0.3370 0.6500 0.5622
CC 0.4425 0.8512 0.6155
Trace 0.3655 0.7152 0.5510
5 Conclusions and Future Work An evolutionary approach to perform clustering on time series data set was presented. Some different fitness functions are tested. The future work will be in the application of this method to data from different domains (financial, biological) and to find another fitness function that increase the clustering accuracy. Some new fitness functions according to the time series theory will be explored after analyzing dataset new representation of the chromosome, another special genetic operator will be proposed.
References 1. Aggarwal, C., Hinneburg, A., Keim, D.A.: On the Surprising Behavior of Distance Metrics in High Dimensional Space. In: Proceedings of the 8th Int’l Conference on Database Theory, London, UK, January 4-6, pp. 420–434 (2001) 2. Agrawal, R., Faloutsos, C., Swami, A.: Efficient Similarity Search in Sequence Databases. In: Proceedings of the 4th Int’l Conference on Foundations of Data Organization and Algorithms, Chicago, IL, October 13-15, pp. 69–84 (1993) 3. Alcock, R.J., Manolopoulos, Y.: Time-Series Similarity Queries Employing a FeatureBased Approach. In: 7th Hellenic Conference on Informatics, Ioannina, Greece, August 27-29 (1999) 4. Bagnall, A.J., Janacek, G., Iglesia, B.D., Zhang, M.: Clustering time series from mixture polynomial models with discretised data. In: Proceedings of the second Australasian Data Mining Workshop, pp. 105–120 (2003) 5. Bar-Joseph, G., Gerber, D., Gifford, T.: Jaakkola, & Simon I. A new approach to analyzing gene expression time series data. In: Proceedings of The Sixth Annual International Conference on Research in Computational Molecular Biology (RECOMB), pp. 39–48 (2002) 6. Bradley, P., Fayyad, U.: Refining initial points for k-means clustering. In: Proceedings of the 15th International Conference on Machine Learning, Madison, pp. 91–99 (1998) 7. Bradley, P., Fayyad, U., Reina, C.: Scaling Clustering Algorithms to Large Databases. In: proceedings of the 4th Int’l Conference on Knowledge Discovery and Data Mining, New York, NY, August 27-31, pp. 9–15 8. Chiş, M., Grosan, C.: Evolutionary Hierarchical Time Series Clustering. In: Sixth International Conference on Intelligent Systems Design and Applications (ISDA 2006), pp. 451–455 (2006)
Clustering Time Series Data: An Evolutionary Approach
205
9. Chu, S., Keogh, E., Hart, D., Pazzani, M.: Iterative Deepening Dynamic Time Warping for Time Series. In: Proceedings of the 2002 IEEE International Conference on Data Mining, Maebashi City, Japan, December 9-12 (2002) 10. Das, G., Gunopulos, D., Mannila, H.: Finding similar time series. In: Principles of Data Mining and Knowledge Discovery, pp. 88–100 (1997) 11. Das, G., Lin, K., Mannila, H., Renganathan, G., Smyth, P.: Rule discovery from time series. In: Proceedings of the 3rd International Conference of Knowledge Discovery and Data Mining, pp. 16–22 (1998) 12. Dermatas, E., Kokkinakis, G.: Algorithm for clustering continuous density HMM by recognition error. IEEE Tr. On Speech and Audio Processing 4(3), 231–234 (1996) 13. Fu, T.K., Chung, F., Ng, C.M.: Financial Time Series Segmentation based on Specialized Binary Tree Representation (2004) 14. Gafeney, S., Smyth, P.: Curve clustering with random effects regression mixtures. In: Bishop, C.M., Frey, B.J. (eds.) Proceedings of the Ninth International Workshop on Artificial Intelligence and Statistics (2003) 15. Guralnik, V., Srivastava, J.: Event detection from time series data. In: Proceedings of the Fifth ACM SIGKDD International Conference on Knowledge Discovery and Data Mining, pp. 33–42 (1999) 16. Halkidi, M., Batistakis, Y., Vazirgiannis, M.: On clustering validation techniques. Journal of Intelligent Information Systems 17(2-3), 107–145 (2001) 17. Kalpakis, K., Gada, D., Puttagunta, V.: Distance measures for effective clustering of ARIMA time-series. In: Proceedings of the 2001 IEEE International Conference on Data Mining (ICDM 2001), pp. 273–280 (2001) 18. Keogh, E., Lin, J., Truppel, W.: Clustering of Time Series Subsequences is Meaningless: Implications for Past and Future Research. In : The 3rd IEEE International Conference on Data Mining, Melbourne, FL, USA, pp. 19–22 (2003) 19. Keogh, E., Pazzani, M.: An Enhanced Representation of Time Series Which Allows Fast and Accurate Classification, Clustering and Relevance Feedback. In: Proceedings of the 4th Int’l Conference on Knowledge Discovery and Data Mining, August 27-31, pp. 239–241 (1998) 20. Keogh, E., Kasetty, S.: On the need for time series data mining benchmarks: A survey and empirical demonstration. Data Mining and Knowledge Discovery 7(4), 349–371 (2003) 21. Keogh, E., Chakrabarti, K., Pazzani, M., Mehrotra, S.: Locally Adaptive Dimensionality Reduction for Indexing Large Time Series Databases. In: Proceedings of ACM SIGMOD Conference on Management of Data, Santa Barbara, CA, pp. 151– 162 (2001) 22. Keogh, E., Xi, X., Wei, L., Ratanamahatana, C.A.: The UCR Time Series Classification/Clustering Homepage: knowledge discovery, pp. 2–11. ACM Press, New York (2003), http://www.cs.ucr.edu/~eamonn/time_series_data/ 23. Keogh, E., Smyth, P.: A probabilistic approach to fast pattern matching in time series databases. In: Proceedings of the 3rd International Conference of Knowledge Discovery and Data Mining, pp. 24–20 (1997) 24. Keogh, E., Chu, S., Hart, D., Pazzani, M.: Segmenting Time Series: A Survey and Novel Approach. In: an Edited Volume. Data Mining in Time Series Databases. Published by the World Scientific Publishing Company (2003)
206
M. Chiş et al.
25. Korn, F., Jagadish, H., Faloutsos, C.: Efficiently Supporting Ad Hoc Queries in Large Datasets of Time Sequences. In: Proceedings of the ACM SIGMOD Int’l Conference on Management of Data, Tucson, AZ, May 13-15, pp. 289–300 (1997) 26. Kosmelj, K., Batagelj, V.: Cross-sectional approach for clustering time varying data. Journal of Classification 7, 99–109 (1990) 27. Lin, J., Keogh, E., Lonardi, S., Chiu, B.: A symbolic representation of time series, with implications for streaming algorithms. In: Proceedings of the 8th ACM SIGMOD workshop on Research issues in data mining and knowledge discovery, pp. 2–11. ACM Press, New York (2003) 28. Lin, J., Vlachos, M., Keogh, E., Gunopulos, D.: Iterative Incremental Clustering of Time Series. In: Bertino, E., Christodoulakis, S., Plexousakis, D., Christophides, V., Koubarakis, M., Böhm, K., Ferrari, E. (eds.) EDBT 2004. LNCS, vol. 2992, pp. 106– 122. Springer, Heidelberg (2004) 29. Lin, J., Keogh, E., Lonardi, S., Chiu, B.: A symbolic representation of time series, with implications for streaming algorithms. In: Proceedings of the 8th ACM SIGMOD workshop on Research issues in data mining and knowledge discovery, pp. 2–11. ACM Press, New York (2003) 30. Maharaj, E.A.: Clusters of time series. Journal of Classification 17, 297–314 (2000) 31. MacQueen, J.: Some Methods for Classification and Analysis of Multivariate Observation. In: Le Cam, L., Neyman, J. (eds.) Proceedings of the 5th Berkeley Symposium on Mathematical Statistics and Probability, Berkeley, CA, vol. 1, pp. 281– 297 (1967) 32. Michalewicz, Z.: Genetic Algorithm + Data Structure = Evolutionary Programs. Springer, Berlin (1992) 33. Murthy, C.A., Chowdhury, N.: In search of optimal clusters using genetic algorithm. Pattern Recognition Letters 17(8), 825–832 (1996) 34. Oates, T., Firoiu, L., Cohen, P.R.: Using dynamic time warping to bootstrap HMMbased clustering of time series. In: Sun, R., Giles, C.L. (eds.) IJCAI-WS 1999. LNCS, vol. 1828, pp. 35–52. Springer, Heidelberg (2001) 35. Ormerod, P., Mounfield, C.: Localised structures in the temporal evolution of asset prices. In: New Approaches to Financial Economics. Santa Fe Conference (2000) 36. Park, S., Kim, S.W., Chu, W.W.: Segment-Based Approach for Subsequence Searches in Sequence Databases. In: Proceedings of the 16th ACM Symposium on Applied Computing (2001) 37. Piccolo, D.: A distance measure for classifying ARIMA models. Journal of Time Series Analysis 11(2), 153–164 (1990) 38. Popivanov, I., Miller, R.J.: Similarity Search over Time Series Data Using Wavelets. In: Proceedings of the 18th Int’l Conference on Data Engineering, San Jose, CA, Feburary 26-March 1, pp. 212–221 (2002) 39. Ramoni, M., Sebastiani, P., Cohen: Bayesian clustering by dynamics. Machine Learning 47(1), 91–121 (2002) 40. Ranganathan, M., Faloutosos, C., Manolopoulos, Y.: Fast subsequence matching in time-series databases. In: Proc. of the ACM SIGMOD Conference on Management of Data (May 1994) 41. Sarker, B.K., Mori, T., Uehara, K.: Parallel Algorithm for Mining Association in time Series Data. CS24-2002-1 Tech. report (2002) 42. Singhal, A., Seborg, D.E.: Clustering multivariate time-series data. Journal of Chemometrics 19, 427–438 (2005)
Clustering Time Series Data: An Evolutionary Approach
207
43. Steinback, M., Tan, P.N., Kumar, V., Klooster, S., Potter, C.: Temporal Data Mining for the Discovery and Analysis of Ocean Climate Indices. In: The 2nd Workshop on Temporal Data Mining, at the 8th ACM SIGKDD International Conference on Knowledge Discovery and Data Mining. Edmonton, Alberta, Canada, July 23 (2002) 44. Tong, P., Dabas, H.: Cluster of time series models: An example. Journal of Applied Statistics 17, 187–198 (1990) 45. Yi, B., Faloutsos, C.: Fast Time Sequence Indexing for Arbitrary Lp Norms. In: Proceedings of the 26th Int’l Conference on Very Large Databases, Cairo, Egypt, September 10-14, pp. 385–394 (2000); Database Management, Berlin, Germany, Jul 26-28, pp 55–68 46. Zhang, H., Ho, T.B., Lin, M.S.: An evolutionary K-means algorithm for clustering time series data. In: ICML 2004 (2004)