CLUSTERING OF TIME SERIES USING A HIERARCHICAL LINEAR DYNAMICAL SYSTEM Goktug T. Cinar and Jose C. Principe Computational NeuroEngineering Laboratory (CNEL) University of Florida, Gainesville, FL, 32611 USA e-mail:
[email protected],
[email protected] ABSTRACT The auditory cortex in the brain does effortlessly a better job of extracting information from the acoustic world than our current generation of signal processing algorithms. Abstracting the principles of the auditory cortex, the proposed architecture is based on Kalman filters with hierarchically coupled state models that stabilize the input dynamics and provide a representation space. This approach extracts information from the input and self-organizes it in the higher layers leading to an algorithm capable of clustering time series in an unsupervised manner. An important characteristic of the methodology is that it is adaptive and self-organizing, i.e. previous exposure to the acoustic input is the only requirement for learning and recognition, so there is no need of selecting the number of clusters. Index Terms— Music information retrieval, kalman filters, dynamical systems, hierarchical systems, clustering, time series 1. INTRODUCTION Clustering of time series is a challenging problem compared to its counterpart on static data sets. Therefore considerable amount of work have been conducted on this area. In [1] Liao surveys the current state of the art. Most of the current work either modifies the distance measures used in clustering of static data to work on time series or extracts features from time series and applies methods of static data clustering on them. Our approach falls under the subgroup that uses modelling techniques to cluster time series as will be explained below. Our approach is substantially different from the majority of the methods dealing with clustering of time series because it takes advantage of the temporal information buried in the temporal structure of time series. The signal processing and machine learning communities do not favor state space models and dynamical systems. This could be a poor decision when working on sensory stimulus. The reason is plain and simple, the stimuli is rich in terms of context at a given time (spatial information); however considerably large amount of information lies in the temporal behavior of the sensory input [2]. This is even more important when working with auditory stimuli, as we are working with a one-dimensional signal, most of the information can be gathered by analyzing the temporal structure. Therefore the bag of audio features representation, which is a common approach in music information retrieval, is fundamentally limited by ignoring the time dependency between feature vectors [3]. We know that the auditory pathway in the human cortex is a fairly complicated structure. Lots of attempts have been made to This work is supported by the Office of Naval Research (ONR) grant #N000141010375.
model the auditory perception [4]. It will be fair to state that most of the work concentrated on the modeling of cochlea and the auditory nerves linking to the basilar membrane in the cochlea. An important question should be asked by the researchers in this field: What are good features for sensory processing? The answer is not clear and we almost exclusively keep using the sensory space to find them. This may not be the best approach due to the complexity and variability of the sensed signals (changes in timbre, tone, noise, context), while we need invariants. On the other hand, biological organisms have solved this problem long ago by developing an active perception mechanism. This can be summarized by the phrase: We hear/see what we want to hear/see; i.e. our brain disambiguates the sensory signals according to our expectations. The biological inspirations to build our model are limited and are restricted to guidelines The model should have a hierarchical structure to represent the layered structure of the auditory cortex. It should have the ability to be (directly or indirectly) driven top-down by causes to mimic active perception. Therefore we will concentrate on Hierarchical Linear Dynamica Systems (HLDS). • We propose a new HLDS model that consists of one observation layer and multiple hidden state layers. Each hidden state layer acts as the driving input/cause to the layer below it, with only the lowest layer relating to the observations via a linear model. We enforce a local centriptic behavior on the highest hidden state layer which creates a clamping effect that stabilizes the trajectories of the hidden states, thus creating clusters (resembling the Hopfield networks) in the state space of highest hidden layer. • The cluster centers will form invariant representations for musical data. We demonstrate that the model creates clusters for each musical note played by an instrument and is not affected by dynamics in amplitude (such as crescendo and decrescendo) and changes in rhythm. 2. HIERARCHICAL LINEAR DYNAMICAL SYSTEM It is a common belief that the cortex is stereotyped in hierarchical layers and internal organization [5]. This is the main motivation for choosing a Hierarchical Linear Dynamical System. The idea of a nested HLDS is to design a model that would consist of one measurement equation and multiple state transition equations. The system is nested in the sense that each state transition equation creates the causes/states that would drive the lower layer. This introduces a top-down flow of information. In the nested HLDS we drive the system bottom-up by the observations, and top-down by the states. The governing equations of the nested HLDS are:
zt ut xt yt
= = = =
zt−1 + pt Gut−1 + Dzt−1 + rt F xt−1 + But−1 + wt Hxt + vt
into the liquid filling the cochlea. Literature is full of papers showing gammatone filters as reliable models for cochlear filters [9], [10]. Therefore gammatone filters are used in the first layer. The nth order Gammatone filters are defined using the following formula: (1)
where yt ∈ R is the observation vector. xt ∈ R is the first layer hidden states, ut ∈ Rk is the second layer hidden states, and zt ∈ Rs is the third layer hidden states where n > k > s so that the dimensionality decreases in each layer as we go up in the hierarchy. The motivation is to restrict the states in to smaller representation spaces to be used in clustering. In other words, we want the model’s representation to expand as we go down the hierarchy. The model is shown to work with a wide range of model sizes in Section 3. In these equations, pt , rt , wt , vt are zero mean Gaussian uncertainties. The covariance matrices of these uncertanties are defined as αm Im , αn In , αk Ik , αs Is respectively where Im is an identity matrix of dimension m × m. The reader should note that we impose a fixed point behavior (i.e. identity state transition) in the highest layer of the hierarchy. This combined with the locally stationary behavior of music signals imposes a stable behavior throughout the hierarchy as each layer is driven by the one above it. It is intuitive to think that even if slightly larger changes occur in the observations, the changes in the higher layers should be much slower. This should result in creating clusters in the state space that zt ∈ Rs exists. m
g(t) = atn−1 e−2πbt cos(2πf t + ϕ)
(4)
n
2.1. State Estimation in Joint Space We can re-write the nested dynamics defined in (1) as follows: ˜ t = F˜ X ˜ t−1 + W ˜t X
(2)
˜X ˜ t + vt yt = H
(3)
zt I 0 0 ˜ t = ut , F˜ = D G 0 , where X xt 0 B F pt [ ] ˜ ˜ H = 0 0 H , Wt = rt wt The equations (2) and (3) tells us that there is a joint state-space where we can do the estimation of all the hidden states in all the layers simultaneously. This enables the use of the standard estimation equations of the Kalman Filter [6] for this joint state space model. 2.2. Parameter Learning We learn the parameters simultaneously while inferring the states of the HLDS. This is known as sequential estimation ( [7], [8]), where we consider two dual systems with the same observation. The idea is as simple as switching the roles[of the]parameters and states, where ˜ H and treat them as states. We we vectorize the parameters in F, consider identity state transition for parameter dynamics. This dual system usually suffers from very high dimensionality. Thus a common practice is to neglect the second order statistics and reduce the computational cost in exchange for sub-optimal behavior. We explain a parallelization method in Section 2.3, which enables us to avoid the high dimensionality and propagate second order statistics as well; without any loss of optimality. We know that the auditory processing starts with the air pressure being transmitted to the ear drum, and then the motion is translated
where n is the filter order, t is time, a is amplitude, b is the filter bandwith. ϕ is the phase shift, and f is the center frequency. Equivalent Rectangular Bandwith (ERB) is calculated using the following formula [11], [12]: b = 0.108f + 24.7; (5) For these reasons, we decide to use gammatone filters in the measurement matrix (H). We create 4th order gammatone filters in the range from 10Hz to fs /2 (where fs is the sampling frequency of the recordings we use). We place center frequencies half an ERB apart, to get a denser coverage in the frequency domain. 2.3. Parallelization of Parameter Learning One of the bottlenecks of this algorithm is the parameter learning. The dual system for the parameters requires very high dimensional systems. However when looked at the propagated error covariance matrix, one will notice that there is no cross covariance between the rows of each parameter matrix. The reason for having no cross covariance is trivial: when we consider the dual system for parameter estimation each entry of the observation vector is generated by the inner product of the whole state vector and the corresponding row of the matrix. Thus the remaining rows do not have any effect on the particular entry of the observation vector, so the parallelization can be done with no loss and without any approximation. In addition the state transition matrix for the dual system is an identity matrix. All these properties result in having no cross covariance between the rows of the matrices while doing parameter estimation.
f1 b1 f b Fn×n = 2 Bn×k = 2 ... ... fn bn 1 1 ut xt u2t x2t (u ) = (xt )n×1 = ... t k×1 ... n xt ukt
where fi , hi ,bi is the ith row of the corresponding matrix, yti is the ith element in the observation vector (similarly for xit ). To learn the values in F and B consider the following system: θt = θt−1 + wtθ ]T [ xt−1 θt + vtθ xit = ut−1
[ where
θt =
fiT bTi
]
The high dimensionality of the parameter space was keeping us from propagating the error covariance of parameter estimation. Now with these parallel but much smaller systems the propagation can be done easily. This re-organization saves us a lot of memory space and computation (e.g. inverses of the much smaller matrices). The same initialization explained above is used for the dual systems estimating the parameters. A common problem in applying the sequential estimation is the degenerate solution as t → ∞,w ˆ t → ∞ and xt → 0. To avoid this solution we force each column of the w = [F, H, D, B, G] matrices to have unit norm. Therefore after each update, the values
Table 1. Pitch estimation accuracy of the algorithm in presence of different levels of noise. Dimensions of the model are s=3, k=10, n=60. 35 dB SNR 21 dB SNR 15 dB SNR 7 dB SNR -5 dB SNR Pitch estimation Accuracy using the Convergence Criterion
98.49%
97.73%
91.68%
39.04%
6.22%
Pitch estimation Accuracy using all Time Instances
93.54%
92.90%
87.33%
37.50%
6.15%
of each column are normalized such that the column has unit norm. Equation (6) shows the constraint we enforce. ∥Ft (., j)∥ = 1
∀j
(6)
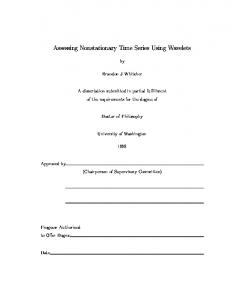
3. EXPERIMENTAL RESULTS The model is capable of working both on time domain observations and on frequency domain observations. In this paper, we will work in the frequency domain. Therefore our observation sequences will be single-sided magnitude spectrum of the audio signals; we will not work with the phase of the spectrum. The audio signal will be windowed using a L-point symmetric Hanning window. The length of the window will be selected such that each window will contain about 80-100ms of data. The windows will have 50% overlap. Each window of data will be normalized to a fixed maximum amplitude before the FFT is computed. In this experiment we use the audio samples from The University of Iowa Musical Instrument Samples [13]. All the instrument recordings that are used in this work are recorded in an anechoic chamber. A Neumann KM 84 Cardioid microphone is used at a distance of 5 feet. The mono recordings are sustained notes of around 2 seconds sampled at 44.1 kHz with 16-bit resolution. In our work the recordings have been downsampled to 11025 HZ mono so that the window size for the FFT would be reasonable. We used concatenated notes in the range E3-D6 for the non-vibrato B-sharp Trumpet to train and test the HLDS. We use a 1024 point FFT to create the observation vectors from each window of data. As we use the single sided amplitude spectrum, the length of our observation vector is 512 (m=512). We present each observation vector multiple times to speed up convergence to the clusters. We have n=60 states in the first layer (the number of filters needed to cover the frequency range placed half an ERB apart), k=10 (chosen heuristically) states in the second layer and s=3 (for visaualization purposes) state in the third layer. We use 0.01 · I(n+k+s)×(n+k+s) as the covariance matrix of the joint state transition equation (2) uncertainty; and 0.5 · Im×m as the covariance matrix of the joint measurement equation (3) uncertainty. Once the training is completed the parameters are fixed and the system is tested with trumpet notes. Figure 1 shows the point clusters ‘on action’. We picked three random notes from our dataset, and played them consecutively creating every possible transition between notes. We see that there is a transition phase before the states converge around the cluster. The system usually reaches the neighborhood of the cluster within a few (3-6) iterations. We can clearly see that whatever the initial states are, they converge to the particular clusters when a certain note is played. The transients are shown to give a better understanding of the role of ‘dynamics’ in this task. We can see that there are certain routes/angles that the attractors are approached by the states. 3.1. Supervised Monophonic Pitch Estimation For pitch estimation using the clusters in the highest layer, we need to label cluster centers for each note. Therefore to determine the cluster centers we present the notes one-by-one to the system with
Fig. 1. The response of the 3rd layer hidden states to a subset of the trumpet notes. The transients are shown. All possible transitions between the three notes are shown. its parameters fixed. As the transition phase between the notes is considerably short, we do not bother eliminating the transition phase while determining the cluster centers. We find the mean value for the highest layer states for all time instances, and assign this value as the cluster center. To assess the classification accuracy we do Monte Carlo runs through all 35 notes. In each run the notes are presented in a different order. At each time instant the states are compared to the cluster centers for each note. The closest center is assigned as the label. When a new note is presented we create a window or ‘memory’ of instantaneous labels. We then check if the same decision was given by the system for all time instances in the memory. When the unanimous decision is given for the window, convergence is declared. The memory size should be decided with care as too long of a memory would prevent us from recognizing notes that are played for a short duration. On the other had too short of a memory can signal wrong convergence. We use a memory of 4 instantaneous labels. We do the test with different levels of white noise added to the notes. The results are summarized in Table 1. In Table 3 we compare our results to the leading pitch estimation algorithms and k-Means clustering with number of seeds equal to the number of notes; and show that we outperform the state-of-the-art presented in [14], [15]. As training/testing of the model takes extensive amount of time we run Monte Carlo tests on a single model with s = 3 dimensions in the third layer and k = 10 dimensions in the second layer. We randomly initialize the parameters and train 100 different models (notes are presented in random order for training of each model). We then proceed and use the same methodology to determine the classification accuracy of the models with or without using our convergence criterion. The five best and five worst results are not considered for the results presented here. The mean classification accuracy of the remaining 90 models is 85.00% without using the convergence criterion and is 92.17% when we use the convergence criterion. 66 out of 90 models perform over 90% classification accuracy.
Table 2. Pitch estimation accuracy of the algorithm for different second and third layer dimensions (s,k,n=60) using the convergence criterion. HH s 2 3 4 5 6 7 8 k HH H 10
91.80%
96.94%
98.57%
98.65%
99.09%
98.41%
96.48%
12
91.19%
89.39%
96.25%
86.42%
94.28%
99.38%
99.19%
13
86.70%
97.07%
97.94%
97.69%
98.12%
98.82%
82.12%
Table 3. The table shows performance of the state-of-the-art methods on pitch estimation of isolated notes. k-Means YIN SWIPE’ HLDS Time Domain (35 seeds) HLDS 87.62%
93.71%
95.45%
96.61%
98.73%
Different model sizes are also tested with a single trained model. Accuracy is still assessed using Monte Carlo tests where the notes are randomly presented to the model and classified. The results are summarized in Table 2. We can see that the model works for a wide range of model sizes and consistently performs over 90%. There are results where unusually low classification accuracy is observed. This optimization has inifinitely many solutions as we simultaneously estimate the states and learn the parameters. In such cases the model should be reinitialized and trained to obtain better results. 4. DISCUSSION AND CONCLUSION This paper shows that we have successfully formed a hierarchical model that extracts information and self-organizes this extracted information in its higher layers. This self organization leads to an algorithm capable of clustering time series in an unsupervised manner. This is substantially different from the majority of the methods dealing with clustering of time series as they do not take advantage of the temporal information. Most of the current work either modifies the distance measures used in clustering of static data to work on time series or extracts features from time series and applies methods of static data clustering on them [1]. Here we simply take advantage of the internal dynamics of the presented signals and exploit them to embed the time series in smaller subspaces. When we look at the equations, we can notice that there is an observable subspace for each layer of states given an observation vector. As we impose stationary behavior on the top layer, each observation vector and its neighborhood would correspond to a local subspace in the top layer. This can also be observed when we focus on the top-down influence. If we consider a step function input zstep at the third layer, the steady state response in the second layer will be as follows: ∞ ∑ u=( Gi )Dzstep (7) i=0
if f
u = (I − G)−1 Dzstep |λj | < 1 ∀j = 1, .., k
(8)
Therefore, given the eigenvalues of G are all less then one in magnitude (which is guaranteed by a stable system), the steady state response is given by (I −G)−1 Dzstep . This tells us that the model is embedding the small dimensional subspace where a particular cluster exists in top layer into the lower layer via this linear transformation. The same analysis would follow in identical manner for the lower layer. Therefore although this hierarchical model is equivalent to a conventional linear dynamical system, the way the model is trained creates different parameters from the conventional model
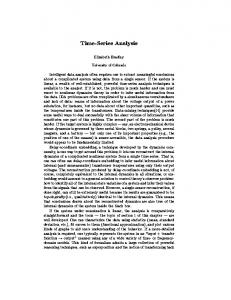
Fig. 2. Response of HLDS to variations of the same motif. trained with the Kalman filter applied to the same data. This work is the first step in building a bigger model that can extract information on different time scales. With this initial building block we gather information about the note that is played and the transitions between notes. Our plan is to duplicate same framework to work on the output of this layer. The western music consists of a hierarchical structure that starts with a note, followed by a group of notes forming motifs, and different motifs tied together forming themes. We created the famous first motif in Beethoven’s 5th Symphony using the trumpet notes we have. We repeatedly presented this motif to a trained model with different variations such as dynamical amplitude variations (crescendo or decrescendo) and tempo. We noticed that the same trajectory was followed in the state space of the highest layer (Figure 2). Our goal is to capture these hierarchical structures by forming further hierarchies using the HLDS framework. Possible uses can be music segmentation as in [3], and more challenging tasks of song identification, genre identification or artist identification (using salient features that can be found in different compositions of a given artist). The model will be further investigated in the future regarding its generalization property, performance on songs, and model size selection. Due to our use of a linear system the computational burden is reasonable. The algorithm takes ≈ 11.62 ms to estimate the states for each window (s=3, k=10, n=60). This grows linearly with the number of reiterations over the same window of data. Usually we reiterate 4 times over each window of new thus the computation time for each window is ≈ 46.47 ms. As parameters are fixed after learning, the algorithm can work almost real time (each window contains ≈ 36.30 ms of new data). (The algorithm is tested in MATLAB R2011b, using Intel Core i5-2320 3.0GHz CPU with 6GB RAM)
5. REFERENCES [1] T Warren Liao, “Clustering of time series dataa survey,” Pattern Recognition, vol. 38, no. 11, pp. 1857–1874, 2005. [2] Stephen Handel, Listening: An Introduction to the Perception of Auditory Events, MIT Press, Cambridge, MA, 1993. [3] L. Barrington, A.B. Chan, and G. Lanckriet, “Modeling music as a dynamic texture,” Audio, Speech, and Language Processing, IEEE Transactions on, vol. 18, no. 3, pp. 602–612, 2010. [4] A.S. Bregman, Auditory scene analysis: The perceptual organization of sound, The MIT Press, 1994. [5] H.L. Read, J.A. Winer, and C.E. Schreiner, “Functional architecture of auditory cortex,” Current opinion in neurobiology, vol. 12, no. 4, pp. 433–440, 2002. [6] R.E. Kalman et al., “A new approach to linear filtering and prediction problems,” Journal of basic Engineering, vol. 82, no. 1, pp. 35–45, 1960. [7] Alex Nelson, Nonlinear estimation and modeling of noisy time-series by dual Kalman filtering methods, Ph.D. thesis, Oregon Graduate Institute of Science and Technology, 2000. [8] V. Panuska, “A new form of the extended kalman filter for parameter estimation in linear systems with correlated noise,” Automatic Control, IEEE Transactions on, vol. 25, no. 2, pp. 229–235, 1980. [9] E. Smith and M.S. Lewicki, “Learning efficient auditory codes using spikes predicts cochlear filters,” Advances in Neural Information Processing Systems, vol. 17, pp. 1289–1296, 2005. [10] Evan C Smith and Michael S Lewicki, “Efficient auditory coding,” Nature, vol. 439, no. 7079, pp. 978–982, 2006. [11] B.R. Glasberg and B.C.J. Moore, “Derivation of auditory filter shapes from notched-noise data,” Hearing research, vol. 47, no. 1-2, pp. 103–138, 1990. [12] B.C.J. Moore and B.R. Glasberg, “Suggested formulae for calculating auditory-filter bandwidths and excitation patterns,” J. Acoust. Soc. Am, vol. 74, no. 3, pp. 750–753, 1983. [13] University of Iowa Electronic Music Studios , “Musical instrument samples,” http//:theremin.music.uiowa. edu/, 1997, [Online; accessed 24-April-2012]. [14] Alain De Cheveign´e and Hideki Kawahara, “Yin, a fundamental frequency estimator for speech and music,” The Journal of the Acoustical Society of America, vol. 111, pp. 1917, 2002. [15] Arturo Camacho and John G Harris, “A sawtooth waveform inspired pitch estimator for speech and music,” The Journal of the Acoustical Society of America, vol. 124, pp. 1638, 2008.