ESANN'2007 proceedings - European Symposium on Artificial Neural Networks Bruges (Belgium), 25-27 April 2007, d-side publi., ISBN 2-930307-07-2.
Clustering Using A Genetic Algorithm Combining Validation Criteria Murilo Coelho Naldi and Andr´e C. P. L. F. de Carvalho.
∗
Laborat´ orio Inteligˆencia Computacional. Instituto de Ciˆencias Matem´ aticas e Computa¸c˜ ao - USP. Av. Trabalhador S˜ ao-carlense, 400 - Centro. Caixa Postal: 668 - CEP: 13560-970 - S˜ ao Carlos - SP - Brazil.
[email protected],
[email protected]. Abstract. Clustering techniques have been a valuable tool for several data analysis applications. However, one of the main difficulties associated with clustering is the validation of the results obtained. Both clustering algorithms and validation criteria present an inductive bias, which can favor datasets with particular characteristics. Besides, different runs of the same algorithm using the same data set may produce different clusters. In this work, traditional clustering and validation techniques are combined with a Genetic Algorithm (GA) to build clusters that better approximate the real distribution of the dataset. The GA employs a fitness function that combines two validation criteria. Such combination allows the GA to improve the evaluation of the candidate solutions. Furthermore, this combined approach avoids the individual weaknesses of each criterion. A set of experiments are run to compare the proposed model with other clustering algorithms, with promising results.
1
Introduction
Clustering is based on an inductive principle where patterns within a cluster are more similar to each other then patterns belonging to different clusters. This inductive principle is known as the objective function of the clustering technique and its association with a dataset creates an optimization problem [1]. Several clustering algorithms have been proposed in the literature and applied to a wide range of problems. To evaluate the performance of an algorithm, and allow its comparison with other algorithms, it is essential to adopt a validation criterion. In this paper, we propose a GA that combines two known clustering validation criteria, silhouette [2] and VRC [3], to evaluate the population of solutions evolved by a GA. This combination enables the GA to evaluate a larger portion of the search space of possible clusters, improving the evaluation of solutions and increasing the chances of finding a suitable partition. The elements in each cluster of the initial population of the GA are randomly defined. After the evolutionary process, k-means is applied to fine tune the individuals in the final population. Experimental results suggest that the proposed approach can produce clusters closer to the known structure of the dataset than those produced by other investigated approaches. ∗ supported
by CNPq and Fapesp.
139
ESANN'2007 proceedings - European Symposium on Artificial Neural Networks Bruges (Belgium), 25-27 April 2007, d-side publi., ISBN 2-930307-07-2.
This paper is organized as follows. Sections 2 and 3 describe the validation criteria employed in this work, silhouette and variance ratio criterion, respectively. The proposed approach is presented in Section 4. The experiments carried out and their results are covered in Section 5. Section 6 concludes the paper.
2
Silhouette
The silhouette criterion, or measure, is based on the distance or dissimilarity between patterns belonging to the same cluster and the distance between patterns from one cluster and their closest pattern belonging to a different cluster [2]. As an example, consider a pattern i belonging to cluster A. The average distance between i and all other objects of A is denoted by a(i). Let C be another cluster. The average distance between i and all objects of cluster C is denoted by d(i, C). After computing d(i, C) for all clusters C 6= A, the smallest value, b(i), is selected, where b(i) = min d(i, C)∀C 6= A. Thus, the silhouette value for a pattern i is given by: 1 − a(x)/b(x), a(x) < b(x) 0, a(x) = b(x) (1) s(x) = b(x)/a(x) − 1, a(x) > b(x) It is easy to observe that −1 ≤ s(i) ≤ 1. This measure works better with hiperspherical, compact and disjoint clusters [2]. Since this measure favors clusters with highest similarity between patterns, it is biased against cases where the known clusters are potentially overlapped [2]. When this measure is used in as objective function, these overlapped clusters are usually combined, especially if the number of the produced clusters is smaller then the known number.
3
Variance Ratio Criterion (VRC)
The other criterion employed, VRC, is based on internal cluster cohesion and external cluster isolation [3]. It has been frequently used when clustering is combined with GAs [4, 5, 6]. The internal cohesion is calculated by the withingroup sum of square distances (WGSS) and the external isolation by the betweengroups sum of square distances (BGSS) [7]. The VRC value is given by: V RC =
BGSS W GSS / (k − 1) (n − k)
(2)
where k is the number of clusters and n the number of patterns. The results produced by the VRC criterion do not depend of the cluster algorithm used and can be employed to estimate the dataset natural number of clusters [8].
4
Proposed Approach
Three key aspects related to the use of GAs are solution representation, fitness function and genetic operators. In this work, the representation of each indi-
140
ESANN'2007 proceedings - European Symposium on Artificial Neural Networks Bruges (Belgium), 25-27 April 2007, d-side publi., ISBN 2-930307-07-2.
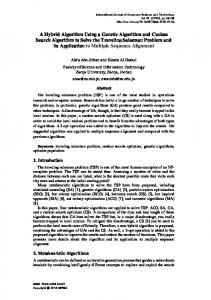
vidual is divided into two parts. The first part is composed by a vector of n real variables, genes, where n is the number of patterns in the dataset. Thus, each gene represents one pattern and its value indicates the cluster it belongs to. The second part stores the total number of clusters k, the distance measure to be used by k-means and the centroids (ct1 , ct2 , ..., ctk ) defined by k-means. For example, if a group of patterns X = {A − F } is partitioned into three clusters, C1 = {A, C}, C2 = {B, D, E} and C3 = {F }, this partition is represented by the chromosome in Fig. (1).
A 0
B 1
C 0
Part 1 D E 1 1
F 2
k 3
Part 2 distance measure euclidean
centroids ct1 |ct2 |ct3
Fig. 1: Chromosome representing groups C1 , C2 and C3 . 4.1
Fitness Function
Most of the clustering approaches using GAs have a fitness function based on a single criterion. Experiments performed by the authors showed that the use silhouette as fitness function resulted in clusters closer to the real structure of the data than the use of minimum squared error (MSE) or VRC, especially when this structure was disjoint. However, when the true structure has clusters with arbitrary shapes, silhouette may result in the agglomeration of overlapping clusters. Further analysis of these clusters revealed that VRC presented low scores when true clusters are agglomerated. Therefore, we propose a fitness function that uses VRC to detect and avoid agglomeration caused by the use of silhouette. This function penalizes individuals i for which V RC(i) − V RC < −dv is true, where V RC(i) is the VRC of individual i, V RC the average of the VRC values associated to all individuals in the population and dv its standard deviation. The fitness value of these individuals is given by Equation 3. n P
s0 (j)/n
j=1
F itness(i) =
(3) (V RC − V RC(i))/dv where n is the number of individuals in the population and s0 (j) is the mean silhouette value for all patterns represented by individual j. Otherwise, the fitness is given by the silhouette value. A performance comparison of the proposed fitness function with silhouette and VRC is presented in [9]. 4.2
Genetic Operators
In the proposed algorithm, KMGA, we propose a centroid-based modified crossover operator, where the centroids of two individuals are randomly distributed between two offspring with probability pc . The mutation operator employed changes
141
ESANN'2007 proceedings - European Symposium on Artificial Neural Networks Bruges (Belgium), 25-27 April 2007, d-side publi., ISBN 2-930307-07-2.
each pattern from one cluster to another with probability pm . The values of pc and pm are empirically defined (0.9 and 0.05, respectivelly). An elitism operator selects copies of the fittest individuals to the next generation. The fittest individuals are selected by tournament selection [10]. The stop criterion is simple: if there is no improvement in the best individual in N generations, the algorithm stops and returns the partition with the highest fitness value. It is important to stress a difference between the approach reported here and other approaches presented in the literature. In the proposed approach, a clone is made of each chromosome in the final population and k-means is applied to fine tune the clusters represented by these clones, using the distance measure stored in its second part. In the experiments carried out for this paper, the Euclidean, Pearson and Manhattan distances were investigated. Afterwards, if the clone has a fitness value higher than the original chromosome, it substitutes the original chromosome.
5
Experimental Results
Five datasets were used in the experiments, two artificial datasets (Gaussian3 and Simulated6) [11] and three datasets from Bioinformatics (Lung, Leukemia and Protein) [11, 12]. Table 1 describes the main characteristics of these datasets 1. It presents, for each dataset, the number of instances (]Inst.), the number of classes (]Cl.), the number of attributes (]Attrib. ) and the mean, minimum and maximum number of examples per class (mea./min./max. ex./class). Data Gaussian3 Simulated6 Lung Leukemia Protein
]Inst.
]Cl.
]Attrib.
60 60 197 248 698
3 6 4 6 4
600 600 1000 985 125
mea./min./max. ex./class 20/20/20 10/5/15 49.3/17/139 41.3/15/79 178/96/260
Main Characteristics 3 disjoint clusters. 50 attributes for each class. Heterogeneous clusters. 6 leukemia subtypes. Expression count.
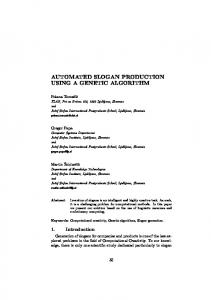
Table 1: Datasets description KMGA is compared with other GA-based clustering algorithms, GAG [13], COWCLUS [4] and the algorithm proposed by Murthy [14], and three traditional clustering algorithms, k-means [1], single-link and complete-link [1]. Each experiment was run 30 times for each algorithm and the results shown in Figure 2 are the average of these 30 runs. The clusters obtained by each approach were validated with the external criterion Corrected Rand (CR) [15]. This validation criterion compares the clusters obtained by a particular technique with the dataset previous known structure. CR results values are between [0.0...1.0], where 1.0 indicates that the partition found is identical to the known structure. Figure 2 shows that KMGA obtained CR values higher than other algorithms in the majority of the datasets. It was the only algorithm that obtained the real clusters of the Gaussian3 dataset on every run and found the closest partition to the real structure of Simulated6, with CR 0.9585. Single-link resulted in good
142
ESANN'2007 proceedings - European Symposium on Artificial Neural Networks Bruges (Belgium), 25-27 April 2007, d-side publi., ISBN 2-930307-07-2.
Fig. 2: Average CR value and runing time for each algorithm in each dataset partitions for the artificial datasets, but it was the only algorithm unable to find the true structure for the Gaussian3 and had the worst performance on the gene expression datasets. KMGA also obtained most of the highest CR scores on the Leukemia and Protein datasets and the second best performance on the Lung dataset. Complete-link showed a high CR on this dataset, but presented poor CR values for the others. Although KMGA also presented running time closer to the other GA clustering techniques and k-means, hierarchical single-link and complete-link were faster. Since hierarchical techniques are deterministic, they were run only once as their final partitions are the same for each dataset. The use of VRC in the fitness function avoided the agglomeration of known clusters, which occurred with the silhouette based fitness. Some examples were the penalization of the partitions with five clusters in the Simulated6 dataset, whose average CR raised from 0.3117 to 0.7532, and partitions with four clusters in the Leukemia dataset, whose CR raised from 0.4428 to 0.7814.
143
ESANN'2007 proceedings - European Symposium on Artificial Neural Networks Bruges (Belgium), 25-27 April 2007, d-side publi., ISBN 2-930307-07-2.
6
Conclusion
This article presented the KMGA algorithm, which uses VRC to detect and avoid partitions agglomerated by the silhouette criterion. Experimental results show that KMGA can produce partitions close to the known structure of the datasets employed. Different from the other algorithms investigated in this paper, KMGA obtained a good performance in all datasets evaluated. KMGA running time was close to the running time of other clustering algorithms based on GAs found in the literature and of the traditional k-means algorithm.
References [1] A. K. Jain, M. N. Murty, and P. J. Flynn. Data clustering: a review. ACM Computing Surveys, 31(3):264–323, 1999. [2] P. J. Rousseeuw. Silhouettes: a graphical aid to the interpretation and validation of cluster analysis. Journal of Computational and Applied Mathematics, 20:53–65, 1987. [3] T. Calinski and J. Harabasz. A dendrite method for cluster analysis. Communications in statistics, 3(1):1–27, 1974. [4] Marc C. Cowgill, Robert J. Harvey, and Layne T. Watson. A genetic algorithm approach to cluster analysis. Technical report, Virginia Polytechnic Institute & State University, Blacksburg, VA, USA, 1998. [5] Haiyan Pan, Jun Zhu, and Danfu Han. Genetic algorithms applied to multi-class clustering for gene expression data. Genomics, Proteomics and Bioinformatics, 1(4):279–287, 2003. [6] A. Casillas, M. T. Gonz´ alez de Lena, and R. Mart´ınez. Document clustering into an unknown number of clusters using a genetic algorithm. Lecture Notes in Computer Science, 2807:43–49, 2003. [7] R.O. Duda, P.E. Hart, and D.G. Stork. Pattern Classification. John Wiley & Sons, 2001. [8] Glenn W. Milligan and Martha C. Cooper. An examination of procedures for determining the number of clusters in a data set. Psychometrika, 50:159–179, 1985. [9] Murilo C. Naldi and Andr´ e C. P. L. F. Carvalho. Improving clustering with genetic algorithms. In Hybrid Artificial Intelligence Systems Workshop (HAIS’06) in the Proceedings of International Joint Conference, 10th Ibero-American Artificial Intelligence Conference, 18th Brazilian Artificial Intelligence Symposium, 9th Brazilian Neural Networks Symposium, IBERAMIA-SBIA-SBRN, Ribeir˜ ao Preto, Brazil, October 23-28. ICMCUSP, 2006. [10] M. Mitchell. An introduction to Genetic Algorithms. MIT Press, 1999. [11] Stefano Monti, Pablo Tamayo, Jill Mesirov, and Todd Golub. Consensus clustering: A resampling-based method for class discovery and visualization of gene expression microarray data. Machine Learning, 52(1-2):91–118, 2003. [12] Chris H.Q. Ding and Inna Dubchak. Multiclass protein folder recognition using support vector machines and neural networks. Bioinformatics, 17:4:349–358, 2001. [13] L.O. Hall, B. Ozyurt, and J.C. Bezdek. Clustering with a genetically optimized approach. In Transations on Evolutionary Computation, volume 3, pages 103–112, Department of Computer Science and Engineering, University of South Florida, Department of Computer Science and Engineering, University of West Florida, 1999. IEEE. [14] C. A. Murthy and Nirmalya Chowdhury. In search of optimal clusters using genetic algorithms. Pattern Recogn. Lett., 17(8):825 – 832, 1996. [15] L. J. Hubert and P. Arabie. Comparing partitions. Journal of Classification, 2:193–218, 1985.
144