10.1109/ULTSYM.2013.0204
Clutter Suppression Using Phase Apodization with Cross-correlation in Ultrasound Imaging Junseob Shin, Jesse T. Yen Department of Biomedical Engineering University of Southern California Los Angeles, CA, USA
[email protected]
sidelobes and clutter [6,7]. This technique has shown contrast improvement of 139% in simulation and 123% experimentally without sacrificing either lateral or axial resolution [6]. Since DAX relies on the quality of beam focusing, it shows limited performance in terms of contrast-to-noise ratio (CNR) improvement and robustness to image artifacts with increased levels of phase aberration [7]. In attempts to overcome such a limitation of DAX, we have proposed, in subsequent studies, taking an integrated approach, in which DAX is combined with either phase aberration correction based on nearest neighbor crosscorrelation [8], tissue harmonic or pulse-inversion harmonic imaging techniques [9]. These studies demonstrated improved performance of DAX as a result of better beam focusing achieved either by restoring the coherence of the beam by compensating for the focal error due to aberration or by extracting only the 2nd harmonic signals that have reduced effects of aberration. Despite the great promises of such combined methods, further performance enhancement may be possible by making modifications to the DAX algorithm itself to more effectively differentiate clutter signals from mainlobe signals. In this work, we propose a new beamforming technique called Phase Apodization with Cross-correlation (PAX), which is a modified version of DAX, that purposely introduces phase shifts in the receive delay profiles for clutter suppression. Although amplitude apodization has been frequently used in array-based ultrasound imaging systems and its effects have been well investigated, an imaging technique utilizing the concept of phase apodization has, to our knowledge, never been introduced within the medical ultrasound community. This paper reports the first study, which demonstrates the potential utility of dual phase apodization for ultrasound image contrast enhancement. We show in this preliminary study that PAX can achieve greater contrast enhancement than does DAX and minimizes or removes much of the black artifacts often observed with DAX for strong aberrators.
Abstract — Dual Apodization with Cross-correlation (DAX) is a novel adaptive beamforming technique that utilizes two distinct receive apodizations in suppressing clutter to enhance ultrasound image contrast. Previous studies have shown that its performance in terms of contrast enhancement diminishes with increasing level of phase aberration and has a tendency to create image artifacts. In this work, we propose a modified version of DAX, known as Phase Apodization with Cross-correlation (PAX), which utilizes sinusoidal phase apodization to further enhance image quality. Our preliminary simulation and experimental results presented in this work showed that PAX performs in a more robust manner than DAX, especially with increased level of phase aberration, to further improve image contrast and reduce image artifacts. Keywords-dual apodiztion, phase apodization, phase grating, clutter suppression, contrast enhancement, beamforming
I.
INTRODUCTION
In medical ultrasound imaging with arrays systems, degradation of image quality due to off-axis sidelobes and clutter inherent in conventional delay-and-sum (DAS) beamforming poses a great challenge, particularly in the presence of various levels of phase aberration. To enhance ultrasound image contrast, a number of different techniques has been proposed in the past [1,2], including some of the more recent developments such as the general coherence factor (GCF) [3], phase coherence factor (PCF), sign coherence factor (SCF) [4], and short-lag spatial coherence (SLSC) imaging [5]. GCF suppresses clutter by applying a pixel-by-pixel, target-dependent weighting matrix computed as a ratio of the spectral energy within a low frequency region to the total spectral energy. PCF employs an approach similar to GCF, but the weighting matrix is computed based on phase differences of the delayed channel RF signals across the aperture rather than coherence. SLSC, on the other hand, forms images directly using lateral spatial coherence as the basis. Each pixel in such images is generated by computing the SLSC value, VSLSC at every axial depth from the spatial coherence function and the SLSC integral. We have previously introduced a novel adaptive beamforming technique, known as Dual Apodization with Cross-correlation (DAX), which utilizes signals coming from two distinct receive apodizations to suppress unwanted
978-1-4673-5686-2/13/$31.00 ©2013 IEEE
II.
THEORY
Motivated by the concept of thin sinusoidal phase gratings and its mathematical formulations from optics [10], we introduce a pair of complementary sinusoidal phase
793
2013 Joint UFFC, EFTF and PFM Symposium
apodizations, such as those shown in Figure 3b. Their effects on the pulse-echo field can be approximated using the Rayleigh-Sommerfeld diffraction theory and the Fresnel approximation. The transmit-receive field, 𝜓! as a result of DAS beamforming at frequency 𝜔 at field point (x, z) with a sinusoidal phase apodization applied to the receive aperture can be expressed as:
Center Frequency Bandwidth Azimuthal Element Pitch Elevation Element Height Sound Speed Transmit Focus Lateral Beam Spacing (Point target) Lateral Beam Spacing (Cyst) Receive Focal Delay Step
𝜓!,!" 𝑥, 𝑧 =
! !"#
!
!"#
𝐴! (𝑢! )
! 𝑎 !! !
𝑥! 𝑒
!
!"#!! !
!
𝑒 !! ! !"#(!!!!!!)
𝑑𝑥!
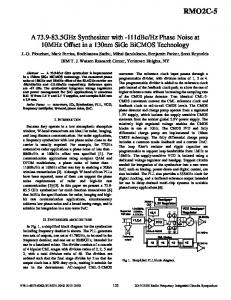
For both point target and anechoic cyst simulations, zeromean, random electronic near-field phase screens were generated by convolving Gaussian random numbers with a Gaussian function as described by Dahl et al [11] to mimic aberrating layers on the beam. Weak (25ns RMS 5mm FWHM) and strong (45ns RMS 3mm FWHM) aberrator profiles were created as shown in Figure 1, and applied on both transmit and receive during simulation.
(1)
!!
where 𝜆 is the wavelength, 𝑘 = is the wave number, 𝑘𝑚 is ! the peak-to-peak phase delay in radians, and 𝑓! is the spatial frequency of the phase apodization in cycles per meters, 𝑎! 𝑥! and 𝑎! 𝑥! are the transmit and receive apertures with 𝑥! as the azimuth coordinate on the aperture surface. The analysis can be further simplified by use of the identity: ! 𝑒 !" ! !"#(!!!!!!)
!
=
𝐽! !!!!
𝑘𝑚 !!!"! ! ! ! (2) 𝑒 2
where 𝐽! is the Bessel function of the first kind and of order q [10]. If both the transmit and receive apertures are 1-D arrays of finite length 2a, equation (1) becomes: 𝜓!,!" 𝑥, 𝑧 𝑒 !"# = 𝑗𝜆𝑧
!
!
!
2𝑎 𝑠𝑖𝑛𝑐 2𝜋𝑎 𝑢!
𝐽! !!!!
Figure 1. Aberrator profiles of 25ns RMS 5mm FWHM (dashed line) and 45 ns RMS 3mm FWHM (solid line).
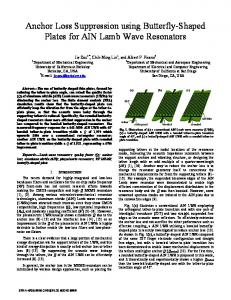
B. DAX and PAX Processing For all simulations performed in this study, a set of two complementary square wave functions with an 8-8 alternating pattern was used for DAX as reported in our previous study [8]. Similarly, for PAX, a set of two complementary sinusoidal functions with 𝑘𝑚 = 2𝜋 and 𝑓! = 420 cycles/meter was used to introduce time delays in the channel RF data prior to summing. A PAX system diagram is shown in Figure 2 and the apodizations used for DAX and PAX are shown in Figure 3.
𝑘𝑚 𝑠𝑖𝑛𝑐 2𝜋𝑎 𝑢! − 𝑞𝑓! (3) 2
Equation (3) predicts that the sinusoidal phase apodization on the receive aperture will yield grating lobes characterized by the Bessel function 𝐽! of the first kind. Thus, this will help guide the design of phase apodizations that are more robust and effective in creating phase differences in the clutter signals, which can then be detected by the use of zero-lag normalized cross-correlation. III.
5 MHz 50% 308 um 5 mm 1540 m/s 30 mm 100 µm 120 µm 1 mm
METHODS
A. Simulation Experiments in Field II To assess and compare the performance of PAX with that of DAX as well as conventional DAS beamforming, point target and anechoic cyst simulations were performed using Field II with imaging parameters chosen to model a 128element linear array with center frequency of 5MHz, 50% bandwidth, and an azimuthal element pitch of 308 um as summarized in Table I. For anechoic cyst simulations, channel RF signals from a 3 mm diameter anechoic cyst at a depth of 30 mm away from the transducer face were generated.
Figure 2. A system diagram for PAX.
a)
TABLE I. Field II Simulation Parameters
Parameters Number of Elements in Subaperture
b)
Figure 3. a) Amplitude and b) phase apodization functions used in DAX and PAX, respectively.
With two beamformed RF data obtained from the two distinct apodizations - either amptliude-based or phase-based -
Value 64
794
2013 Joint UFFC, EFTF and PFM Symposium
with equation (3). After performing PAX processing, a beam very similar to DAX is seen in Figure 4b. When applying a weak aberrator, the performance of DAX and PAX are similar as shown in Figure 4c. For the strong aberrator (Figure 4d), DAX tends to produce a beam with abrupt discontinuities near the high sidelobes, which are not observed with DAS. PAX tends to produce a beam that is quite similar to, but lacks the abrupt discontinuities seen with DAX. From the beamplots alone, one cannot predict how PAX will perform when imaging speckle-generating targets.
a segment length of 2.2 wavelengths was selected for zero-lag cross-correlation between them to create a weighting matrix filled with normalized cross-correlation coefficients ranging from 0 to 1 after thresholding at 0.001. In order to minimize the artifacts in the form of black spots which may arise due to the random nature of speckle, the weighting matrix was median filtered with a window size of 2𝜆 × 4𝜆. Improvements in image contrast achieved by DAS beamforming, DAX, and PAX were compared for no, weak, and strong aberrators. Performance was evaluated using the CNR equation: 𝐶𝑁𝑅 =
𝑆! − 𝑆! (4) 𝜎!
a)
b)
c)
d)
where 𝑆! is the mean of the target, 𝑆! is the mean of the background and 𝜎! is the standard deviation of the background of the envelop-detected, log-compressed image. C. Experiments with Tissue Mimicking Phantoms To validate the results from Field II simulations, imaging experiments were performed as described in [8]. Full synthetic aperture radio frequency (RF) data sets were acquired from an ATS ultrasound phantom (ATS laboratories, Bridgeport, CT, Model 549) containing 3 mm-diameter anechoic cysts located at 30 mm in depth. Pork tissue samples of thickness 4 mm and 10 mm composed of skin, muscle, and fat were used to mimic near-field aberrating layers. These RF signals were collected using a Verasonics data acquisition system (Verasonics, Redmond, WA) at 45 MHz sampling frequency with a 128– element, 298 µm pitch a L7-4 linear array. A 1-cycle transmit pulse with a center frequency of 5 MHz and a subaperture size of 64 elements were used. Data from each channel were collected 12 times and averaged to minimize the effects of electronic noise. All individual channel RF signals were bandpass filtered using a 64-tap finite impulse response (FIR) band-pass filter with frequency range limited to the -6 dB bandwidth of the transducer. Offline DAS beamforming was then performed using Matlab (The MathWorks, Inc. Natick, MA) with a constant f-number of 2. The transmit focus was set to a depth of 30 mm when no aberrator was used, but it was moved down by the thickness of the pork tissue when it is introduced. Focal updates every 1 mm in range and an image line spacing of 100 µm were used for dynamic receive focusing. DAX and PAX were also performed and their performance was compared with DAS beamforming in terms of CNR improvement as done for simulation study described above. IV.
Figure 4. a) Simulated lateral beamplots using complementary phase apodizations (red and blue) compared with DAS (black). Simulated lateral beamplots for DAS (black), DAX (blue) and PAX (red) with b) no aberrator, c) a weak (25ns RMS 5mm FWHM) aberrator, and d) a strong (45ns RMS 3mm FWHM) aberrator.
B. Simulated and Experimental Anechoic Cysts Figures 5 and 6 show simulated and experimental anechoic cysts, respectively, for DAS, DAX, and PAX with varying levels of phase aberration. The performance of PAX is compared with that of DAS and DAX, which have been published previously [8]. The CNR values are summarized in Table II. The simulation and experimental results are in good agreement in terms of CNR and overall image quality. In cases of no aberrator and a weak aberrator, PAX achieved CNR improvements comparable to those of DAX, with little or no visual difference in image contrast, target size, and shape. However, in the presence of a strong aberrator, PAX outperforms DAX in both simulation and experiment with greater CNR improvements and reduced image artifacts near the cyst. Hence, our results demonstrate that PAX has potential to improve contrast with increasing levels of phase aberration.
RESULTS AND DISCUSSION
A. Point Target Simulations Figure 4 shows simulated lateral beamplots for DAS, DAX, and PAX with varying levels of phase aberration. In all cases, DAX and PAX resulted in similar beamplots with comparable first sidelobe level and -6dB beamwidth. In Figure 4a, we compare the beams created using complementary phase apodizations (red and blue) with standard DAS beamforming. The first grating lobes are present at ±4.5 mm, which agrees
795
2013 Joint UFFC, EFTF and PFM Symposium
comparable to DAX with no or weak aberrator and greater CNR improvement as well as reduction of image artifacts that DAX tends to create in the presence of strong aberration effects. For fair comparison between DAX and PAX, the relevant parameters were empirically selected to yield the best performance for each method. Since the performance of PAX may vary depending on the selection of the peak-to-peak phase delay and the spatial frequency of the phase apodization functions, future work involves further investigation for optimal design of such phase apodization functions and validation of our results in vivo. V. ACKNOWLEDGMENT This work was supported by the Provost Fellowship at the University of Southern California and NIH Grant CA149543. REFERENCES [1]
P. Shankar, “Speckle reduction in ultrasound B-scans using weighted averaging in spatial compounding,” IEEE Trans. Ultrason. Ferroelectr. Freq. Control, vol 33, no.6, pp.754-758, Nov, 1986. [2] F. Forsberg, A. Healey, S. Leeman, J. Jensen, “Assessment of hybrid speckle reduction algorithms,” Phys. in Med. and Biol. Vol 36. no.11, pp.1539-1549, 1991. [3] P.-C Li and M.-L Li, “Adaptive imaging using the generalized coherence factor,” IEEE Trans. Ultrason. Ferroelectr. Freq. Control, vol. 50, pp. 93–110, Jan. 2000. [4] J. Camacho, M. Parrilla, and C. Fritsch, “Phase coherence imaging,” IEEE Trans. Ultrason. Ferroelectr. Freq. Control, vol. 56, no. 5, pp. 958–974, 2009. [5] J. J. Dahl, D. Hyun, M. Lediju, and G. E. Trahey, “Lesion detectability in diagnostic ultrasound with short-lag spatial coherence imaging,” Ultrason. Imaging, vol. 33, no. 2, pp. 119–133, Apr. 2011. [6] C. Seo and J. Yen, “Sidelobe suppression in ultrasound imaging using dual apodization with cross-correlation,” IEEE Trans. Ultrason. Ferroelectr. Freq. Control, vol 55, no.10, pp.2198-2210, Oct, 2008. [7] C. Seo and J. Yen, “Evaluating the robustness of dual apodization with cross-correlation,” IEEE Trans. Ultrason. Ferroelectr. Freq. Control, vol 56, no.2, pp.291-303, Feb, 2009. [8] J. Shin and J. T. Yen, “Synergistic enhancements of ultrasound image contrast with a combination of phase aberration correction and dual apodization with cross-correlation,” IEEE Trans. Ultrason. Ferroelectr. Freq. Control, vol. 59, no. 9, pp.2809-2101, Sep. 2012. [9] J Shin and J. T. Yen, “Effects of dual apodization with cross-correlation on tissue-harmonic and pulse inversion harmonic imaging in the presence of phase aberration,” IEEE Trans. Ultrason. Ferroelectr. Freq. Control, vol. 60, no. 3, pp.643-649, Mar. 2013. [10] J. W. Goodman, “Introduction to Fourier Optics,” 2nd ed. McGraw-Hill, NY, 1996. [11] J. Dahl, D. Guenther, and G. Trahey, “Adaptive imaging and spatial compounding in the presence of aberration,” IEEE IEEE Trans. Ultrason. Ferroelectr. Freq. Control, vol. 52, no.7, pp. 1131–1144, Jul. 2005. [12] S. Wang, C. Chang, H. Yang, Y. Chou, P. Li, “Performance Evaluation of Coherence-Based Adaptive Imaging Using Clinical Breast Data,” IEEE Trans. Ultrason. Ferroelectr. Freq. Control, vol 54, no.8, pp.1669-1679, Nov, 2007.
Figure 5. Simulated cysts for conventional DAS beamforming, DAX, and PAX in the presence of top) no aberrator, middle) a weak (25ns RMS 5 mm FWHM) aberrator, and bottom) a strong (45ns RMS 3mm FWHM) aberrator.
Figure 6. Experimental cysts for conventional DAS beamforming, DAX, and PAX in the presence of top) no aberrator, middle) a weak (4 mm pork) aberrator, and bottom) a strong aberrator (10 mm pork).
TABLE II. Contrast to Noise Ratios for standard, DAX, and PAX Processing Methods with Aberrators of Varying Strengths
! No Aberrator Weak Aberrator Strong Aberrator
Simulation DAS DAX PAX 5.20 10.70 10.98 4.10 8.50 8.65 1.69 3.17 5.28
Experiment DAS DAX PAX 5.00 12.59 12.44 3.10 6.98 7.57 1.75 2.31 6.13
IV. CONCLUSIONS AND FUTURE WORK Both our simulation and experimental results presented in this work show that PAX achieves CNR improvements
796
2013 Joint UFFC, EFTF and PFM Symposium