OSA/OFC/NFOEC 2011
JThA16.pdf JThA16.pdf
High-Sensitivity Phase Noise Monitoring Using a Phase-Asymmetric Nonlinear Loop Mirror Ying Gao1, Yanqiao Xie1, Shiming Gao1, Chester Shu2, and Sailing He1 1. Centre for Optical and Electromagnetic Research, State Key Laboratory of Modern Optical Instrumentation, Zhejiang University, Hangzhou 310058, P. R. China 2. Department of Electronic Engineering, The Chinese University of Hong Kong, N. T. Hong Kong, P. R. China Email:
[email protected]
Abstract: A high-sensitivity phase noise (PN) monitoring technique is proposed and demonstrated using a phase-asymmetric nonlinear loop mirror (PANLM). The phase-error variations from 40 to 520 are extracted with a sensitivity of 0.27 dB/degree. © 2011 Optical Society of America OCIS codes: (060.4370) Nonlinear optics, fibers; (120.5060) Phase modulation.
1.
Introduction
Phase-shift keying (PSK) modulation format has received tremendous attention in high-capacity and long-haul optical transmission [1]. A drawback of PSK format is that phase noises (PNs) will be accumulated from various processes [2, 3] during the transmission. In order to precisely locate the position of PN sources and monitor the quality of the transmitted PSK signals, high-sensitivity PN measurement techniques are highly desirable for modern transmission links. A delay interferometer (DI) is usually used as a PN monitor [4]. However, high monitoring sensitivity is not easy to be obtained while only the DI is used, especially when the PN is small. Recently, a four-wave-mixing (FWM)-based optical PN extraction and amplification technology has been reported to measure optical phase error variation (OPEV) from 460 to 1200 with enhanced monitoring sensitivity [3]. Meanwhile, several cross-phase modulation (XPM)-based non-coherent phase-regeneration techniques have also shown the improved capabilities to control the phase domain of PSK signal [5, 6]. In order to monitor the OPEVs smaller than 500, we propose, for the first time to the best of our knowledge, to use a π/2-biased phase-asymmetric nonlinear loop mirror (PANLM) to enhance the PN monitoring sensitivity. During the experiment, the proposed method can detect an OPEV as small as 40. This technique can facilitate precisely locating and analyzing the loaded PNs. 2.
Operation Principle
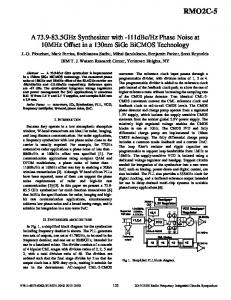
As shown in Fig. 1, the fiber-based PANLM is composed of a π/2-biased one-bit DI and a nonlinear optical loop mirror (NOLM). In order to stabilize the experimental setup and minimize the connection loss, all components in the fiber-based PANLM are spliced together. By adding a π/2 phase shift in the one-bit DI, even a small OPEV of the input DPSK signal can be effectively converted to two complementary intensity variations. The power levels of these two complementary branches are: PdI , II (t ) = 1 / 8 éë Pd ( t ) + Pd ( t + T0 ) ± 2 Pd (t ) Pd (t + T0 ) gsin Dj ùû (1)
Fig. 1. Schematic illustration of the PANLM based PN monitoring technique.
©Optical Society of America
OSA/OFC/NFOEC 2011
JThA16.pdf JThA16.pdf
where Pd and T0 are the optical power and the modulation period respectively. Dj = j (t + T0 ) - j (t ) represents the change in phase information between two adjacent bits of the incoming DPSK signal. The two inset eye-diagrams of Fig. 1 show the recorded eyes after the π/2-biased DI when no PN is added, where PdI equals to PdII within every bit. The Sagnac structure of the following NOLM makes it an intrinsically null-biased, dual drive modulator, in which the complementary intensity varying signals are acting as the driving data streams to modulate the intensity of a CW probe light. In the NOLM, the counter-propagating probe components experience complementary XPM effects. Next, the XPM influenced probe components interfere at the transparent port (port 5) of the NOLM. The resultant optical field at λ2 is then directed to the output port of the PANLM (port 6) by a 3-dB coupler:
ei ( Y0 + YD ) - ei ( Y0 -Y D ) i El 2 (t ) = El 2 (t )sin Y D eiY0 4 2 1 1 Y 0 = g L [ Pd (t ) + Pd (t + T0 ) ]; Y D = g L Pd (t ) Pd (t + T0 ) gsin Dj 4 2 Dj = Dj PN + Dj0 ET l 2 =
(2) (3) (4)
where Δφ0 describes the perfect 0-π phase information change without any PN and ΔφPN represents the OPEV of the incoming DPSK signal [3]. As shown in Eqs. (2) and (3), if ΔφPN = 0, the nonlinear phase shift ΨΔ is zero and thus providing zero transparency for the CW probe light at λ2, which means zero OPEV results in zero probe transparency. The coefficient in Eq. (3), γLPd/2 reaches π/2, when Pd achieves 28 dBm, with our highly nonlinear fiber (HNLF). The nonlinear coefficient γ, the zero-dispersion wavelength, and the fiber length L of the HNLF are 10 W-1km-1, 1553.5 nm, and 500 m, respectively. When γLPd/2 equals to π/2, the PN in the incoming DPSK signal at λ1 will be effectively transferred to intensity variation of the probe light at λ2 through an optical pull-push modulation: 1 2 ìp ü (5) PT l 2 = ET l 2 = sin 2 í sin DjPN ý Pl 2 4 î2 þ The factor 1/4 comes from the two 3-dB probe couplers embedded in the DI. The transmitted probe power of the PANLM, PTλ2, is normalized with respect to its maximum value and is plotted in the inset curve of Fig. 1. It is noted that PTλ2 is not influenced by Δφ0, but monotonically increases with ΔφPN, when ΔφPN < 900. 3.
Experimental Setup and Results
Fig. 2. (a) Experimental setup of the PN monitoring scheme; (b) Measured BER (diamond marks) versus phase-error levels at -7 dBm received power. The corresponding PM driving power (square marks) is also shown.
The experimental setup for PN monitoring is shown in Fig. 2(a). A 231-1, 10-Gb/s pseudo-random binary sequence (PRBS) is encoded on an optical carrier at 1550.9 nm through a null-biased, Mach-Zehnder modulator (MZM) to generate a DPSK signal. As previous experiments [3, 6], the signal is then directed to a phase modulator (PM), which is driven by a 2.3-GHz sinusoidal signal, to emulate the PNs. The PN-loaded DPSK signal is amplified by an erbium-doped fiber amplifier (EDFA1), filtered by a 0.8-nm band-pass filter (BPF) at 1550.9 nm, and demodulated by a DI for bit-error rate (BER) analysis and eye-diagram measurement. While the PN driving power is varying from -10 dBm to 15 dBm, the BERs of the demodulated DPSK signals are measured with a received optical power of – 7 dBm and plotted in Fig.2 (b) with diamond marks. Theoretically, the demodulated eye will be totally closed when the added OPEV rises to 900. It is well known that the refractive index of a LiNbO3 PM changes proportionally to the applied driving voltage. The corresponding peak-to-peak driving voltage changes from 0.1 V to 1.4 V when the driving power varies from -10 dBm to 15 dBm. The PM has a half-wave voltage of 4.9 V as
OSA/OFC/NFOEC 2011
JThA16.pdf JThA16.pdf
determined from another measurement. Hence, the added OPEV should vary from 40 to 650, which is also confirmed by the measured variation in eye-opening as depicted in Fig. 2(b). For the PN extraction, a CW probe is generated by a DFB laser at 1555.2 nm and is injected into the PANLM through a 3-dB coupler. The phase-degraded DPSK signal is amplified by EDFA2 to around 32 dBm, after considering the 3-dB loss of the probe coupler and the insertion loss of the DI. As shown in Eqs. (2) to (4), if a π/2 bias is introduced in the DI the transparency of the PANLM is reduced to zero when no PN is added. As the fibers used in our structure are not polarization maintaining, two polarization controllers (PCs) are used to co-polarize the related light waves to optimize the XPM efficiency. At the transparent port of the PANLM, the PN modulated probe light is obtained and selected by a BPF at 1555.2 nm.
Fig.3 (a) Measured RF spectra (b) RF power and (c) optical spectra from the DI- or PANLM-based monitoring schemes at different phase-error levels. A π/2 bias is added in the DI for both cases.
The RF spectra with the proposed PANLM-based monitoring scheme is measured with a 10.7-GHz PD and shown in Fig. 3(a). It is compared to the conventional DI-based PN technology, where the π/2 biased is also added in the DI for fairness. While the OPEV increases from 00 to 370, both the noise floor and the RF beating components of the PANLM-based monitoring scheme increase more rapidly than those of the DI-based scheme. Fig. 3(b) shows the measured RF power variation after a 3.5-GHz electrical low-pass filter (E-LPF). The variation [in decibels (dB)] is obtained by normalizing the measured RF power to that measured without loaded PN. A monotonic increase of the variation is observed for the PANLM scheme. It can be well fitted by a polynomial function, with a 0.27-dB/degree PN monitoring sensitivity and a 12.8-dB dynamic range, when OPEV varies from 40 to 520. For the π/2 biased DI, the PN monitoring sensitivity and the dynamic range are 0.08 dB/degree and 3.9 dB. Fig. 3(c) records the measured optical spectra of the transmitted probe of the PANLM at various OPEV values. The results show that the PN has been successfully translated into power variation in the PANLM scheme. For the single DI-based scheme, the transmittance is independent on the added PN. 4.
Conclusions
We have proposed and demonstrated a PANLM-based PN monitoring technology with enhanced sensitivity. With the proposed technique, the PN is converted to intensity modulation with improved modulation depth. Using a low-speed PD, the monitoring dynamic range is improved by around 9 dB, and the monitoring sensitivity is enhanced to 0.27 dB/degree. Acknowledgement: This work was supported by the National Natural Science Foundation of China (Grant No. 60708006) and the Zhejiang Provincial Natural Science Foundation of China (Grant No. Y1090379). References [1] C. Xu, L. Xiang, and W. Xing, “Differential phase-shift keying for high spectral efficiency optical transmissions,” IEEE J. Sel. Topics Quantum Electron. 10, 281-293, (2004). [2] C. Xu and X. Liu, "Postnonlinearity compensation with data-driven phase modulators in phase-shift keying transmission," Opt. Lett. 27, 1619-1621 (2002). [3] G.-W. Lu and T. Miyazaki, "Optical Phase Noise Extraction and Amplification Technique Through Four-Wave Mixing and its Application to Optical Phase Noise Monitoring in (D)PSK Systems," IEEE Photon. Technol. Lett. 21, 881-883 (2009). [4] R. A. Saunders, J. P. King, and I. Hardcastle, “Wideband chirp measurement technique for high bit rate sources,” Electron. Lett. 30, 1336–1338 (1994). [5] R. Elschner, A. M. de Melo, C.-A. Bunge, and K. Petermann, “Noise Suppression Properties of an Interferometer-Based Regenerator for Differential Phase-Shift Keying Data,” Opt. Lett. 32, 112-114, (2007). [6] V. S. Grigoryan, M. Shin, P. Devgan, J. Lasri, and P. Kumar, “SOA-based regenerative amplification of phase-noise-degraded DPSK signals: dynamic analysis and demonstration," J. Lightwave Technol. 24, 135-142 (2006).