J Neurophysiol 104: 128 –140, 2010. First published May 5, 2010; doi:10.1152/jn.00254.2010.
Coding Observed Motor Acts: Different Organizational Principles in the Parietal and Premotor Cortex of Humans Jan Jastorff,1 Chiara Begliomini,2 Maddalena Fabbri-Destro,2,3,4 Giacomo Rizzolatti,3,4 and Guy A. Orban1 1
Laboratorium voor Neuro- en Psychofysiologie, Medical School, K.U. Leuven, Leuven, Belgium; 2Dipartimento Scienze Biomediche e Terapie Avanzate, Sezione di Fisiologia Umana, Universita` di Ferrara, Ferrara, Italy; 3Dipartimento di Neuroscienze, Universita` di Parma, Parma, Italy; and 4Istituto Italiano di Tecnologia, Unita` di Parma, Parma, Italy Submitted 11 March 2010; accepted in final form 22 April 2010
Jastorff J, Begliomini C, Fabbri-Destro M, Rizzolatti G, Orban GA. Coding observed motor acts: Different organizational principles in the parietal and premotor cortex of humans. J Neurophysiol 104: 128–140, 2010. First published May 5, 2010; doi:10.1152/jn.00254.2010. Understanding actions of conspecifics is a fundamental social ability depending largely on the activation of a parieto-frontal network. Using functional MRI (fMRI), we studied how goal-directed movements (i.e., motor acts) performed by others are coded within this network. In the first experiment, we presented volunteers with video clips showing four different motor acts (dragging, dropping, grasping, and pushing) performed with different effectors (foot, hand, and mouth). We found that the coding of observed motor acts differed between premotor and parietal cortex. In the premotor cortex, they clustered according to the effector used, and in the inferior parietal lobule (IPL), they clustered according to the type of the observed motor act, regardless of the effector. Two subsequent experiments in which we directly contrasted these four motor acts indicated that, in IPL, the observed motor acts are coded according to the relationship between agent and object: Movements bringing the object toward the agent (grasping and dragging) activate a site corresponding approximately to the ventral part of the putative human AIP (phAIP), whereas movements moving the object away from the agent (pushing and dropping) are clustered dorsally within this area. These data provide indications that the phAIP region plays a role in categorizing motor acts according to their behavioral significance. In addition, our results suggest that in the case of motor acts typically done with the hand, the representations of such acts in phAIP are used as templates for coding motor acts executed with other effectors.
INTRODUCTION
In the monkey, there is a specific set of neurons (mirror neurons) that discharges both when the monkey performs a certain motor act and when it observes another individual performing it (Rizzolatti and Craighero 2004). Single neuron studies showed that mirror neurons are mostly located in the ventral premotor cortex (PMv) and inferior parietal lobule (IPL), a finding recently confirmed by functional MRI (fMRI) experiments (Nelissen et al. 2005; Peeters et al. 2009). Mirror neurons, as well as most PMv (Gallese et al. 1996; Kakei et al. 2001; Rizzolatti et al. 1988, 1996; Umilta et al. 2008) and IPL (Fogassi et al. 2005; Rozzi et al. 2008) motor neurons devoid of visual properties, code motor acts, i.e., movements with a specific goal (e.g., grasping). This differentiates them from neurons of the primary motor cortex that most frequently code elementary movements; that is, displacement of joints or body Address for reprint requests and other correspondence: G. A. Orban, Laboratorium voor Neuro-en Psychophysiologie, KU Leuven Medical School, Herestraat 49, bus 1021, 3000 Leuven, Belgium (E-mail:
[email protected]). 128
parts (e.g., flexion, extension, adduction, abduction) regardless of the motor act of which they are part (Kakei et al. 1999; Lemon et al. 1976; Porter and Lemon 1993; Umilta et al. 2008). The observation of motor acts performed by others activate in humans, as well as in monkeys, a series of areas active during motor act execution. This action observation–action execution network includes PMv plus parts of the inferior frontal gyrus (IFG) and the cortex inside the intraparietal sulcus extending into the adjacent IPL convexity (FabbriDestro and Rizzolatti 2008; Rizzolatti and Craighero 2004). Additional cortical areas (e.g., the superior parietal lobule and the dorsal premotor cortex) have also been described to be active during the execution and observation of some types of actions (Filimon et al. 2007; Gazzola and Keysers 2009; Grezes et al. 2003). There is evidence that, as in the monkey, the action observation–action execution network encode motor acts (Gazzola et al. 2007a,b; Hamilton and Grafton 2008; Peeters et al. 2009). It has been reported that both the parietal and frontal sections of the action observation–action execution network have a somatotopic organization. In PMv, the foot, hand, and mouth representations are organized in a medial to lateral direction, whereas in the IPL, the effector representation seems to show a rough rostro-caudal organization, the hand being located rostrally and the foot caudally (Buccino et al. 2001; Sakreida et al. 2005; Wheaton et al. 2004). However, all these studies have been based on a limited number of motor acts and have not addressed the issue of whether there are additional factors that may influence the coding of the motor acts in the action observation–action execution network. In this study, we addressed this issue by presenting volunteers with four motor acts performed by three effectors (hand, mouth, and foot). Two motor acts described a positive agent– object relationship (grasping an object or dragging it toward the agent), and two motor acts described a negative relationship (pushing an object or dropping it). In principle, there are two possibilities. The first is that the agent– object relationship has no role whatsoever in coding the observed motor acts, with the acts being coded according to the effector (mouth, hand or foot) performing them. The second is that the meaning of the observed motor acts influences the encoding, and thus motor acts having a similar agent– object relationship are clustered together regardless of the effector used to perform them. Thus dragging motor acts, for example, will be coded in the same cortical field regardless whether they are performed with the hand, mouth, or foot.
0022-3077/10 Copyright © 2010 The American Physiological Society
www.jn.org
ACTINOTOPY IN PARIETAL CORTEX
The results showed that, although in PMv, the observed motor acts are grouped according to the effector performing them, in IPL, there is an organization based on the agent– object relationship that is independent of the effector. Furthermore, motor acts having a positive sign (i.e., grasping and dragging) were located ventro-rostrally, whereas those with a negative sign (i.e., dropping and pushing) were located dorsocaudally. METHODS
Participants Eighteen volunteers participated in experiment 1 (11 women; mean age, 24 yr; range, 21–31 yr) and 15 in experiment 2 (9 women; mean age, 25 yr; range, 20 –34 yr), of whom 7 also participated in experiment 3 (5 women). All volunteers were right-handed, had normal or corrected-to-normal visual acuity, and had no history of mental illness or neurological diseases. The study was approved by the Ethical Committee of the K.U. Leuven Medical School, and all volunteers gave their written informed consent in accordance with the Helsinki Declaration before the experiment. To reduce head motion during the scanning sessions, the participants were asked to bite an individually molded bite bar fixed on the scanner table. Throughout the scanning session, eye movements of the participants were recorded with an ASL eye tracking system 5000 (60 Hz, Applied Science Laboratories).
129
Stimuli The stimuli were projected with a liquid crystal display projector (Barco Reality 6400i, 1,024 ⫻ 768, 60-Hz refresh frequency) onto a translucent screen positioned in the bore of the magnet at a distance of 36 cm from the point of observation. Participants viewed the stimuli through a mirror tilted at 45° and attached to the head coil. The experimental stimuli consisted of video clips displaying a side view of a human actor sitting at a table and performing one of four different motor acts. These motor acts were 1) dragging an object toward the actor, 2) pushing an object away from the actor, 3) grasping an object, and 4) dropping an object. Each motor act was carried out using three different effectors (foot, hand, and mouth; Fig. 1A), resulting in 12 different effector/motor act combinations. The overall size of the video display measured 17.7 ⫻ 13.2° visual angle and each video clip lasted 3 s. During video recording, special care was taken to ensure that each motor act was performed with only the most distal part of the effector (e.g., only the hand or the foot moved, whereas the arm or leg itself remained stationary). We thereby ensured that the four motor acts differed only in the type of movement and their goal and not in the amount of whole body motion. Because all movements were carried out by two different actors (1 man and 1 woman) and involved two different objects (a blue ball and a yellow cube), the complete stimulus set included 48 different video clips. Approximately 1° of visual angle above or below the moving effector, an image of a toy car (either blue or yellow), was shown in every frame of the video clips. This toy car measured 2.4 ⫻ 1.3° of visual angle, matching the size of the hand and foot in the videos.
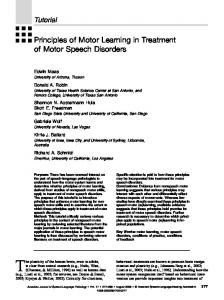
FIG. 1. Cortical activations during motor act observation. A: examples of stimuli used, static frames taken from videos of motor acts performed with the foot, hand, and mouth. B: statistical parametric maps (SPMs) of a random effects masking analysis (n ⫽ 18), plotting voxels more active during observation of all actions compared with all control stimuli. Activated voxels are projected onto a rendered view of the canonical MNI brain template (colored red to yellow, P ⬍ 0.001 uncorrected, but local maxima reached P ⬍ 0.05 FWE corrected; Supplemental Fig. S1). C: identical activation pattern as in B, projected onto the flattened left and right hemisphere of the PALS atlas. prCS, precentral sulcus; CS, central sulcus; SF, Sylvian fissure; STS, superior temporal sulcus; IPS, intraparietal sulcus.
J Neurophysiol • VOL
104 • JULY 2010 •
www.jn.org
130
JASTORFF ET AL.
In addition to the action stimuli, we used three different kinds of control stimuli: static stimuli, scrambled videos, and nonbiological motion videos. Static stimuli showed the first frame of every movement sequence, continuously, for 3 s, thereby controlling for the shape information present in the individual effector/motor-act videos. The two types of motion control stimuli were chosen to control for overall global motion (scrambled videos) and for specific local motion (nonbiological motion videos) differences between the individual effector/ motor-act pairs. The scrambled videos contained the same sequence of frames as the original video clip, but each frame was replaced by its phase-scrambled version. The nonbiological motion control stimuli consisted of the movement of the toy car mimicking the movement of the effector with the first frame of the respective action stimulus presented in the background. The car was animated with the exact motion of the hand or the foot extracted from the motor act videos. For the mouth, we used a mixture of object and mouth motions to animate the car. For pushing and dragging, corresponding to blowing and aspirating with the mouth, no mouth motion was added, whereas for grasping and dropping, the opening and the closing of the mouth was added to the object motion. Thus the duration, direction, speed, and amplitude of the car motion was matched to the movement of the effector and its effect on the object. The nonbiological motion condition was the most stringent control condition because it controlled for both static shape and local motion. To allow assessment of the visual nature of the MR responses, we included a fixation baseline condition showing a plain gray rectangle with the same dimensions and average luminance as the movie clips. We thereby minimized changes in luminance across conditions and thus kept the pupil size constant over the course of the experiment. A small red square (0.2°) was superimposed on all the stimuli. This fixation dot was presented 0.7° above or below the position where the movement occurred in the video. These two fixation positions were chosen to control for possible retinotopic effects caused by presentation of the movement in the upper or lower visual field. Because the movements took place at slightly different positions across the four movies (different actors and objects) belonging to any given effector/ motor-act combination, the fixation point was positioned in each video individually. This introduced small shifts in the vertical and horizontal positions of the video frames with respect to the fixation point. To reduce the possible influences of these shifts, the edges of the videos were blurred with an elliptical mask (14.3 ⫻ 9.6°), leaving the actor in the video unchanged, but gradually blending the periphery with the black background.
Procedure Experiment 1 was designed to study the coding of different motor acts, carried out by different effectors, in premotor and parietal cortex. Every run started with the acquisition of four dummy volumes to assure that the MR signal had reached its steady state. One run included five conditions, presented in different blocks of 24 s each. The five conditions consisted of 1 of the 12 effector/motor-act pairs (e.g., hand-dragging), its three corresponding control conditions, and a fixation baseline. Within a given block, the four versions of an effector/motor act pair (male and female actor, yellow and blue object; see Stimuli), the four nonbiological control movies, the four scrambled movies, and four images of the static control condition were presented twice in random order for 3 s each, for a total of 24 s. The baseline fixation image was presented throughout the 24 s of the fixation block. Within a run, the fixation position remained constant either above or below the effector. Every condition was shown three times, yielding 15 blocks per run, lasting 360 s overall. The order of the conditions remained constant over the repetitions within a run, but could change between runs. The order remained identical across the three effectors, but differed across motor acts and fixation positions, thus resulting in eight different sequences. Because each of these sequences could be asso-
EXPERIMENT 1.
J Neurophysiol • VOL
ciated with an effector, there were 24 different runs, corresponding to the 12 effector/motor-act pairs, each presented with two different fixation positions. One scanning session consisted of eight runs, which were grouped with regard to the effector used (e.g., 4 runs of different hand actions followed by 4 runs of foot actions). Every participant took part in three scanning sessions, resulting in the collection of the 24 runs for each subject. The order of the different motor acts and that of the effectors was counterbalanced across participants. Before scanning, each participant was familiarized with the different stimuli (movements and controls) outside the scanner and instructed to maintain his gaze on the red fixation dot throughout the experiment. During the presentation in the scanner, the position of the fixation dot was kept constant on the screen across all stimuli presented during any given run. EXPERIMENT 2. Experiment 2 was designed to further study the grouping of the four motor acts into the two categories we had found in experiment 1. To be able to compare activations for the different motor acts directly, a single run in experiment 2 comprised all four hand motor acts (dragging, dropping, grasping, and pushing) together with their respective nonbiological motion controls (e.g., the most effective control; Supplemental Fig. S1)1 and a fixation baseline condition. This design resulted in nine (2 ⫻ 4 ⫹ 1) conditions that were presented three times per run, resulting in 27 (3 ⫻ 9) blocks. To reduce the length of each run, the durations of the blocks were shortened to 21 s for the experimental conditions and 15 s for the baseline fixation condition, resulting in 549 s per run. The first and last 16 frames were removed from each video, resulting in videos lasting 2,625 ms instead of 3,000 ms. Because each motor act lasted ⬍2,625 ms, this manipulation reduced only the number of still frames presented within a block, without changing the duration of the movements, whether it was a motor act or the corresponding nonbiological motion control. Participants took part in a single scanning session of six runs. Experiment 2 also differed in another aspect from experiment 1. To control for the possibility that the more unusual motor acts might capture slightly more attention than those performed more commonly, thus eliciting stronger fMRI responses (Ress et al. 2000), the participants were instructed to perform an attentionally demanding highacuity task (Vanduffel et al. 2002). The fixation point was replaced by a small horizontal bar, which flipped to vertical for 1 s at random intervals between 3 and 15 s. Participants had to indicate this flip by pressing a button with their right index fingers. In a prescanning session, the size of the bar was adapted for each participant to maintain performance between 80 and 85% correct responses. The bar size ranged from 0.12 ⫻ 0.08 to 0.15 ⫻ 0.05° across participants. By using this task, we attempted to hold the level of attention devoted to the experimental stimuli constant (Sawamura et al. 2005).
The design of experiment 3 was identical to experiment 2 with the exception that foot and mouth motor acts were presented in the different runs instead of hand motor acts. The entire experiment consisted of two scanning sessions of six runs each: one for the four foot motor acts and their controls and one for the four mouth motor acts together with their controls.
EXPERIMENT 3.
Data collection Scanning was performed with a 3-T MR scanner (Intera, Philips Medical Systems, Best, The Nederlands) located at the University Hospital of K.U. Leuven. Functional images were acquired using gradient-echoplanar imaging with the following parameters: 50 horizontal slices (2.5 mm slice thickness; 0.25 mm gap), repetition time (TR) ⫽ 3 s, time of echo (TE) ⫽ 30 ms, flip angle ⫽ 90°, 80 ⫻ 80 matrix with 2.5 ⫻ 2.5 mm in plane resolution, and sensitivity enhancing (SENSE) reduction factor of 2. The 50 slices of a volume 1
The online version of this article contains supplemental data.
104 • JULY 2010 •
www.jn.org
ACTINOTOPY IN PARIETAL CORTEX
covered the entire brain from the cerebellum to the vertex. A threedimensional (3D) high-resolution T1-weighted image covering the entire brain was acquired in one of the scanning sessions and used for anatomical reference (TE/TR 4.6/9.7 ms; inversion time, 900 ms; slice thickness, 1.2 mm; 256 ⫻ 256 matrix; 182 coronal slices; SENSE reduction factor 2.5). A single scanning session lasted ⬃90 min.
Data analysis Data analysis was performed using the SPM2 software package (Wellcome Department of Cognitive Neurology, London, UK) running under MATLAB (The Mathworks, Natick, MA). The preprocessing steps involved 1) realignment of the images, 2) coregistration of the anatomical image and the mean functional image, and 3) spatial normalization of all images to a standard stereotaxic space (MNI) with a voxel size of 2 ⫻ 2 ⫻ 2 mm. Before further analysis, the functional data were smoothed with an isotropic Gaussian kernel of 8 mm. EXPERIMENT 1. For every participant, the onset and duration of each condition was modeled by a general linear model (GLM). The design matrix was composed of five regressors modeling the five conditions plus six regressors obtained from the motion correction in the realignment process to account for voxel intensity variations caused by head movement and one constant regressor per run. All regressors were convolved with the canonical hemodynamic response function (HRF). Depending on the question under consideration, different models were set up. One model combined all 24 runs of an individual subject to define the main action observation network. Because all effector/ motor act combinations were presented in separate runs, 12 additional models were defined for each of the 12 effector/motor-act pairs, combining the two runs with different fixation positions, to investigate their respective signal changes in a follow-up region of interest (ROI) analysis focusing on the regions activated in the premotor and the parietal cortex. Activation for a given effector/motor-act pair was always assessed with respect to its respective control conditions presented within the same run to remove potential differences in overall activation between runs or sessions. The potential differences were further reduced by counterbalancing the order of the different runs within and between sessions across subjects. To define the main action observation network (Fig. 1, B and C; Supplemental Fig. S1), we computed three contrast images for each of the 18 participants at the first level, combining all effector/motor-act videos compared with their static, scrambled, and nonbiological motion controls, respectively. In a second level random effects analysis (Holmes and Friston 1998), we computed three different activation maps, one for each control, combining the contrast images from all subjects (1-sample t-test). Inclusive masking of all three activation maps, thresholded at P ⬍ 0.001 uncorrected, yielded the voxels common to the three contrasts and constituted the main action observation network used for further analysis. The second step in the analysis was an ROI-based ANOVA of the relative activation levels of the 12 effector/motor-act pairs. First, the T-score map of the main action observation network was projected (enclosing voxel projection) onto flattened left and right hemispheres of the human PALS B12 atlas (Van Essen 2005; http://sumsdb.wustl. edu/sums/humanpalsmore.do) using the Caret software package (Van Essen et al. 2001; http://brainvis.wustl.edu/wiki/index.php/Caret:About). Next, we defined on the flatmaps a series of rectangular regions of interest (ROIs) covering, as well as possible, the premotor and parietal activation sites of the main action observation network. Subsequently, we identified the voxel coordinates contained in each ROI and exported them into MNI space. With this method, we defined 33 ROIs over the premotor cortex (RH: 17, LH: 16) and 135 ROIs along three lines over the left and right parietal cortex respectively (RH: 66, LH: 69). The particular sizes of these ROIs (19 ⫾ 6 voxels) was chosen to be able to average the signal across several voxels to reduce spurious effects while at the same time allowing for a sampling of the %MR
J Neurophysiol • VOL
131
signal change at multiple locations along the activations, thereby quantifying gradual changes in the signal. Moreover, this method restricted our analysis mainly to gray matter voxels. In a final step, we extracted for each ROI and each participant the %MR signal change for each of the 12 effector/motor-act pairs, relative to the nonbiological motion control condition. The data were entered into the ANOVAs or averaged for the observation of actions performed with different effectors (by collapsing over motor acts) or for the different motor acts (by collapsing over effectors). The line plots (Figs. 2 and 3) show the average %MR signal change across participants along the sequence of ROIs. In addition, we used the small volume correction in SPM to test whether or not the activation for the observed effector or motor act differed significantly (P ⬍ 0.05, family wise error corrected) from its three control conditions. Ideally, our ROI analysis should be restricted to a single repeatedmeasures ANOVA, comparing effects across premotor and parietal cortex. However, to perform this analysis, one would need to assume a specific relation between the ROIs defined in the two cortical areas. Because there is no a priori assumption that ROI position 1 in premotor cortex has any relationship to ROI position 1 in parietal cortex, we chose to analyze the two cortical areas separately. A four-way repeated-measures ANOVA was performed to compare the MR activation across the two lines covering the activation in left and right premotor cortex. The four factors were hemisphere, effectors, motor acts, and ROI position. Because the lines between left and right hemisphere differed in length by one ROI, we compared the first 16 positions from the two lines and disregarded ROI position 17 of the right hemisphere for this analysis. Because the activation levels differed significantly between the right and left parietal cortex, our analysis focused only on the left hemisphere; however, results of the right hemisphere are included as Supplemental Material. We performed three separate three-way ANOVAs, one for each line. The significance level was set at P ⬍ 0.0125 to correct for multiple comparisons, because we performed four independent ANOVAs. After obtaining a significant main effect of ROI or interaction in the ANOVA, subsequent contrast analyses were carried out to identify significant differences in specific ROIs between effectors or motor acts respectively. Modeling of the conditions was identical to experiment 1; however, because all motor acts were presented within the same run, a single model was used to investigate the effects. Following the results obtained in the first experiment, we computed a positive and a negative interaction for each of the participants. In the positive interaction, activation for dragging and grasping relative to their respective controls (positive contrast) was contrasted with activation for dropping and pushing, also relative to their respective controls (negative contrast). The negative interaction was simply the opposite of the positive one. Afterward, a second-level, random effects analysis was performed for the two interactions obtained from this first-level analysis. Next, the two resulting SPMs were masked with the main effect of actions versus controls, thresholded at P ⬍ 0.05 uncorrected. The significance level for the interactions was set at P ⬍ 0.001 uncorrected, a typical criterion for interactions (Jastorff and Orban 2009). From these interactions, we defined regions centered on the local maxima of the T-score maps. These regions were compared using a two-way ANOVA to test for a region-based, higher-order interaction between region and contrast sign (see RESULTS). In addition, we computed the same interactions using a fixed effects model, concentrating only on the seven participants who took part in both experiments 2 and 3. The resulting local maxima of this fixed effects analysis in the left parietal cortex were used for analysis in experiment 3. EXPERIMENT 2.
fMRI activations for foot and mouth motor acts were computed for the two interaction sites defined by the fixed effects analysis of experiment 2 and tested with a two-way ANOVA for region-based interactions.
EXPERIMENT 3.
104 • JULY 2010 •
www.jn.org
132
JASTORFF ET AL.
FIG. 2. Activations according to the different effectors. Flatmaps in A–C focus on individual anatomical locations, and the overlaid activation is identical to the activation shown in Fig. 1C. Small areas defined by black grid lines indicate the location of the regions of interest (ROIs). Orange outlines in A and B indicate area 44 as defined by cytoarchitectonic studies (Amunts et al. 1999). Dashed line, 50% overlap between individuals; solid line, 75% overlap. The black circle in A indicates the location of a local maximum sensitive to both 2-dimentional (2D) shape and depth structure from stereo cues (Georgieva et al. 2009). The line graphs plot the %MR signal change (⫾SE across subjects) for the 3 effectors, averaged over the motor acts, relative to the nonbiological motion control condition, as a function of dorso-ventral ROI position along the right and left precentral sulcus (A and B) and line 1 of the left parietal cortex (C). Vertical bars indicate SE. Filled circles show significant activation at small volume correction (P ⬍ 0.05 FWE corrected) for each effector compared with all its control conditions. Symbols indicate significant differences in the signal change (P ⬍ 0.05) between activations for 2 effectors, as shown by contrast analysis after a significant main effect or interaction in the ANOVA (asterisk: foot/mouth, triangle: hand/mouth, filled circle: hand/foot) under the constraint that the effector elicits significant activation in that ROI. The yellow arrows denote the overlap of the ROI with area 44. CS, central sulcus; SFS, superior frontal sulcus; IFS, inferior frontal sulcus; STS, superior temporal sulcus; IPS, intraparietal sulcus.
Activity profiles plot the differential MR activation in the various local maxima of experiments 2 and 3, as% MR signal change relative to the nonbiological motion control condition, for the positive and negative contrasts (see analysis of experiment 2). Profiles were computed by averaging a region of 27 voxels surrounding the local maxima.
Cavina-Pratesi et al. (2007); Culham et al. (2003); Frey et al. (2005); Jancke et al. (2001); Kroliczak et al. (2007); Shikata et al. (2003).
Definition of phAIP
All participants maintained good fixation during scanning. On average, they made 12.2 ⫾ 1.0 saccades/min, and the number of saccades did not differ significantly among conditions (1-way ANOVA). Analyzing the eye movements separately for each effector/motor act pair did not yield significant differences, nor did a comparison of the different effector/
The outline of putative human AIP (phAIP) in the left parietal cortex was based on a meta-analysis of local maxima from previous studies. The outline is defined as the confidence ellipse of all local maxima centered on their mean. The following publications were used to define phAIP: Begliomini et al. (2007); Binkofski et al. (1999a,b); J Neurophysiol • VOL
RESULTS
Experiment 1: Effectors versus type of motor act
104 • JULY 2010 •
www.jn.org
ACTINOTOPY IN PARIETAL CORTEX
133
FIG. 3. Activations in the left parietal cortex elicited by the different motor acts. A: flatmap identical to that shown in Fig. 2C. B: %MR signal change for the 4 motor acts, independently of the effector used (⫾SE across subjects), relative to the nonbiological motion control, plotted as a function of ROI position along parietal line 1 (thick black outline, dorsal to ventral) shown in A. The conventions are identical to those in Fig. 2. CS, central sulcus; STS, superior temporal sulcus; IPS, intraparietal sulcus.
motor act conditions with each other. This finding is important for the correct interpretation of the data because, as shown by Kimmig et al. (2001) for example, several cortical regions including parietal cortex display saccade-related BOLD responses that are highly correlated with saccade frequency. General action observation network Figure 1, B and C, highlights the general action-observation network (see METHODS) superimposed onto a rendered MNI template brain (Fig. 1B) and the flattened left and right hemispheres of the PALS atlas (Fig. 1C). The colored areas indicate stronger activation (P ⬍ 0.001 uncorrected) for all 12 effector/ motor act pairs, pooled together, relative to all control conditions. The lenient threshold was used to include voxels activated by only some of the effector/motor act pairs. In fact, most activation sites reached the more stringent level of P ⬍ 0.05 corrected as shown by the local maxima in premotor, parietal, and occipito-temporal cortex, as reported in Supplemental Fig. S1. The latter figure also shows that the nonbiological movement condition (toy car motion) was the most stringent of the three control conditions, yielding a more restricted activation pattern, when subtracted from action observation conditions compared with the other contrasts. Although the general action observation network seems to be similar in the left and the right hemispheres, some differences in the strengths of the activations in the two hemispheres can be noticed. In particular, the activation of the left parietal cortex is stronger than that of the right (see also Peeters et al. 2009). Direct comparison of the activation patterns in the two hemispheres indicated that this difference was significant (P ⬍ 0.001 uncorrected) along the anterior half of the intraparietal sulcus. Because the observed motor acts were all carried out with the right hand and foot, this difference might reflect an hemispheric preference for contralateral effector movements (Pelphrey et al. 2004; Shmuelof and Zohary 2006). Premotor cortex To study the role of effectors versus type of motor act in the organization of the action observation network, we analyzed the MR signal changes using a four-way repeated-measures ANOVA with the following factors: hemisphere, effector, type of motor act, and ROI position (Table 1). This analysis showed a significant two-way interaction between effectors and ROI position (F(30,510) ⫽ 3.8, P ⬍ 0.001) but no significant interaction between type of motor act and ROI position (F(45,765) ⫽ J Neurophysiol • VOL
0.9, P ⫽ 0.61). Figure 2, A and B, plots activations during the observation of motor acts when performed by each of the three effectors, independently of the type of the motor act. The small rectangles, superimposed on the activated areas, indicate the position of the ROIs used to assess changes in activation along the cortical surface for the various conditions (see METHODS for details). The line plots indicate the average activities for the observation of motor acts performed with the three effectors in terms of % MR signal change relative to the most strict control condition, i.e., the nonbiological motion condition, along the sequence of ROIs. The stringency of the control condition explains the small size of the MR signals, typical of these types of experiments (Aziz-Zadeh et al. 2006; Chong et al. 2008; Pierno et al. 2009). A rendered view (MNI brain template) of the activations for the different effectors over the whole brain is shown in Supplemental Fig. S3A. In the right premotor cortex (Fig. 2A), foot-related activation was the highest in the dorsal part of the activated region and decreased progressively, whereas the mouth-related activation was virtually absent dorsally, and increased ventrally. Finally, hand-related activation maintained a relatively constant value throughout the entire activation area. In contrast to the dorsal part, we observed an increase in activation for all effectors in the ventrally located ROIs, indicating that this region, in contrast to more dorsal regions, represents all effectors. MNI coordinates (x ⫽ 54, y ⫽ 14, z ⫽ 30), cytoarchitectonic maps (Amunts et al. 1999), and the proximity to areas sensitive to TABLE 1. Four-way repeated-measures ANOVA for premotor cortex
Effect
df
F
P
Hemisphere Effector Motor act ROI Hemisphere ⫻ effector Hemisphere ⫻ motor act Effector ⫻ motor act Hemisphere ⫻ ROI Effector ⫻ ROI Motor act ⫻ ROI Hemisphere ⫻ effector ⫻ motor act Hemisphere ⫻ effector ⫻ ROI Hemisphere ⫻ motor act ⫻ ROI Effector ⫻ motor act ⫻ ROI Hemisphere ⫻ effector ⫻ motor act ⫻ ROI
1,17 2,34 3,51 15,255 2,34 3,51 6,102 15,255 30,510 45,765 6,102 30,510 45,765 90,1530 90,1530
0.38 3.07 0.83 1.48 22.60 0.41 1.34 1.38 3.78 0.93 1.28 1.78 1.15 1.09 1.17
0.55 0.06 0.49 0.11 ⬍0.001 0.75 0.25 0.16 ⬍0.001 0.61 0.27 ⬍0.01 0.23 0.28 0.13
Significant effects are highlighted in italics. ROI, region of interest.
104 • JULY 2010 •
www.jn.org
134
JASTORFF ET AL.
curved stereo surfaces (Georgieva et al. 2009) provide some indication that this region might correspond to area 44, an area strongly interconnected with the anterior part of the intraparietal sulcus (Croxson et al. 2005). The results for the left premotor cortex (Fig. 2B) were very similar; however, the MR signal for the mouth was generally weaker compared with the right hemisphere. This difference is manifested as a significant three-way interaction between hemisphere, effectors, and ROI position (F(30,510) ⫽ 1.8, P ⬍ 0.01). Subsequent contrast analysis showed no significant difference between foot and hand activations across the two hemispheres (foot: F(1,17) ⫽ 1.2, P ⫽ 0.29, hand: F(1,17) ⫽ 1.9, P ⫽ 0.18) but a significantly weaker activation for mouth motor acts in the left hemisphere (F(1,17) ⫽ 19.7, P ⬍ 0.001). Neither the three-way interaction between hemisphere, motor acts, and ROI position (F(45,765) ⫽ 1.1, P ⫽ 0.23) nor the four-way interaction (F(90,1530) ⫽ 1.2, P ⫽ 0.13) was significant.
grasping motor acts on one hand and for dropping and pushing motor acts on the other. This finding was supported by correlation analysis. A comparison of activations for dragging and grasping motor acts over all 69 ROIs in the three lines of the left parietal cortex showed a strong correlation between these two motor acts (R ⫽ 0.8, P ⬍ 0.001). A similarly high correlation was obtained by comparing the activations for dropping and pushing motor acts (R ⫽ 0.76, P ⬍ 0.001). The correlations between all other combinations of motor acts did not reach significance (Fig. 4A). Moreover, the two correlation coefficients between drag and grasp and between drop and push were significantly higher than the next strongest correlation: that between push and drag. The test yielded z ⫽ 3.07 (P ⬍ 0.01) when comparing the correlation between drag/grasp to that between drag/push and z ⫽ 2.52 (P ⬍ 0.01) when comparing the correlation between drop/push to that between drag/push. On the other hand, the two correlations for drag/ grasp and drop/push did not differ significantly from each other (z ⫽ 0.55, P ⫽ 0.29). These correlation results clearly suggest
Parietal cortex Analyzing the %MR signal changes for the left parietal cortex using a three-way repeated-measures ANOVA with the factors effector, type of motor act, and ROI position yielded a completely opposite result. As shown in Fig. 2C, we obtained generally stronger activation for the observation of foot motor acts compared with hand and mouth motor acts throughout most of the parietal cortex, which became evident in a significant main effect of effector (line 1: F(2,34) ⫽ 16.0, P ⬍ 0.001; line 2: F(2,34) ⫽ 13.3, P ⬍ 0.001; line 3: F(2,34) ⫽ 5.7, P ⬍ 0.01). However, in contrast to premotor cortex, the two-way interaction between effectors and ROI position was not significant, not for line 1 shown in Fig. 2C (F(44,748) ⫽ 1.1, P ⫽ 0.21), nor for the other two lines (line 2: F(44,748) ⫽ 1.2, P ⫽ 0.15; line 3: F(44,748) ⫽ 1.0, P ⫽ 0.35). In contrast, we obtained a significant two-way interaction between type of motor act and ROI position (Fig. 3; line 1: F(66,1122) ⫽ 4.1, P ⬍ 0.001; line 2: F(66,1122) ⫽ 6.8, P ⬍ 0.001; line 3: F(66,1122) ⫽ 5.5, P ⬍ 0.001). The type of motor act by ROI interaction is shown in Fig. 3B, plotting the fMRI activation for each motor act, according to the ROIs of line 1 in the left parietal cortex. In more caudal regions, we obtained stronger responses for dropping and pushing actions compared with dragging and grasping actions. The opposite was true for the rostral part of the intraparietal sulcus (positions 13–18). The three-way interaction was not significant (line 1: F(132,2244) ⫽ 1.2, P ⫽ 0.06; line 2: F(132,2244) ⫽ 1.2, P ⫽ 0.09; line 3: F(132,2244) ⫽ 1.1, P ⫽ 0.23). Qualitatively similar results were obtained in the right parietal cortex (see Supplemental Fig. S2); however, because the activation in the left parietal cortex significantly exceeded the right one, further analysis concentrated on the left hemisphere. The line plot of Fig. 3B not only shows the interaction between types of motor acts and the cortical position but also suggests a specific grouping of motor acts. When the activation level for the observation of “dropping” videos (blue) increases or decreases along the line, the activation for pushing (green) follows. Similarly, activations for grasping (red) and dragging (yellow) co-vary. Comparing the spatial distributions of the activations for the different types of motor acts along the three lines, we found similar activation patterns for dragging and J Neurophysiol • VOL
FIG. 4. Grouping of positive and negative motor acts. A: correlation between the functional MRI (fMRI) activations plotted for the different motor acts over all ROIs of the left parietal cortex. Significance values for the different correlation coefficients from left to right and top to bottom: P ⬍ 0.001, P ⬍ 0.001, P ⫽ 0.07, P ⫽ 0.29, P ⫽ 0.98, and P ⫽ 0.9. B: illustration of the 2 motor act categories (positive and negative) defined by the 2 motor acts showing the highest correlation (dragging with grasping and dropping with pushing, see A). C: correlation analysis between fMRI activations for the odd and the even runs over all voxels of the main action observation network in the left parietal cortex (Fig. 3A). Significance of the correlations, P ⬍ 0.001.
104 • JULY 2010 •
www.jn.org
ACTINOTOPY IN PARIETAL CORTEX
that the four motor acts can be grouped into two motor act categories based on their relationship between the agent and the object. We tentatively designated these categories positive (dragging and grasping) for motor acts bringing the object toward the agent and negative (dropping and pushing) for motor acts moving the object away from the agent (Fig. 4B). To validate the grouping of motor acts according to sign, we conducted an additional split-data analysis, computing the activations for positive and negative motor acts separately for the even and the odd runs for all activated voxels of the left parietal cortex (Fig. 1C). Subsequently, we normalized the response of each voxel separately for the even and the odd runs by subtracting the mean response across all conditions (Haxby et al. 2001). By computing the correlation between the even and the odd runs for the two action categories, we found a positive correlation (R ⫽ 0.67, P ⬍ 0.001) when comparing positive motor acts across runs (the same was true for negative motor acts) but a negative correlation when comparing positive with negative motor acts across runs (R ⫽ ⫺0.67, P ⬍ 0.001; Fig. 4C). This analysis confirmed that the activations for the two motor act categories were not only distinct in the parietal cortex but that this result was also highly reproducible across runs. In summary, experiment 1 showed a clear difference in the encoding of motor acts in the premotor and the parietal cortices. Whereas in premotor cortex, the motor acts executed by the same effector were clustered together independently of the type of the observed motor act, in parietal cortex, it was the motor acts having a similar goal that tended to be coded together, regardless of the effector used. Specifically, in the parietal lobe the spatial distributions of the activations for motor acts bringing the object toward the agent (positive motor acts; dragging and grasping) were very similar to each other, as were the spatial distributions for motor acts moving the object away from the agent (negative motor acts; dropping and pushing). Experiment 2: Spatial segregation of positive and negative motor acts in parietal cortex Experiment 2 was designed to further study the spatial separation between positive and negative motor acts found in the left parietal cortex. To this end, we presented all four motor acts (dragging, dropping, grasping, and pushing) within the same run, together with their respective nonbiological motion controls. Only hand motor acts were shown. In addition, the participants performed an attentionally demanding high-acuity task during the scanning (Denys et al. 2004; Georgieva et al. 2008; Vanduffel et al. 2002) to minimize the possibility that motor acts more rarely observed in everyday life capture more attention than those seen frequently. The mean activation levels in the main action observation network for the four hand motor acts used in this experiment were indeed very similar (Supplemental Fig. S3). Despite the participants’ engagement in the attention task, the action observation network obtained in experiment 2 did not differ from that obtained for the observation of hand motor acts in experiment 1 (Supplemental Fig. S4). On average, participants detected the bar flip in the highacuity task in 85 ⫾ 2% of the cases, with a mean reaction time of 589 ⫾ 7 ms across subjects. Statistical analysis showed that J Neurophysiol • VOL
135
the percentage of correct responses did not differ significantly across conditions (F(8,112) ⫽ 1.1, P ⫽ 0.37); nor did the reaction times (F(8,112) ⫽ 1.4, P ⫽ 0.21). The number of saccades averaged 6.3 ⫾ 1.1 saccades/min and was not significantly different between conditions (1-way ANOVA). Compared with experiment 1, the high-acuity task clearly improved the fixation quality. Figure 5A shows the results of a random effects analysis of experiment 2. Voxels showing a significant interaction (P ⬍ 0.001 uncorrected; masked with the main effect of actions, see METHODS) for positive motor acts are shown in red, whereas voxels showing a significant interaction for negative motor acts are highlighted in blue. These two interaction sites were the only regions within the entire brain showing a significant interaction for the two groups of actions. The site exhibiting stronger activation for positive motor acts was located in the rostro-ventral part of phAIP (white outline) (Binkofski et al. 1999a; Culham et al. 2003; Frey et al. 2005; Shikata et al. 2003), whereas negative motor acts led to stronger activation dorso-caudally in the same area. Although caution is required when identifying an area on the basis of Talairach coordinates taken from other studies, the ellipse defining phAIP was based on a set of nine well-controlled studies (see METHODS). In addition, a recent study of Peeters et al. (2009) confirmed the involvement of AIP in the monkey and phAIP in humans in action observation. The activity profiles for the local maxima of the positive and the negative interaction sites (colored spheres in Fig. 5A) are presented in Fig. 5B. In the positive local maximum, the red bar is higher than the blue bar, indicating that the activity for positive motor acts, relative to their respective nonbiological motion controls (positive contrast), exceeds that for the negative motor acts, again relative to their respective nonbiological motion controls (negative contrast), i.e., there is an interaction favoring positive motor acts. In the negative local maximum, the opposite holds true, indicating the opposite interaction. A subsequent two-way repeated-measures ANOVA showed a significant interaction (F(1,14) ⫽ 32.7, P ⬍ 0.001) between the factors cortical region (red and blue spheres) and contrast sign (positive or negative). This region-based interaction captures the contrasting activity patterns of the two ROIs. To avoid circular reasoning, we also determined the two local maxima for the odd runs of experiment 2 only and computed the activity profiles in those locations using the even runs (Fig. 5C). This additional analysis confirmed our results, again showing a significant region-based interaction (F(1,14) ⫽ 28.2, P ⬍ 0.001). Figure 5D plots the fMRI activation for each individual participant for the local maxima of the random effects model (2 spheres in Fig. 5A), ordered according to the amplitude of their activations for positive motor acts relative to their controls. All subjects except one (subject 15) clearly show stronger responses, relative to control, for positive motor acts compared with negative ones in the local maximum for the positive interaction. The converse was observed for the negative interaction site, with the exception of subject 12. However, when we considered the local maximum for each individual subject, rather than for the group, all subjects showed the expected pattern (Supplemental Fig. S5). In conclusion, experiment 2 directly tested for the segregation of motor acts according to sign in the left parietal cortex
104 • JULY 2010 •
www.jn.org
136
JASTORFF ET AL.
FIG. 5. Experiment 2, confirmation of action categories. A: voxels showing a significant interaction (P ⬍ 0.001, uncorrected) for positive motor acts are shown in red, whereas voxels showing a significant interaction for negative motor acts are highlighted in blue on the flattened left parietal cortex shown in Fig. 3A. Spheres indicate the position of the respective local maxima from the random effects analysis of all 15 subjects (MNI coordinates positive: ⫺48, ⫺30, 52; negative: ⫺32, ⫺44, 56) and white dotted lines the confidence ellipse for ph AIP. B and C: activity profiles at the interaction regions defined from all runs (B) and odd runs only (C) averaged over the 2 positive (red) and the 2 negative (blue) hand motor acts, each compared with their nonbiological motion controls, the so-called positive and negative contrasts (⫾SE across subjects). D: %MR signal change in the regions of the positive and the negative interactions (same as in B) for positive and negative contrasts plotted for the different subjects ordered according to their positive activation in the positive region. Red subject numbers indicate the 7 subjects common with experiment 3. poCS, postcentral sulcus; IPS, intraparietal sulcus.
that had been suggested by the results of experiment 1. A site favoring positive motor acts was located rostro-ventrally in phAIP, whereas a site representing negative motor acts was located dorso-caudally within the same area. Experiment 3: Effector-independent grouping of positive and negative motor acts Experiment 2 studied only hand motor acts. Experiment 3 was therefore designed to confirm the sign-related segregation found in experiment 2, but for the other two effectors. Seven participants, who had taken part in experiment 2 (indicated in red in the abscissas of Fig. 5D), were studied, this time testing foot and mouth motor acts. The design was otherwise identical to experiment 2. As in the previous experiment, participants performed well in the high-acuity task. On average, subjects detected the bar flip in 84 ⫾ 2% of the cases for runs presenting foot motor acts and in 86 ⫾ 3% for runs presenting mouth motor acts. The mean reaction time was 562 ⫾ 5 ms and 567 ⫾ 8 ms across subjects in foot and mouth runs, respectively. Statistical analJ Neurophysiol • VOL
ysis showed that the percentage of correct detections did not differ significantly across conditions (F(8,48) ⫽ 0.9, P ⫽ 0.54 and F(8,48) ⫽ 1.0, P ⫽ 0.44 in foot and mouth runs, respectively); nor did reaction times (F(8,48) ⫽ 0.4, P ⫽ 0.92 and F(8,48) ⫽ 1.0, P ⫽ 0.27). Because the high-acuity task can be performed only in central vision, similarities in task performance indicate that fixation quality was nearly identical in the different conditions. To generate an a priori prediction for this experiment, we performed a fixed effects model of the data obtained in experiment 2 for the seven participants common to both experiments. Using this analysis, we defined the group local maxima over these seven subjects for positive and negative hand actions, indicated as diamond shapes in Fig. 6A, and extracted the activity profiles for all three effectors using the 27 voxels surrounding the local maxima (Fig. 6B). We predicted an interaction between the cortical region and the contrast sign not only for hand motor acts but also for the two new effectors. Both predictions were born out, and region-based interactions in the two-way ANOVA were significant for both foot actions (F(1,41) ⫽ 5.1, P ⬍ 0.05) and
104 • JULY 2010 •
www.jn.org
ACTINOTOPY IN PARIETAL CORTEX
137
FIG. 6. Experiment 3: action categories independent of the effectors. A: positive (red) and negative (blue) interaction regions from experiment 2; spheres and white dotted lines as in Fig. 5. Diamond shapes indicate the position of the local maxima for the positive and the negative interactions for hand motor acts as identified by a fixed effects analysis restricted to the 7 subjects common to experiments 2 and 3. B: activity profiles in these 2 regions plot the average %MR signal change (⫾SE across subjects) for positive and negative contrasts, plotted separately for the 3 effectors. poCS, postcentral sulcus; IPS, intraparietal sulcus.
mouth actions (F(1,41) ⫽ 8.4, P ⬍ 0.01). These values were similar to those obtained for the hand (F(1,41) ⫽ 8.9, P ⬍ 0.01). Figure 6B shows that stronger activation was indeed observed for positive compared with negative motor acts, each relative to their controls, in the positive local maximum for the hand, independently of the effector used to perform the action. The converse was found in the negative local maximum. Taken together, the results of experiment 3 confirm that the clustering of motor acts according to sign was indeed effector independent, as suggested by experiment 1. DISCUSSION
The basic elements of functional organization in the ventral premotor cortex (PMv) and the inferior parietal lobe (IPL) are motor acts, i.e., movements with a specific goal (see Introduction). However, the same goal, (e.g., grasping an object) can be achieved using different effectors and, conversely, the same effector can be used to obtain different goals (e.g., grasping, dragging, pushing). Here we have shown that the clustering of motor acts in the premotor cortex is effector-based: the observation of a motor act performed with the same effector activates the same anatomical sector regardless of the type of that motor act. In contrast, the clustering of observed motor acts in IPL is based on their functional meaning: the observation of motor acts with similar goals activates the same anatomical sectors regardless of the effector performing them. Premotor cortex The finding in the ventral premotor cortex that activations for the observation of motor acts tend to be located together if performed with the same effector is in agreement with the data of previous imaging studies (Buccino et al. 2001; Sakreida et al. 2005; Wheaton et al. 2004). Similarly, the presence, within a given somatotopic field (foot, hand, or mouth), of additional, weaker responses to the observation of motor acts carried out with other effectors is also in accord with these previous findings. Furthermore, the absence of clustering according to functional meaning in PMv does not at all imply that single neurons in the premotor cortex are not selective for the type of action. Such selectivity has been reported for monkey F5 neurons (Rizzolatti et al. 1988). It simply indicates that motor acts executed with the same effectors are represented one close to another. In the same vein, our results may seem, at first glance, to contradict the proposed motor cortex organization of Graziano and Aflalo (2007), who reported segregation of various complex movements performed with the same effector. HowJ Neurophysiol • VOL
ever, our study was focused on the representation of fine manipulative actions in PMv using action observation as probe, whereas that of Graziano et al. described complex, multisegmental movements evoked by electrical stimulation of a large region of cortex that included primary motor and dorsal premotor cortex. Note also that the concept of Graziano and Aflalo that the cortical motor system evolved primarily for action organization, rather than for movement control, is fully consistent with our findings. When comparing right and left premotor activations, we found that the mouth representation in the left hemisphere was significantly weaker compared with that in the right hemisphere. A similar asymmetry has been previously reported (Buccino et al. 2001; Wheaton et al. 2004). It is likely that this asymmetry depends on the type of actions presented. Whereas the left ventral premotor cortex is mainly involved in linguistic functions (Aziz-Zadeh et al. 2005, 2006), the motor acts we presented depicted nonlinguistic motor acts. It is therefore possible that, with the evolution of language, a reorganization occurred in the left premotor cortex of humans with a concomitant decrease of the neural space devoted to nonlinguistic mouth actions. Parietal cortex The most novel finding of our study concerns the way in which motor acts performed by others are coded in the parietal lobe. Although it has been shown previously that phAIP is involved in action observation (Peeters et al. 2009), we found 1) that the observation of different types of hand motor acts produced a spatially segregated activation pattern in this area, with positive motor acts clustered ventrally and negative motor acts clustered dorsally in phAIP, and 2) that the same pattern was observed during the observation of motor acts performed with the mouth and the foot. There are several lines of evidence to suggest that this organization is indicative of higher-level, categorical representations of motor acts in the inferior parietal lobule. In fact, the movement kinematics differs considerably both between dragging and grasping (positive motor acts) and between dropping and pushing (negative motor acts) executed with the same effector (e.g., the hand) and even more when these motor acts are executed with different effectors (hand, mouth, and foot). Thus the high correlations between the activations elicited by the two positive motor acts and between those of the two negative motor acts cannot simply be explained by their physical similarities. Note also that the separation between positive
104 • JULY 2010 •
www.jn.org
138
JASTORFF ET AL.
and negative motor acts was observed independently in all experiments. The categorization of motor acts according to their sign is strongly reminiscent of some findings by Freedman and Assad (2006). These authors recorded neurons in lateral intraparietal (LIP) of the monkey after training the animal to perform a motion-categorization task. They found that neurons in anterior LIP reflect the category membership of visual motion direction and that the responses of LIP neurons changed according to the required categorization. Our results extend the role of LIP in stimulus categorization to another, neighboring parietal area. They also suggest that stimulus categorization occurs in IPL naturally, according to the behavioral significance of the observed motor act. This latter property differentiates it from rule-based categorization that involves prefrontal areas (Smith and Grossman 2008). Note, however, that we do not claim that our definitions of sectors coding positive and negative motor acts describe the only categorical boundary represented in the anterior part of IPS. Future experiments testing a wider range of motor acts involving different viewpoints are needed to answer this question. What could be the purpose for grouping motor acts according to their behavioral sign (taking possession vs. discarding) and for their particular spatial arrangement? In the macaque monkey, the anterior tip of AIP is strongly interconnected with the hand and digit representations in secondary somatosensory cortex, whereas these connections are weaker in the posterior part of AIP (Borra et al. 2008). We propose that this may explain why positive actions are located rostro-ventrally in phAIP and negative ones dorso-caudally, because the consequence of taking possession of an object is prolonged haptic interaction, which is not the case when discarding an object. It is important to stress that the categorization of motor acts in positive and negative was observed in area phAIP for all three effectors. This finding is rather surprising because neurophysiological findings show that, in both monkeys (Jeannerod et al. 1995; Sakata et al. 1995; Taira et al. 1990) and humans (Binkofski et al. 1999a; Culham et al. 2003; Frey et al. 2005; Rice et al. 2006; Tunik et al. 2008), area AIP is part of a circuit related to the visuo-motor control of hand movements. Anatomical findings (Borra et al. 2008) and lesion studies (Gallese et al. 1994) also support this view. Thus how can this multiple effector representation in AIP explained? One possibility is that, contrary to what is generally believed, area AIP is not exclusively a hand area but is also involved in the processing of agent– object interactions performed with different effectors. There is no evidence, however, in favor of such multiple-effector localization in AIP. On the contrary, single neuron data in the monkey clearly suggest a segregation of the different body parts and related movements in different cytoarchitectonic areas of the inferior parietal lobule (Hyvarinen 1981; Rozzi et al. 2008). An alternative possibility is that, because the motor acts we presented (grasping, dragging, pushing, dropping) are typically hand motor acts, their observation might have activated principally neurons coding hand actions, or, putting it in other terms, the hand action templates were used to comprehend the goal of motor acts carried out using other effectors. Consistent with this interpretation are the findings that the human grasping circuit is strongly activated during the observation of grasping performed with artificial devices, even when the artificial J Neurophysiol • VOL
device differs from a grasping hand in shape and kinematics (Gazzola et al. 2007a; Peeters et al. 2009). It might therefore be that, because phAIP is crucial for decoding the motor acts typically done with the hand, other parietal areas related to the control of foot movements could become active during the observation of motor acts typically performed with the foot. The activations extending dorsally, beyond area phAIP for foot kicking and pushing actions reported by Buccino et al. (2001), could in fact indicate the existence of other parietal areas related to the control of foot movements. In line with this interpretation is our finding of a dorsal region where the observation of foot actions produced significantly stronger activations than that of other effectors. Conclusion In summary, our data suggest that the encoding of motor acts done by others occurs in three main steps. The first consists of a visual description of the observed movements. This process occurs in the occipito-temporal cortex. The relevance of movement goals is rather limited at this point (Jastorff and Orban 2009; Nelissen et al. 2006; Perrett et al. 1990) and, most importantly, even in the STS region, there is no goal generalization across effectors (Cattaneo et al. 2010). This visual description of the observed motor acts is sent to the parietal cortex, where it is transformed into potential, goal-directed motor acts. By generalizing the observed motor act across effectors and by categorizing them, these representations play a fundamental role in the comprehension of the goal of a given motor act, independently of how that goal is achieved. In a third step, the goal-related information reaches the premotor cortex, where motor acts, and their visual counterparts, are now clustered largely according to a somatotopic coordinate system, which highlights the somatic specificity of the motor act and may facilitate the imitation of that act. ACKNOWLEDGMENTS
The help of R. Peeters, P. Kayenbergh, W. Depuydt, M. Depaep, and G. Meulemans is kindly acknowledged. We thank S. Raiguel, R. Vandenberghe, G. Luppino, S. Rozzi, C. Keysers, J. Culham, and J. Assad for comments on an earlier version of the manuscript. GRANTS
This study was supported by Grants Fonds Wetenschappelijk Onderzoek G.0730.09, Inter University Attraction Pole 6/29, and Excellentie Financiering 05/14 to G. A. Orban and IUAP6/29 and Agenzia Spatiale Italiana to G. Rizzolatti. DISCLOSURES
No conflicts of interest, financial or otherwise, are declared by the author(s). REFERENCES
Amunts K, Schleicher A, Burgel U, Mohlberg H, Uylings HB, Zilles K. Broca’s region revisited: cytoarchitecture and intersubject variability. J Comp Neurol 412: 319 –341, 1999. Aziz-Zadeh L, Cattaneo L, Rochat M, Rizzolatti G. Covert speech arrest induced by rTMS over both motor and nonmotor left hemisphere frontal sites. J Cogn Neurosci 17: 928 –938, 2005. Aziz-Zadeh L, Wilson SM, Rizzolatti G, Iacoboni M. Congruent embodied representations for visually presented actions and linguistic phrases describing actions. Curr Biol 16: 1818 –1823, 2006.
104 • JULY 2010 •
www.jn.org
ACTINOTOPY IN PARIETAL CORTEX Begliomini C, Wall MB, Smith AT, Castiello U. Differential cortical activity for precision and whole-hand visually guided grasping in humans. Eur J Neurosci 25: 1245–1252, 2007. Binkofski F, Buccino G, Posse S, Seitz RJ, Rizzolatti G, Freund H. A fronto-parietal circuit for object manipulation in man: evidence from an fMRI-study. Eur J Neurosci 11: 3276 –3286, 1999a. Binkofski F, Buccino G, Stephan KM, Rizzolatti G, Seitz RJ, Freund HJ. A parieto-premotor network for object manipulation: evidence from neuroimaging. Exp Brain Res 128: 210 –213, 1999b. Borra E, Belmalih A, Calzavara R, Gerbella M, Murata A, Rozzi S, Luppino G. Cortical connections of the macaque anterior intraparietal (AIP) area. Cereb Cortex 18: 1094 –1111, 2008. Buccino G, Binkofski F, Fink GR, Fadiga L, Fogassi L, Gallese V, Seitz RJ, Zilles K, Rizzolatti G, Freund HJ. Action observation activates premotor and parietal areas in a somatotopic manner: an fMRI study. Eur J Neurosci 13: 400 – 404, 2001. Cattaneo L, Sandrini M, Schwarzbach J. State-dependent TMS reveals a hierarchical representation of observed acts in the temporal, parietal, and premotor cortices. Cereb Cortex In press. Cavina-Pratesi C, Goodale MA, Culham JC. fMRI reveals a dissociation between grasping and perceiving the size of real 3D objects. PLoS ONE 2: e424, 2007. Chong TT, Williams MA, Cunnington R, Mattingley JB. Selective attention modulates inferior frontal gyrus activity during action observation. Neuroimage 40: 298 –307, 2008. Croxson PL, Johansen-Berg H, Behrens TE, Robson MD, Pinsk MA, Gross CG, Richter W, Richter MC, Kastner S, Rushworth MF. Quantitative investigation of connections of the prefrontal cortex in the human and macaque using probabilistic diffusion tractography. J Neurosci 25: 8854 – 8866, 2005. Culham JC, Danckert SL, DeSouza JF, Gati JS, Menon RS, Goodale MA. Visually guided grasping produces fMRI activation in dorsal but not ventral stream brain areas. Exp Brain Res 153: 180 –189, 2003. Denys K, Vanduffel W, Fize D, Nelissen K, Peuskens H, Van Essen D, Orban GA. The processing of visual shape in the cerebral cortex of human and nonhuman primates: a functional magnetic resonance imaging study. J Neurosci 24: 2551–2565, 2004. Fabbri-Destro M, Rizzolatti G. Mirror neurons and mirror systems in monkeys and humans. Physiology 23: 171–179, 2008. Filimon F, Nelson JD, Hagler DJ, Sereno MI. Human cortical representations for reaching: mirror neurons for execution, observation, and imagery. Neuroimage 37: 1315–1328, 2007. Fogassi L, Ferrari PF, Gesierich B, Rozzi S, Chersi F, Rizzolatti G. Parietal lobe: from action organization to intention understanding. Science 308: 662– 667, 2005. Freedman DJ, Assad JA. Experience-dependent representation of visual categories in parietal cortex. Nature 443: 85– 88, 2006. Frey SH, Vinton D, Norlund R, Grafton ST. Cortical topography of human anterior intraparietal cortex active during visually guided grasping. Brain Res Cogn Brain Res 23: 397– 405, 2005. Gallese V, Fadiga L, Fogassi L, Rizzolatti G. Action recognition in the premotor cortex. Brain 119: 593– 609, 1996. Gallese V, Murata A, Kaseda M, Niki N, Sakata H. Deficit of hand preshaping after muscimol injection in monkey parietal cortex. Neuroreport 5: 1525–1529, 1994. Gazzola V, Keysers C. The observation and execution of actions share motor and somatosensory voxels in all tested subjects: single-subject analyses of unsmoothed fMRI data. Cereb Cortex 19: 1239 –1255, 2009. Gazzola V, Rizzolatti G, Wicker B, Keysers C. The anthropomorphic brain: the mirror neuron system responds to human and robotic actions. Neuroimage 35: 1674 –1684, 2007a. Gazzola V, van der Worp H, Mulder T, Wicker B, Rizzolatti G, Keysers C. Aplasics born without hands mirror the goal of hand actions with their feet. Curr Biol 17: 1235–1240, 2007b. Georgieva S, Peeters R, Kolster H, Todd JT, Orban GA. The processing of three-dimensional shape from disparity in the human brain. J Neurosci 29: 727–742, 2009. Georgieva SS, Todd JT, Peeters R, Orban GA. The extraction of 3D shape from texture and shading in the human brain. Cereb Cortex 18: 2416 –2438, 2008. Graziano MS, Aflalo TN. Mapping behavioral repertoire onto the cortex. Neuron 56: 239 –251, 2007. J Neurophysiol • VOL
139
Grezes J, Armony JL, Rowe J, Passingham RE. Activations related to “mirror” and “canonical” neurones in the human brain: an fMRI study. Neuroimage 18: 928 –937, 2003. Hamilton AF, Grafton ST. Action outcomes are represented in human inferior frontoparietal cortex. Cereb Cortex 18: 1160 –1168, 2008. Haxby JV, Gobbini MI, Furey ML, Ishai A, Schouten JL, Pietrini P. Distributed and overlapping representations of faces and objects in ventral temporal cortex. Science 293: 2425–2430, 2001. Holmes AP, Friston KJ. Generalizability, random effects and population inference. Neuroimage 7: S754, 1998. Hyvarinen J. Regional distribution of functions in parietal association area 7 of the monkey. Brain Res 206: 287–303, 1981. Jancke L, Kleinschmidt A, Mirzazade S, Shah NJ, Freund HJ. The role of the inferior parietal cortex in linking the tactile perception and manual construction of object shapes. Cereb Cortex 11: 114 –121, 2001. Jastorff J, Orban GA. Human functional magnetic resonance imaging reveals separation and integration of shape and motion cues in biological motion processing. J Neurosci 29: 7315–7329, 2009. Jeannerod M, Arbib MA, Rizzolatti G, Sakata H. Grasping objects: the cortical mechanisms of visuomotor transformation. Trends Neurosci 18: 314 –320, 1995. Kakei S, Hoffman DS, Strick PL. Muscle and movement representations in the primary motor cortex. Science 285: 2136 –2139, 1999. Kakei S, Hoffman DS, Strick PL. Direction of action is represented in the ventral premotor cortex. Nat Neurosci 4: 1020 –1025, 2001. Kimmig H, Greenlee MW, Gondan M, Schira M, Kassubek J, Mergner T. Relationship between saccadic eye movements and cortical activity as measured by fMRI: quantitative and qualitative aspects. Exp Brain Res 141: 184 –194, 2001. Kroliczak G, Cavina-Pratesi C, Goodman DA, Culham JC. What does the brain do when you fake it? An FMRI study of pantomimed and real grasping. J Neurophysiol 97: 2410 –2422, 2007. Lemon RN, Hanby JA, Porter R. Relationship between the activity of precentral neurones during active and passive movements in conscious monkeys. Proc R Soc Lond B Biol Sci 194: 341–373, 1976. Nelissen K, Luppino G, Vanduffel W, Rizzolatti G, Orban GA. Observing others: multiple action representation in the frontal lobe. Science 310: 332–336, 2005. Nelissen K, Vanduffel W, Orban GA. Charting the lower superior temporal region, a new motion-sensitive region in monkey superior temporal sulcus. J Neurosci 26: 5929 –5947, 2006. Peeters R, Simone L, Nelissen K, Fabbri-Destro M, Vanduffel W, Rizzolatti G, Orban GA. The representation of tool use in humans and monkeys: common and uniquely human features. J Neurosci 29: 11523–11539, 2009. Pelphrey KA, Morris JP, McCarthy G. Grasping the intentions of others: the perceived intentionality of an action influences activity in the superior temporal sulcus during social perception. J Cogn Neurosci 16: 1706 –1716, 2004. Perrett DI, Mistlin AJ, Harries MH, Chitty AJ. Understanding the Visual Appearance and Consequence of Hand Actions. Norwood, NJ: Ablex, 1990. Pierno AC, Tubaldi F, Turella L, Grossi P, Barachino L, Gallo P, Castiello U. Neurofunctional modulation of brain regions by the observation of pointing and grasping actions. Cereb Cortex 19: 367–374, 2009. Porter R, Lemon RN. Corticospinal Function and Voluntary Movement. Oxford, UK: Oxford, 1993. Ress D, Backus BT, Heeger DJ. Activity in primary visual cortex predicts performance in a visual detection task. Nat Neurosci 3: 940 –945, 2000. Rice NJ, Tunik E, Grafton ST. The anterior intraparietal sulcus mediates grasp execution, independent of requirement to update: new insights from transcranial magnetic stimulation. J Neurosci 26: 8176 – 8182, 2006. Rizzolatti G, Camarda R, Fogassi L, Gentilucci M, Luppino G, Matelli M. Functional organization of inferior area 6 in the macaque monkey. II. Area F5 and the control of distal movements. Exp Brain Res 71: 491–507, 1988. Rizzolatti G, Craighero L. The mirror-neuron system. Annu Rev Neurosci 27: 169 –192, 2004. Rizzolatti G, Fadiga L, Gallese V, Fogassi L. Premotor cortex and the recognition of motor actions. Brain Res Cogn Brain Res 3: 131–141, 1996. Rozzi S, Ferrari PF, Bonini L, Rizzolatti G, Fogassi L. Functional organization of inferior parietal lobule convexity in the macaque monkey: electrophysiological characterization of motor, sensory and mirror responses and their correlation with cytoarchitectonic areas. Eur J Neurosci 28: 1569 – 1588, 2008.
104 • JULY 2010 •
www.jn.org
140
JASTORFF ET AL.
Sakata H, Taira M, Murata A, Mine S. Neural mechanisms of visual guidance of hand action in the parietal cortex of the monkey. Cereb Cortex 5: 429–438, 1995. Sakreida K, Schubotz RI, Wolfensteller U, von Cramon DY. Motion class dependency in observers’ motor areas revealed by functional magnetic resonance imaging. J Neurosci 25: 1335–1342, 2005. Sawamura H, Georgieva S, Vogels R, Vanduffel W, Orban GA. Using functional magnetic resonance imaging to assess adaptation and size invariance of shape processing by humans and monkeys. J Neurosci 25: 4294 – 4306, 2005. Shikata E, Hamzei F, Glauche V, Koch M, Weiller C, Binkofski F, Buchel C. Functional properties and interaction of the anterior and posterior intraparietal areas in humans. Eur J Neurosci 17: 1105–1110, 2003. Shmuelof L, Zohary E. A mirror representation of others’ actions in the human anterior parietal cortex. J Neurosci 26: 9736 –9742, 2006. Smith EE, Grossman M. Multiple systems of category learning. Neurosci Biobehav Rev 32: 249 –264, 2008. Taira M, Mine S, Georgopoulos AP, Murata A, Sakata H. Parietal cortex neurons of the monkey related to the visual guidance of hand movement. Exp Brain Res 83: 29 –36, 1990.
J Neurophysiol • VOL
Tunik E, Ortigue S, Adamovich SV, Grafton ST. Differential recruitment of anterior intraparietal sulcus and superior parietal lobule during visually guided grasping revealed by electrical neuroimaging. J Neurosci 28: 13615– 13620, 2008. Umilta MA, Escola L, Intskirveli I, Grammont F, Rochat M, Caruana F, Jezzini A, Gallese V, Rizzolatti G. When pliers become fingers in the monkey motor system. Proc Natl Acad Sci USA 105: 2209 –2213, 2008. Van Essen DC. A population-average, landmark- and surface-based (PALS) atlas of human cerebral cortex. Neuroimage 28: 635– 662, 2005. Van Essen DC, Drury HA, Dickson J, Harwell J, Hanlon D, Anderson CH. An integrated software suite for surface-based analyses of cerebral cortex. J Am Med Inform Assoc 8: 443– 459, 2001. Vanduffel W, Fize D, Peuskens H, Denys K, Sunaert S, Todd JT, Orban GA. Extracting 3D from motion: differences in human and monkey intraparietal cortex. Science 298: 413– 415, 2002. Wheaton KJ, Thompson JC, Syngeniotis A, Abbott DF, Puce A. Viewing the motion of human body parts activates different regions of premotor, temporal, and parietal cortex. Neuroimage 22: 277–288, 2004.
104 • JULY 2010 •
www.jn.org