I'm going to make him an offer he can't refuse. ... Using these notations, a general recommendation algorithm can be for- ...... Maverick and Goose (Top Gun).
University of Li`ege Department of Electrical Engineering and Computer Science
Collaborative filtering Scalable approaches using restricted Boltzmann machines
Author: Gilles L OUPPE
Advisor: Pierre G EURTS
A Master’s thesis submitted in partial fulfillment of the requirements of the M.Sc. degree in Computer Science 2009 – 2010
Contents
List of Figures
3
List of Algorithms
5
Acknowledgements
6
1
Introduction
7
2
Recommendation algorithms 2.1 Framework . . . . . . . . . . . . . . . . . . . 2.2 Taxonomy . . . . . . . . . . . . . . . . . . . 2.3 Popular algorithms . . . . . . . . . . . . . . 2.3.1 Basic neighborhood-based methods 2.3.2 Slope One . . . . . . . . . . . . . . . 2.3.3 Latent factor approaches . . . . . . . 2.3.4 Other techniques . . . . . . . . . . .
. . . . . . .
. . . . . . .
. . . . . . .
. . . . . . .
. . . . . . .
. . . . . . .
. . . . . . .
. . . . . . .
. . . . . . .
. . . . . . .
. . . . . . .
. . . . . . .
. . . . . . .
. . . . . . .
. . . . . . .
10 10 12 14 14 17 20 24
The Netflix Prize 3.1 History . . . . . . . . . . . . . . . . . . . 3.2 Data . . . . . . . . . . . . . . . . . . . . . 3.2.1 Creation of the dataset . . . . . . 3.2.2 Statistics . . . . . . . . . . . . . . 3.2.3 Relevance of the RMSE measure 3.3 Lessons . . . . . . . . . . . . . . . . . . . 3.3.1 Publications . . . . . . . . . . . . 3.3.2 Blending predictions . . . . . . . 3.3.3 Implicit feedback . . . . . . . . .
. . . . . . . . .
. . . . . . . . .
. . . . . . . . .
. . . . . . . . .
. . . . . . . . .
. . . . . . . . .
. . . . . . . . .
. . . . . . . . .
. . . . . . . . .
. . . . . . . . .
. . . . . . . . .
. . . . . . . . .
. . . . . . . . .
. . . . . . . . .
. . . . . . . . .
25 25 28 28 29 32 33 33 33 34
3
. . . . . . . . .
. . . . . . . . .
Contents 4
5
6
Restricted Boltzmann machines 4.1 Boltzmann machines . . . . . . . 4.1.1 Model . . . . . . . . . . . 4.1.2 Learning . . . . . . . . . . 4.2 Restricted Boltzmann machines . 4.2.1 Model . . . . . . . . . . . 4.2.2 Learning . . . . . . . . . . 4.2.3 Illustration . . . . . . . . . 4.3 RBMs for collaborative filtering . 4.3.1 Basic model . . . . . . . . 4.3.2 Learning . . . . . . . . . . 4.3.3 Making recommendations 4.3.4 Conditional RBM . . . . . 4.4 Experimental results . . . . . . . 4.4.1 Implementation . . . . . . 4.4.2 Results . . . . . . . . . . . 4.4.3 Improvements . . . . . . .
2
. . . . . . . . . . . . . . . .
. . . . . . . . . . . . . . . .
. . . . . . . . . . . . . . . .
. . . . . . . . . . . . . . . .
. . . . . . . . . . . . . . . .
. . . . . . . . . . . . . . . .
. . . . . . . . . . . . . . . .
. . . . . . . . . . . . . . . .
. . . . . . . . . . . . . . . .
. . . . . . . . . . . . . . . .
. . . . . . . . . . . . . . . .
. . . . . . . . . . . . . . . .
. . . . . . . . . . . . . . . .
. . . . . . . . . . . . . . . .
36 36 36 38 40 40 41 42 45 45 47 47 48 50 50 52 60
Scalable RBMs 5.1 Shared memory architectures . . . . . . . . . . 5.1.1 Concurrent algorithms . . . . . . . . . . 5.1.2 Results . . . . . . . . . . . . . . . . . . . 5.1.3 The delay effect . . . . . . . . . . . . . . 5.2 Distributed architectures . . . . . . . . . . . . . 5.2.1 MapReduce . . . . . . . . . . . . . . . . 5.2.2 Learning and testing over MapReduce . 5.2.3 Results . . . . . . . . . . . . . . . . . . . 5.3 Ensembles of RBMs . . . . . . . . . . . . . . . . 5.3.1 Ensemble approach . . . . . . . . . . . . 5.3.2 Results . . . . . . . . . . . . . . . . . . .
. . . . . . . . . . .
. . . . . . . . . . .
. . . . . . . . . . .
. . . . . . . . . . .
. . . . . . . . . . .
. . . . . . . . . . .
. . . . . . . . . . .
. . . . . . . . . . .
. . . . . . . . . . .
. . . . . . . . . . .
. . . . . . . . . . .
. . . . . . . . . . .
. . . . . . . . . . .
64 64 65 67 71 72 72 74 78 82 82 83
Summary and future work
. . . . . . . . . . . . . . . .
. . . . . . . . . . . . . . . .
. . . . . . . . . . . . . . . .
. . . . . . . . . . . . . . . .
. . . . . . . . . . . . . . . .
. . . . . . . . . . . . . . . .
. . . . . . . . . . . . . . . .
87
A Source code
89
Bibliography
90
List of Figures
2.1 2.2 2.3 2.4
Example of rating matrix R . . . The neighborhood-based method The Slope One algorithm . . . . . The latent factor approach . . . .
. . . .
. . . .
. . . .
. . . .
. . . .
. . . .
. . . .
. . . .
. . . .
. . . .
. . . .
. . . .
. . . .
. . . .
. . . .
. . . .
. . . .
. . . .
. . . .
. . . .
. . . .
11 15 18 21
3.1 3.2 3.3 3.4 3.5
The Netflix dataset . . . . . . . . . . . . . . Number of users with average ratings of . . Number of movies with average ratings of Number of ratings per user . . . . . . . . . Number of ratings per movie . . . . . . . .
. . . . .
. . . . .
. . . . .
. . . . .
. . . . .
. . . . .
. . . . .
. . . . .
. . . . .
. . . . .
. . . . .
. . . . .
. . . . .
. . . . .
. . . . .
26 30 31 31 32
4.1 4.2 4.3 4.4 4.5 4.6 4.7 4.8 4.9 4.10 4.11 4.12 4.13 4.14 4.15
A Boltzmann machine . . . . . . . . . . . . . . . . . . . . A restricted Boltzmann machine . . . . . . . . . . . . . . Contrastive divergence learning . . . . . . . . . . . . . . . Distribution of patterns . . . . . . . . . . . . . . . . . . . . Fantasies of restricted Boltzmann machines . . . . . . . . Reconstructions of incomplete and scrambled patterns . Weights of a restricted Boltzmann machine . . . . . . . . Restricted Boltzmann machine for collaborative filtering Conditional restricted Boltzmann machine . . . . . . . . Default parameters (Generalization error) . . . . . . . . . Default parameters (Training error) . . . . . . . . . . . . . Effect of the learning rate (Generalization error) . . . . . Effect of the learning rate (Training error) . . . . . . . . . Momentum heuristic (Generalization error) . . . . . . . . Momentum heuristic (Training error) . . . . . . . . . . . .
. . . . . . . . . . . . . . .
. . . . . . . . . . . . . . .
. . . . . . . . . . . . . . .
. . . . . . . . . . . . . . .
. . . . . . . . . . . . . . .
. . . . . . . . . . . . . . .
. . . . . . . . . . . . . . .
37 40 42 42 43 44 45 46 49 55 55 56 56 57 57
List of Figures
4
4.16 4.17 4.18 4.19 4.20 4.21 4.22 4.23
Effect of the size of mini-batches (Generalization error) . . . Effect of the size of mini-batches (Training error) . . . . . . . Effect of the number of hidden nodes (Generalization error) Effect of the number of hidden nodes (Training error) . . . . Weight decay heuristic (Generalization error) . . . . . . . . . Weight decay heuristic (Training error) . . . . . . . . . . . . . Annealing heuristic (Generalization error) . . . . . . . . . . . Annealing heuristic (Training error) . . . . . . . . . . . . . .
. . . . . . . .
. . . . . . . .
. . . . . . . .
. . . . . . . .
. . . . . . . .
58 58 59 59 62 62 63 63
5.1 5.2 5.3 5.4 5.5 5.6 5.7 5.8 5.9 5.10 5.11
Speedup of the learning algorithm . . . . . . . . . . . . . Parallel efficiency of the learning algorithm (I) . . . . . . Parallel efficiency of the learning algorithm (II) . . . . . . The delay effect . . . . . . . . . . . . . . . . . . . . . . . . MapReduce operation flow . . . . . . . . . . . . . . . . . Speedup of the learning algorithm (MapReduce) . . . . . Parallel efficiency of the learning algorithm (MapReduce) Convergence of the learning algorithm (MapReduce) . . Accuracy of ensembles of RBMs (I) . . . . . . . . . . . . . Accuracy of ensembles of RBMs (II) . . . . . . . . . . . . Accuracy of ensembles of RBMs (III) . . . . . . . . . . . .
. . . . . . . . . . .
. . . . . . . . . . .
. . . . . . . . . . .
. . . . . . . . . . .
. . . . . . . . . . .
69 69 70 71 75 80 80 81 85 85 86
. . . . . . . . . . .
. . . . . . . . . . .
List of Algorithms
2.1 2.2 2.3 2.4 2.5 4.1 4.2 4.3 4.4 4.5 4.6 5.1 5.2 5.3 5.4 5.5 5.6 5.7 5.8
General recommendation algorithm . . . . . . . Neighborhood-based algorithm . . . . . . . . . . Slope One . . . . . . . . . . . . . . . . . . . . . . Matrix factorization - Stochastic gradient descent Matrix factorization - Alternating least squares . BM - Positive phase . . . . . . . . . . . . . . . . . BM - Negative phase . . . . . . . . . . . . . . . . RBM - Contrastive divergence . . . . . . . . . . . RBM - Making recommendations . . . . . . . . . RBM - Learning algorithm . . . . . . . . . . . . . RBM - Test algorithm . . . . . . . . . . . . . . . . RBM - Learning algorithm (Multi-threaded) . . . RBM - Test algorithm (Multi-threaded) . . . . . . MapReduce - Counting words (map) . . . . . . . MapReduce - Counting words (reduce) . . . . . MapReduce - Learning algorithm (map) . . . . . MapReduce - Learning algorithm (reduce) . . . . MapReduce - Test algorithm (map) . . . . . . . . MapReduce - Test algorithm (reduce) . . . . . . .
. . . . . . . . . . . . . . . . . . .
. . . . . . . . . . . . . . . . . . .
. . . . . . . . . . . . . . . . . . .
. . . . . . . . . . . . . . . . . . .
. . . . . . . . . . . . . . . . . . .
. . . . . . . . . . . . . . . . . . .
. . . . . . . . . . . . . . . . . . .
. . . . . . . . . . . . . . . . . . .
. . . . . . . . . . . . . . . . . . .
. . . . . . . . . . . . . . . . . . .
. . . . . . . . . . . . . . . . . . .
. . . . . . . . . . . . . . . . . . .
12 17 20 22 23 39 39 41 48 51 51 66 67 74 74 77 77 78 78
Acknowledgments
First and foremost, I would like thank my advisor, Pierre Geurts, for his precious advices, guidance and support. I would also like to thank him for the freedom he granted me in this work and for the proofreading of this text. Second, I want to thank the technical team in charge of the NIC3 supercomputer for the access they granted me. More particularly, my thanks go to David Colignon for his assistance and technical advices. Finally, I would like to warmly thank my professors, the scientific members of the Montefiore Institute and all my friends for the great last five years I spent as a student at the University of Li`ege. Gilles Louppe Li`ege May 27, 2010
Chapter 1
Introduction Go ahead, make my day. Harry Callahan (Sudden Impact)
Within the last decade, the emergence of electronic commerce and other online environments has made the issue of information search and information selection increasingly serious. Users are overwhelmed by thousands of possibilities (e.g., items to buy, music to listen or movies to watch) and they may not have the time or the knowledge to identify those they might be interested in. This is exactly the problem that recommender systems are trying to solve: help users find items they might like by making automatic but personal recommendations. Amazon’s Customers Who Bought This Item Also Bought algorithm [42] for recommending books and other items is certainly one of the most famous recommender systems. Other famous examples include recommending movies (at Netflix, at MovieLens), recommending music (at Last.fm) or even recommending news (at Google News [20]). Because of the broad range of applications they can be used for, and especially because of the potential financial gains they represent, recommender systems are a very active field of research, both in the industry and in the academic world. The underlying theory and algorithms are however still quite young. The first publication on the subject indeed only dates back from the mid-1990s, which coincides with the emergence of the Internet. Recommender systems should definitely not be seen as some kind of gadgets that only the biggest online companies can afford. On the contrary, they have become very important and powerful tools for most of online stores. Some of those have even based most of their business model on the success of the recommender systems they use. The US DVD rental and Video On Demand company Netflix is one of the most telling examples [55]. When they opened business back in 1997, recommending movies was not a big issue. They had stocked only 1000 titles or so and customers could browse the entire catalogue pretty quickly. However, Netflix grew over the years and stocks today more than 100000 titles. At that scale, a recommendation system becomes critical. As the CEO of Netflix, Reed Hastings, says ”People have limited cognitive time they want to spend on picking a movie”.
8 In 2000, Netflix introduced Cinematch, its own recommendation system. The first version worked very poorly but it improved over time, as the programmers tried new ideas and finely tuned their algorithm. It has actually become so effective that it now drives a surprising 60% of Netflix’s rentals. What is interesting is that the system do not simply consist in suggesting the latest blockbusters. On the contrary, smaller or independent movies are often proposed to customers, which has the effect of steering them away from the lastly released big-grossing hits. Incidentally, their recommendation system do not only help people find new stuff, it also conduces them to consume more. In the business model of Netflix, this is critical. Customers pay a flat monthly fee, usually around 16$, to watch as many movies as they want. The problem with that strategy is that new members have usually a dozen of movies in mind that they want to see, but as soon as they have watched what they wanted, they do not know what to check next and their requests slow down. But a customer paying 16$ to watch only one or two movies a month is very likely to cancel his subscription. That model only makes sense if you rent a lot of movies. This is exactly where Cinematch comes into play. It helps customers getting the most of their membership. The better the predictions, the more they’ll enjoy the movies they watch and the longer they’ll keep their subscriptions. Despite great success in e-commerce, recommender systems are by no means a mature technology. Many key challenges still have to be addressed. One of those challenges is scalability [52]. With the tremendous growth of customers and products, recommender systems are faced with many recommendations to produce per second, for millions of customers and products. At the same time, the quality of recommendations has to remain sufficiently high to help users find anything they might like. They need recommendations they can trust. Indeed, if some user purchases some product he was recommended and then finds out that he doesn’t like it, then he is very unlikely to trust the system again. The problem is that most of recommendation algorithms have not been designed with that large-scale constraint in mind, which may indirectly affect the quality of recommendations. The more the user and/or the product base grows, the longer it takes for those algorithms to produce good-quality recommendations. A corollary of this is that the less time these algorithms have to make recommendations, the worse the recommendations become. In other words, the challenge is to make recommendations that are both relevant and practical. In that context, the object of this work is threefold. The first part consists in a survey of recommendation algorithms and emphasizes on a class of algorithms known as collaborative filtering algorithms. The second part consists in studying in more depth a specific model of neural networks known as restricted Boltzmann machines and see how it can be used to make recommendations. The third part of this work
9 focuses on how that algorithm can be made scalable. Three different and original approaches are proposed and studied. The rest of this text is organized as follows. Chapter 2 introduces a taxonomy of recommendation algorithms and then examines in some more depth the most popular approaches. A slight digression is then made in chapter 3 to give an overview of the Netflix Prize and of its implications on recommendation algorithms. Chapter 4 introduces Restricted Boltzmann Machines. A deep study of the inner workings of that class of models is presented. It is then experimentally evaluated on a recommendation problem. Three different and original approaches are then identified in chapter 5 to make that model more scalable. For all three, the impact on the quality of recommendations is discussed as well as the gains in terms of computing times. Finally, chapter 6 gathers the conclusions of this work.
Chapter 2
Recommendation algorithms I’m going to make him an offer he can’t refuse. Don Vito Corleone (The Godfather)
This chapter presents a review of the state of the art of recommendation algorithms. It first introduces in section 2.1 a general framework in which the problem of making recommendations can be formulated. Section 2.2 presents a taxonomy of recommender systems. The inner workings of the most popular collaborative filtering algorithms are then introduced in section 2.3.
2.1
Framework
The problem of making automatic recommendations usually takes place in a context where items of some sort (e.g., movies or books) are rated by a set of users (e.g., customers). In its most common form, the recommendation problem is often reduced to the problem of predicting the ratings for the items that have not been rated by a user. Depending on the algorithm, these predictions are computed based on the ratings given by that user to other items, on the ratings of like-minded users and/or on some other sources information. Once these estimations have been computed, the items with the highest predicted ratings can be picked as recommendations to the user. More formally, the recommendation problem can be formulated as introduced in [2]. Let U be the set of users and I be the set of all possible items. Let also r be a utility function that measures the usefulness of item i to user u, i.e., r : U × I → V , where V is a totally ordered set (e.g., non-negative integer values or real values within a given range). Then, for each u ∈ U , the recommendation problem consists in finding the item i∗ that maximizes the utility of u, i.e.: i∗ = arg max r(u, i) i∈I
In most cases, the utility of an item is represented as a rating, that is an integer value which indicates how much a particular user liked or disliked that particular item.
2.1. Framework
11
Escape From Alcatraz
K-Pax
Shawshank Redemption
Usual Suspects
Alice Bob Clint Dave Ethan
Avatar
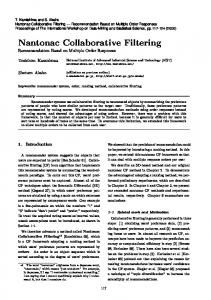
For instance, in the case of movies, Alice might have given the rating of 1 (out of 5) to the movie Avatar. Note however that r can be any arbitrary function. What makes the recommendation problem so difficult is that r is not defined on the whole U × I space, but only on some subset of it. In other words, the challenge behind making recommendations is to extrapolate r to the rest of that space. To make things worse, the size of the subspace where r is known is usually very small in comparison with the size of the unknown region. Yet, recommendations should be useful even when the system includes a small number of examples. In addition, the size of U and I might range from a few hundreds of elements to millions in some applications. For scalability reasons, this shouldn’t be lost of sight.
1 3 ? 5 4
2 ? ? ? ?
? 2 ? 4 1
5 5 ? 4 1
4 3 2 5 ?
R(u,i)
R(u)
R(i)
Figure 2.1: Example of rating matrix R In case of ratings, r can be represented as a matrix R, as depicted in figure 2.1. In that case, the recommendation problem boils down to predict unknown values of R. The set of ratings given by some user u will be represented by an incomplete array R(u), while the rating of u on some item i will be denoted R(u, i). Note that this value may be unknown. The subset of items i ∈ I actually rated by u is I(u). The number of items in that set is denoted |I(u)|. Similarly, the set of ratings given to some item i will be represented by an incomplete array R(i). The subset of users u ∈ U which have actually rated i is noted U(i). The number of items in that set is
2.2. Taxonomy
12
|U(i)|. The average rating of user u and of item i will be respectively denoted R(u) and R(i). Using these notations, a general recommendation algorithm can be formulated as shown in algorithm 2.1. Note that how the actual predictions of R(u, i) are computed is left undefined for now. Also, an alternative formulation might be to consider the Top-N recommendations instead of suggesting a single item. Algorithm 2.1 General recommendation algorithm Inputs: a user u Outputs: an item i∗ to be recommended 1. For all unrated items i of user u, compute a prediction R(u, i) using some algorithm. 2. Recommend the item i∗ with the highest prediction.
2.2
Taxonomy
The unknown ratings of the matrix R can be predicted in various ways. Many techniques have been investigated, including machine learning approaches, approximation theory and various heuristics. It is common to classify recommender systems according to the strategy they use to make recommendations. Two different paradigms are usually cited in the literature [2, 7]: content-based approaches and collaborative filtering algorithms. • In content-based approaches, the user is recommended items similar to the ones he liked in the past. That class of algorithms stems from information retrieval and uses many of its techniques. Formally, the estimation of R(u, i) is based on the ratings R(u, ik ) assigned by user u for the items ik ∈ I(u) that are somehow similar to item i. The similarity of two items is computed based on their profiles, that is on the content information of these items. For instance, in a news recommender system, recommendations are made based on the textual content of the articles to be suggested to the user. An example of similarity measure that is often used in that context is the term frequency / inverse document frequency (TF-IDF) measure. In the case of movies, contentbased recommender systems try to discover common characteristics between the movies that have been liked the most by u (e.g., a specific list of actors, a genre, a subject of matter). Based on that knowledge, the movies with the
2.2. Taxonomy
13
highest degree of similarity are suggested to user u. Note that in some algorithms, the actual profile of u might also be taken into account. • By contrast, collaborative filtering algorithms do not take into account any content information. In addition, rather than recommending items similar to the ones a user u liked in the past, the user is recommended items that similar users liked. This is based on the assumption that people who liked the same things are likely to feel similarly towards other things. Formally, the estimation of R(u, i) is based on the ratings R(uk , i) assigned by the set of users uk ∈ U which are similar to u and which have rated the item i. For instance, in order to recommend movies, a recommender system would try to find users that have similar taste (i.e., users who rate movies similarly) and then recommend the ones they liked the most. What also distinguish pure collaborative filtering algorithms from content-based approaches is that the only information they know about an item is a unique identifier. Recommendations for a user are made solely on the basis of similarities to other users. Profiles are not taken into account at all. In a sense, this property makes them more general since they can be applied to any problem that can be cast into a recommendation problem (c.f., section 2.1). Yet, at the same time, this generality makes them completely useless to recommend items to new users or to recommended items which have never been rated. This is the cold start problem. Recommender systems are of course not strictly bound to one of these two categories. Hybrid approaches combining content-based and collaborative filtering are practicable (e.g., [7]). In that case, linear combinations and/or various voting schemes are usually used to blend together the predicted ratings. Collaborative filtering techniques have been extensively studied. Many algorithms have been proposed since the emergence of recommender systems. These approaches are usually [14] partitioned into two categories: memory-based approaches and model-based approaches. • The strategy of memory-based algorithms, also known as neighborhood-based methods, is to use the entire set R of ratings to make recommendations. First, these algorithms employ various statistical techniques and heuristics to identify a set N (u) of users similar to u, known as neighbors. Once that set of neighbors is formed, the prediction is computed as an aggregate of their ratings, i.e., R(u, i) = h({R(uk , i)|uk ∈ N (u)}) where h is some aggregation function. In the simplest cases, ratings are (weightily) averaged. A possible drawback of memory-based methods is that they are
2.3. Popular algorithms
14
generally quite sensitive to data sparseness. In order to be relevant, the similarity measure on which they are based indeed often requires that a critical mass of users have entered some minimum number of ratings. In addition, these methods often suffer from scalability issues. • Model-based algorithms were first proposed to solve some of the shortcomings of memory-based methods. The approach behind model-based algorithms consists in learning a model on the ratings R and then to use it to make predictions. The underlying objective is to identify complex patterns in the data and to make use of it to generate intelligent recommendations. Model-based algorithms uses techniques from linear algebra (SVD, PCA) or techniques borrowed from the machine learning community (Bayesian models, clustering models, neural networks). They usually perform better than memory-based algorithms and are typically faster at query time. On the other hand, model-based techniques might require expensive learning or updating time.
2.3 2.3.1
Popular algorithms Basic neighborhood-based methods
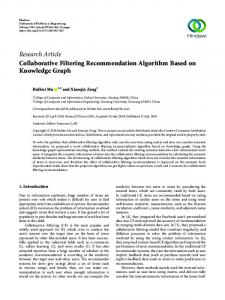
As introduced earlier in section 2.2, neighborhood-based methods (sometimes known as kNN) operate in two steps. First, the system identifies a subset of users, called neighbors, who liked the same items as u. Second, their ratings are aggregated to estimate the rating that u would give to the item i. Repeating that process over every unrated item, the system can then pick the one with the highest estimation, as shown in the example of figure 2.2. Formally, the first step of neighborhood-based algorithms consists in building a subset N (u) ⊂ U(i) containing the n most similar users to u. The similarity of two users u1 and u2 , denoted w(u1 , u2 ), can be seen as some kind of distance measure. It will essentially be used as a weight to differentiate between levels of user similarity. The motivation is that the closer uk is from u, the more his rating R(uk , i) should weight in the prediction of R(u, i). The two most used measures in recommender systems are correlation-based and cosine-based similarities. Among correlation-based measures, the Pearson correlation measure is undoubtedly one of its most popular and accurate representatives [49, 53, 2]. Its purpose is to measure the extent to which two variables (i.e., two users)
2.3. Popular algorithms
15
Bob
Alice
Clint
Ed
Figure 2.2: The neighborhood based method. Say that Alice has a crush on Russel Crowe and liked the three movies on the left. To make a recommendation for her, the recommender system first identifies similar users who also liked those movies. Then, the movies they all liked are recommended. In that case, Alice is recommended American Gangster. linearly relate with each other: P i∈C (R(u1 , i) − RC (u1 ))(R(u2 , i) − RC (u2 )) qP w(u1 , u2 ) = qP 2 2 i∈C (R(u1 , i) − RC (u1 )) i∈C (R(u2 , i) − RC (u2 ))
(2.1)
where C is the set of co-rated items I(u1 ) ∩ I(u2 ) and RC (uk ) is the average rating of user uk over the items in C. By contrast, the cosine-based similarity measure estimates the similarity of two users by computing the cosine of the angle between their corresponding vector representation: ~ ~ ~ C (u1 ), R ~ C (u2 )) = RC (u1 ) • RC (u2 ) w(u1 , u2 ) = cos(R ~ C (u1 )kkR ~ C (u2 )k kR
(2.2)
~ C (uk ) is the vector of ratings of uk over the co-rated items in C and where • where R denotes the dot product of the two vectors. Even though it might work well in some cases, a flaw of the cosine measure is that it cannot take into account the fact that different users may use different rating scales. Some users might indeed consider that a rating of 3 (out of 5) is fair while some others might find that it is too harsh.
2.3. Popular algorithms
16
That issue can however be easily addressed by subtracting the corresponding user average to each co-rated pair. Interestingly, this adjusted cosine similarity measure is then exactly equivalent to the Pearson correlation measure [53]. Besides Pearson correlation and cosine similarity, many other measures have been proposed in the literature. Examples include Spearman rank correlation or probability-based similarity measures. Once the n nearest neighbors of u have been identified, the second step of the algorithm is to compute the actual prediction of R(u, i). The common strategy is to aggregate the ratings of uk ∈ N (u) using one of the following schemes: R(u, i) =
1 |N (u)|
P R(u, i) =
X
uk ∈N (u)
P
w(u, uk )R(uk , i)
uk ∈N (u)
P R(u, i) = R(u) +
R(uk , i)
|w(u, uk )|
w(u, uk )(R(uk , i) − R(uk )) P uk ∈N (u) |w(u, uk )|
nk ∈N (u)
(2.3)
uk ∈N (u)
(2.4)
(2.5)
The simplest aggregation scheme is to average the neighbor ratings, as defined in equation 2.3. A more effective scheme consists in computing a weighted average of the ratings, as shown by equation 2.4. That way, the ratings of the closest neighbors are more prevailing than the others. Still, both of these schemes might suffer from the fact that users may not use the same ratings scale (just like the cosine similarity measure). Equation 2.5 tries to address this limitation. Instead of using the absolute values of ratings, that approach computes a weighted sum of the deviations from the average rating of each neighbor. The aggregated deviation is then added to the average rating of u to obtain the final prediction. Many extensions have been proposed to improve this algorithm. The most popular and effective are default voting, inverse user frequency and case amplification. Default voting [14] tries to address the problem of extreme sparseness. It was indeed observed that memory-based methods do not perform very well whenever there are relatively few known ratings; the similarity measures becoming unreliable. Yet, it was shown that the performances could improve if some default value was assumed in place of the missing ones. Inverse user frequency [54] tries to deal with universal items. The idea is that items that have been rated by almost everyone may not be as relevant than the items rated by smaller groups of users. In practice, inverse user frequency can be defined as |U | ) (2.6) f (i) = log( |U(i)|
2.3. Popular algorithms
17
and then taken into account by premultiplying every value R(u, i) by f (i). As for case amplification [14], it refers to an heuristic which tries to reduce noise in the data. The approach consists in emphasizing high weights and penalizing lower ones: w(u1 , u2 )0 = w(u1 , u2 )|w(u1 , u2 )|ρ−1
(2.7)
where ρ is the case amplification power, typically 2.5. For instance, if w(u1 , u2 ) is high, say 0.9, then it remains high (0.92.5 ≈ 0.76), while if it is low, say 0.1, then it becomes negligible (0.12.5 ≈ 0.003). While the above methods compute similarities between users to make recommendations, the dual approach is actually as practical. Accordingly, rather than identifying similar users, the same techniques can be used to identify a set of similar items N (i) and then to predict ratings from them. In practice, empirical evidence has shown that item-based approaches provide comparable or even better performance than user-based algorithms. The recommender system at Amazon.com is an example of item-based algorithm [42]. Algorithm 2.2 Neighborhood-based algorithm Inputs: a user u, an item i, a maximum number of neighbors n Outputs: an estimation of R(u, i) 1. For performance issues, pick a similarity measure w (e.g., formula 2.1 or 2.2) and precompute w(u1 , u2 ) for all pairs of users. 2. Find the n most similar neighbors of u, N (u). 3. Aggregate the ratings of uk ∈ N (u) using either formula 2.3, 2.4 or 2.5.
2.3.2
Slope One
Neighborhood-based algorithms presented previously are arguably the simplest methods to make recommendations. In this section, a slightly more elaborate scheme called Slope One [41] is introduced. It is known to be one of the simplest to understand, but yet effective, item-based algorithms. Before diving into the logic of the algorithm, let’s first consider a concrete example (inspired from [46]). Say you are discovering the filmography of Quentin Tarantino. On average, people who liked Reservoir Dogs also liked Pulp Fiction, but they tend to like the latter a bit more. Let’s assume most people would give a rating of 3 (out of 5) to Reservoir Dogs and a rating of 4 to Pulp Fiction. Say you didn’t enjoy Reservoir Dogs very much and gave it a rating of 2. Then, one might reasonably
2.3. Popular algorithms
Reservoir Dogs
Pulp Fiction
Kill Bill
18
3 3
4 4
4 4
2
?
4
? = ((2 + (4-3)) + (4 + (4 - 4))) / 2 = (3 + 4) / 2 = 3.5 Figure 2.3: The Slope One algorithm guess that you would give a rating of 3 to Pulp Fiction, i.e., one more than Reservoir Dogs. This is the principle used at the core of Slope One. Predictions R(u, i) are computed based on the average differences between the ratings of i and the ratings of the other items of u. Say now that people who liked Pulp Fiction also liked Kill Bill and gave it on average a rating of 4. Let’s also assume that this time you liked Kill Bill and gave it a rating of 4. Based on Reservoir Dogs, the prediction was that you’d give a rating of 3 to Pulp Fiction. By contrast, based on Kill Bill, one might say that you’d give it a rating 4. By averaging the two predictions, the final prediction given by Slope One is 3.5. Figure 2.3 illustrates that example. More formally, the motivation behind the Slope One algorithm is the following. Let u1 and u2 be two arbitrary users and assume for simplicity that I(u2 ) ⊂ I(u1 ). We search for the best linear predictor, i.e., the most accurate linear function of the form R(u2 , i) = mR(u1 , i) + b, ∀i ∈ I(u2 ), to predict the ratings of u2 from those of u1 . Fixing m to 1 (hence the name of the algorithm) and minimizing the total P quadratic error i∈I(u2 ) (R(u1 , i) + b − R(u2 , i))2 , it comes that: P b=
i∈I(u2 )
R(u2 , i) − R(u1 , i) |I(u2 )|
(2.8)
Put differently, the optimal value for b is simply the average difference between the ratings of u2 and those of u1 . Driven by equation 2.8, let’s then consider the
2.3. Popular algorithms
19
average difference of ratings between items i2 and i1 : P u∈U (i1 ,i2 ) R(u, i2 ) − R(u, i1 ) δ(i2 , i1 ) = |U(i1 , i2 )|
(2.9)
where U(i1 , i2 ) = U(i1 ) ∩ U(i2 ). Given equation 2.9, R(u, ik ) + δ(i, ik ) is a prediction of R(u, i). It means that if the average difference of ratings between i and ik is δ(i, ik ) and if u gave a rating of R(u, ik ) to ik , then one might guess that his rating towards i would be R(u, ik ) + δ(i, ik ). Combining all these predictions together by taking the average over all the items rated by u, the Slope One algorithm summarize to: P ik ∈L(u,i) R(u, ik ) + δ(i, ik ) R(u, i) = (2.10) |L(u, i)| where L(u, i) = {ik |ik ∈ I(u), i 6= ik , |U(i, ik )| > 0}, that is the list of items shared with at least another user. In practice, this version of the Slope One algorithm can be reformulated into a simpler expression. Indeed, when data is dense enough, U(i, ik ) is almost always non-empty, which means that L(u, i) = I(u) when i ∈ / I(u) and L(u, i) = I(u)/{i} when i ∈ I(u). Then, since R(u) =
X R(u, ik ) ≈ |I(u)|
ik ∈I(u)
X ik ∈L(u,i)
R(u, ik ) |L(u, i)|
for almost all i, equation 2.10 can be approximated by: P ik ∈L(u,i) δ(i, ik ) R(u, i) = R(u) + |L(u, i)|
(2.11)
It is quite intriguing to note that the last formulation of the Slope One algorithm does not directly take into account how the user actually rated individual items. Rather, formula 2.11 only depends on the user average rating and on his list of items. Alternatively, equations 2.10 and 2.11 can be rewritten in order to take into account the number of ratings merged into the predictors. It is indeed intuitively safer to give more credit to a predictor based on thousands of ratings than to a predictor based on a couple dozen of ratings. Including this heuristic into equation 2.10, a weighted version of the algorithm can be defined as: P ik ∈L(u,i) (R(u, ik ) + δ(i, ik ))|U(i, ik )| P (2.12) R(u, i) = ik ∈L(u,i) |U(i, ik )|
2.3. Popular algorithms
20
Algorithm 2.3 Slope One Inputs: a user u, an item i Outputs: an estimation of R(u, i) 1. For performance issues, precompute δ(i1 , i2 ) for all pairs of items. 2. Find the list of items ik 6= i, L(u, i), shared with at least another user. 3. Compute R(u, i) using either formula 2.10, 2.11 or 2.12.
2.3.3
Latent factor approaches
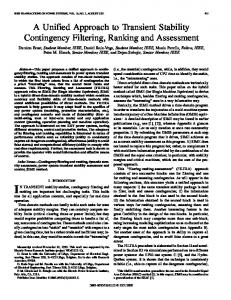
The collaborative filtering methods presented so far are quite intuitive and easy to implement. Even though they sound credible and actually work quite well in practice, most of them are based on heuristics which are sometimes not so well justified. In this section, a more theoretically founded approach called latent factor models and issued from the machine learning community is introduced. Latent factor approaches form a class of model-based collaborative filtering algorithms. The idea is to try to explain the ratings observed in R by characterizing both users and items with latent factors inferred from the ratings patterns [37]. In a sense, these factors might be viewed as a sequence of genes, each one of them encoding how much the corresponding characteristic is expressed. For instance, in the case of movies (c.f., figure 2.4), factors might relate to obvious characteristics such as overall quality, whether it’s an action movie or a comedy, the amount of action, or to more abstract traits such as a subject of matter. In many cases, they might also relate to completely uninterpretable characteristics. Likewise, user’s preferences can be roughly described in terms of whether they tend to rate high or low, whether they prefer action movies or comedies, the amount of action they tend to prefer and so on. In that context, the bet is that a user’s rating of a movie can be defined as a sum of preferences with respect to the various characteristics of that movie. Note also that these factors are not defined by hand like in content-based methods, but are rather algorithmically learned by the system. The two main representatives of that class of algorithms are restricted Boltzmann machines and models based on matrix factorization techniques, such as singular value decomposition (SVD, and also known as latent semantic indexing in some contexts). Since chapter 4 and subsequent chapters will be entirely dedicated to the former, focus will be given in this section to matrix factorization algorithms. Formally, the principle of matrix factorization-based models is to project both users and items into a joint latent factor space of dimensionality f , such that user-
2.3. Popular algorithms
21 Drama Ed
Alice
Female-oriented
Male-oriented Bob
Clint
Comedy
Figure 2.4: The latent factor approach. Movies and users are projected into a space whose dimensions measure the characteristics of movies and user’s interest in these characteristics. In this simplified example, movies and users are projected along two axis. The first axis corresponds to whether a movie is more female- or maleoriented while the second corresponds to whether a movie is more a drama or a comedy. It also shows where users lie in that space. From this example, one might say that Alice would love Pride and Prejudice while she’d hate Beverly Hills Cop. Note that some movies, such a SiCKO, or some users, such like Bob, might be seen as fairly neutral with respect to these dimensions item interactions are modelled as inner products in that space [37]. In other words, each user u is associated to a vector of factors P (u) ∈ Rf while each item i is associated to a vector of factors Q(i) ∈ Rf . The elements of Q(i) measure the level of expression of the corresponding features in item i while the elements of P (u) measure the interest of u in these characteristics. The dot product of these two vectors represents the overall interest of user u in item i, which is nothing else than R(u, i): R(u, i) = P (u)T Q(i)
(2.13)
In that context, learning a latent factor model boils down to search for the best mapping between the user-item space and Rf . In matrix terms, P (u) and Q(i) can respectively be aggregated into a matrix P of format |U | × f and a matrix Q of
2.3. Popular algorithms
22
format |I| × f . The k-th row of P corresponds to P (uk ) while the k-th row of Q corresponds to Q(ik ). Put differently, the goal is to find P and Q such that P QT is an approximation as close as possible to R. Technically, this formulation of the problem amounts to minimize the prediction error of the model on some training set S containing (u, i)-pairs for which R(u, i) is known: X min Err = (RS (u, i) − P (u)T Q(i))2 (2.14) (u,i)∈S
In practice, solving directly equation 2.14 might lead to models with good results on the training data but with poor performance in generalization. Since the final objective is to predict unknown ratings, a critical issue is to avoid overfitting the model to the data it is trained on. To this end, the model can be regularized using ridge regression. As a consequence, equation 2.14 is replaced with: X min Err = (RS (u, i) − P (u)T Q(i))2 + λ(kP (u)k2 + kQ(i)k2 ) (2.15) (u,i)∈S
Dozens of approaches can be used to solve the optimization problem of equation 2.15. In the context of collaborative filtering, two methods have become popular: stochastic gradient descent first proposed by [23] and alternating least squares introduced by [10]. Algorithm 2.4 Matrix factorization - Stochastic gradient descent Inputs: a training set S, a learning rate γ Outputs: two matrices P and Q such that RS ≈ P QT Initialize P and Q with zeroes or random values; n := 0; Compute the prediction error Errn at iteration n; repeat for (u, i) ∈ S do E(u, i) := RS (u, i) − P (u)T Q(i); Q0 (i) := Q(i); Q(i) := Q(i) + γ(E(u, i)P (u) − λQ(i)); P (u) := P (u) + γ(E(u, i)Q0 (i) − λP (u)); end for n := n + 1; Compute the prediction error Errn at iteration n; until |Errn − Errn−1 | < �
2.3. Popular algorithms
23
Algorithm 2.5 Matrix factorization - Alternating least squares Inputs: a training set S, a learning rate γ Outputs: two matrices P and Q such that RS ≈ P QT Initialize P and Q with zeroes or random values; n := 0; Compute the prediction error Errn at iteration n; repeat Fix P . Solve for Q by minimizing the objective function 2.14 Fix Q. Solve for P by minimizing the objective function 2.14 n := n + 1; Compute the prediction error Errn at iteration n; until |Errn − Errn−1 | < �
The logic of the stochastic gradient descent approach (c.f. algorithm 2.4) consists in looping through the training data and updating P and Q after each training case. At each step, the parameters of the model are updated by small increases proportional to some learning rate in the opposite direction of the gradient of the objective function. The algorithms either stops after a fixed number of cycles through the whole dataset, or as soon as no more improvement is observed. In practice, this approach is quite easy to implement and usually displays fast training time. In fact, equation 2.15 is difficult to solve because both P (u)’s and Q(i)’s are unknowns, which means that the problem is not convex and may not be solvable efficiently. However, when either P or Q is fixed, the problem becomes quadratic and can be solved optimally. The strategy of the alternating least squares (c.f., algorithm 2.5) then simply consists in first fixing P , solving for Q, then fixing Q, solving for P , and so on. This ensures that at each step the prediction error is reduced. The guiding principle of this latent-factor model is that ratings are the result of interactions between users and items. However, in typical collaborative filtering data, much of the observed variation in rating values is not due to such interactions but rather on independent effects, called biases, and associated with either users or items. For instance, some users may have a tendency to give higher ratings than others. Similarly, some items may have a inherent tendency to receive higher or lower ratings. Accordingly, it may in fact look a bit overoptimistic to explain the full rating value by an interaction of the form P (u)T Q(i). To tackle this problem, [37] proposed to break the rating value into four components: R(u, i) = µ + B(i) + B(u) + P (u)T Q(i)
(2.16)
where µ is the global average rating, B(i) is the bias of item i and B(u) the bias of
2.3. Popular algorithms
24
user u. Their idea is that this decomposition should allow for each component to explain only the portion of the rating value it might be accounted for. What is more interesting is that the system can learn this new formulation within the same framework. Indeed, the optimisation problem of equation 2.15 becomes the one of equation 2.17 and can still be solved using either stochastic gradient ascent or alternating least squares. This flexibility is actually one of the biggest advantages of the model. Application-specific factors are usually not difficult to integrate. As a result, many small other improvements of that kind have actually also been introduced. X min Err = (RS (u, i) − µ − B(u) − B(i) − P (u)T Q(i))2 (2.17) (u,i)∈S
+ λ(kP (u)k2 + kQ(i)k2 + B(u)2 + B(i)2 )
2.3.4
Other techniques
Neighborhood and latent factors-based approaches have clearly become the most used and the most effective techniques to build recommender systems. Still, many other approaches have been proposed in the literature within the last decade, with various success. Bayesian models is one of those attempts. The central idea in this approach is to assume that users can be partitioned into groups which share the same ratings probability distribution. This leads to a predictive distribution of missing ratings based on the posterior distribution of the groupings and associated ratings probabilities [18]. Clustering techniques issued from the machine learning community were also proposed [47, 52] as an intermediate step to group users or items together. Some others also tried to apply neural networks [45] or decision trees [14] on the recommendation problem. In addition to pure methods, many hybrid approaches combining ideas of different techniques have also been introduced. Extensive surveys covering the main and the more exotic collaborative filtering techniques can be found in [53, 2]. Finally, let’s also note that an alternative formulation of the recommendation problem is more and more considered. Instead of trying to predict every unknown rating, the recommendation problem can indeed be reduced to the problem of learning to rank. In that framework, the goal is to build a model to predict how a particular user would order the items he did not rate, from the one he would love the most, to the one he would utterly hate.
Chapter 3
The Netflix Prize My precious. Gollum (The Lord of the Rings)
This chapter is dedicated to the Netflix Prize competition that was held from 2006 to 2009. It first reviews in section 3.1 the history of the contest. Section 3.2 presents the dataset which has been used during the competition. Lessons and innovative ideas that have emerged from the competition are summarized in section 3.3.
3.1
History
Back in Netflix headquarters. 2006. At the time, programmers at Netflix had been working for 6 years on the Cinematch recommender system. They had rapidly come with a reasonably robust recommendation algorithm and were able to detect fairly nuanced and surprising connections between movies and customers. By 2006 however, programmers were out of ideas. They didn’t know how to make their algorithm any better. They suspected that some major breakthrough has to be made. Then, in a staff meeting of the summer of 2006, Reed Hastings had the following idea: Why not have a public contest to improve our system? [55] It started on October 2006. Netflix challenged the data mining, the machine learning and the computer scientists communities to develop an algorithm that would beat their recommender system. Contestants were provided a dataset of 100,480,507 ratings that 480,189 anonymous subscribers gave to 17,770 movies. Ratings were on a scale from 1 to 5 stars, and were given as quadruplets of the form user–movie–date–rating. This set of ratings formed the training set. In addition, 2,817,131 of the most recent ratings from the same users on the same movies were withheld and were provided as triplets of the form user–movie–date. That second dataset was known as the qualifying set. The goal of the competition was to make predictions for all of those unknown ratings. Participants were allowed to make daily submissions of their predictions. In return, Netflix immediately and automatically computed the score of the submissions.
3.1. History
26
The root mean square error (RMSE) v u u 1 X ˆ i))2 RMSE(S) = t (R(u, i) − R(u, |S|
(3.1)
(u,i)∈S
for a fixed but unknown half the qualifying set (known as the quiz set) was reported back to the contestant and posted to the leader board. The RMSE for the other part of the qualifying set (known as the test set) was not reported. It was kept secret by Netflix to identify potential winners of the Prize [13]. At the time, Cinematch scored an RMSE of 0.9514 on the quiz data set and 0.9525 on the test set. To win the competition, a 10% improvement over Cinematch had to be reached. Simply put, in order to win the Grand Prize, contestants had to come up with an algorithm that would score an RMSE of 0.8572 or lower on the test set. By comparison, a trivial algorithm that returns for every unknown rating the average rating from the training set scores an RMSE of 1.0540. In addition, Netflix also identified a probe subset of the training set, with the same statistical properties than the qualifying set. That way, contestants could make offline evaluations before submitting their results. Figure 3.1 illustrates how the Netflix data are organized.
Netflix data
Training set
Qualifying set
100,480,507 ratings
2,827,131 ratings
Probe set
Quiz set
Test set
1,408,395 ratings
1,408,342 ratings
1,408,789 ratings
Figure 3.1: The Netflix dataset What made the Netflix Prize so attractive was the reward promised to the first person who could go over the 10% mark. 1 million dollars. That lure actually worked so well that no less than 51051 contestants from 186 different countries actually took part in the competition. In return, the winner was required to document and publish his algorithms publicly, enabling everyone to benefit from the insights and techniques required to achieve the enhanced level of predictive accuracy [13].
3.1. History
27
Or chose to not claim the prize if they wanted to keep their algorithm secret. Smaller intermediate progress prizes were also awarded every year to the leading contestants, as long as they had at least achieved a 1% improvement over the previous progress prize, or over Cinematch in the first year of the contest. Likewise, the winner of a progress prize had to disclose his techniques and algorithms to claim the reward. The competition officially started on October 2, 2006. Two weeks later, three teams had already beaten Cinematch’s results and one of them was advanced enough to qualify for the first progress prize. By the end of 2007, the competition had gained momentum and more than 20000 teams had registered. Several front-runners were fighting for the first place on the leader board, including ML@UToronto, a team from the University of Toronto led by Prof. Geoffrey Hinton, Gravity, a team of scientists from Budapest, and BellKor, a group of researchers from AT&T Labs. The first progress prize was awarded in 2007 to Yehuda Koren, Robert Bell and Chris Volinsky from the BellKor team. They were the first to reach an RMSE of 0.8712 (i.e., a 8.43% improvement). Accordingly, they made their techniques public, which in return revived the competition. Yet, progress was much slower over the second year. Approaching the long-desired 10% mark was getting more and more difficult. The second progress prize was awarded in 2008 to the team BellKor ¨ in Chaos, an alliance between BellKor and Andreas Toscher and Michael Jahrer from team BigChaos. Together they reached an RMSE of 0.8616 (i.e., a 9.44% improvement). The competition was nearing its end. Other contenders then quickly understood that they wouldn’t stand a chance against the leading team if they didn’t start merging together as well. Alliances started to appear and leaders were competing for the first place again. On June 26, 2009, BellKor put an end to it. They had merged with a third team and achieved an RMSE of 0.8558 – 10.05% better than Cinematch. But this is not the end of the story. In accordance with the rules of the contest, when a set of predictions scores beyond the qualifying RMSE, participants get 30 more days to make any additional submission that will be considered for judging. As a last resort, the remaining leaders merged together to form a team of more than 30 members, The Ensemble. On July 26, 2009 – on the last day of the competition, they submitted their final solution, a 10.10% improvement on the quiz set. Nearly at the same time, BellKor’s Pragmatic Chaos submitted their last blend, a 10.09% improvement on the quiz set. The winning team was to be the one with the lowest RMSE of the test set. In September 2009, Netflix announced the final results. Both Bellkor team and The Ensemble had scored an RMSE of 0.8567 on the test set. It was tie. Under the contest rules, in that case, the first team to have made the submission wins. The Ensemble submitted their results at 18:38:22. Luckily for them, Bellkor posted theirs
3.2. Data
28
20 minutes sooner, at 18:18:28. They had won the Netflix challenge. That 20 minutes had been worth $1M [43]. Delighted by the great success of the challenge, Netflix announced a sequel to the competition in August 2009. Rumours were that this time, contestants should have to focus on user profiles to make better predictions. Due to privacy concerns however, the second Netflix challenge never started. It was officially cancelled in March 2010.
3.2
Data
Since the experiments of the next chapters are all based on the dataset that was used during the Netflix challenge, a good understanding of its major aspects might happen to be more than helpful. This is the object of this section.
3.2.1
Creation of the dataset
The complete Netflix dataset (i.e., training set + qualifying set) was created by selecting a random subset of the Netflix subscribers who provided at least 20 ratings between October 1998 and December 2005. To make the contest more realistic, a significant number of users and movies were selected (480,189 users and 17,770 movies). Next, some perturbations techniques were applied on the selected ratings in order to protect the anonymity of the subscribers. Some ratings were added, others were slightly changed and some were even deleted. The exact perturbation process was not disclosed by Netflix (it would otherwise defeat its purpose), but they guaranteed that the statistical properties of the resulting set remained the same. All in all, over 100 millions ratings were collected. By comparison, the biggest dataset publicly released at the time was the MovieLens dataset, containing 10 millions ratings of 71,567 users over 10,681 movies. For each selected user, 9 of their most recent ratings were put aside and randomly assigned either to the quiz set, to the test set or to the probe set. If some user had fewer than 18 ratings (due to the perturbation of the original data), then only the most recent half of his ratings were put into the subsets [13]. This sampling scheme actually reflects the goal of recommender systems: predict future ratings based on past ratings. In practice, the whole dataset was released as a bunch of 2 Go of text files. The training set was split into 17,770 distinct files, each one of them corresponding to a particular movie and containing its list of ratings. The first line of each file encoded the movie identifier, while ratings were given on the remaining lines as user–rating– date of rating triplets. Just like for movies, users were given in the form of unique
3.2. Data
29
identifiers. The example below illustrates this formatting for the 10 first ratings of movie 2782 (Braveheart). 2782: 1316262,5,2005-07-05 2256305,2,2005-07-13 1026389,4,2005-07-06 313593,5,2005-07-06 1734805,5,2001-01-03 364518,3,2002-09-18 1392773,4,2001-04-26 1527030,1,2005-07-07 712664,3,2002-10-13 1990901,5,2000-10-06 As for the qualifying set, it was provided in an independent file, as a list of movie–user–date of rating triplets. Ratings of the probe set were also given in a auxiliary file, as a list of movie–user pairs (recall that the probe set is a subset of the training set). Finally, a third file reported the title and date of release of every movie.
3.2.2
Statistics
A singularity of the Netflix dataset is that it is largely sparse. At first sight, one might think that 100,480,507 ratings is a big number, and indeed it is. However, that number should be put into the perspective of the total number of ratings in the matrix R. 8,532,958,530 in this case. In other words, only 1.18% of the ratings are known. Needless to say that this high degree of sparseness only made the challenge harder. Intuitively, a consequence of this problem is that, on average, two users picked at random have low overlap, which usually results in less accurate predictions. This problem also dramatically reduces the number of machine learning methods available to tackle the problem. Those designed for complete data situations, or nearly so, have to be abandoned. Let’s now consider the distribution of ratings between users and movies. The overall average rating is 3.60, which means that users seem quite satisfied with their choices. Overall standard deviation is 1.01. This indicates a relatively high variability between ratings (on a scale from 1 to 5, this is far from being insignificant), and either means that users usually disagree with each other or that some movies get better or worse ratings than some others. Figure 3.2 illustrates the distribution of average ratings between users. Nearly two thirds of them have an average rating between 3 and 4, which suggests that they usually like the movies they watch. A
3.2. Data
30
good portion of users have an average rating between 4 and 5, which means that they seem to really enjoy everything they watch. By contrast, nearly no user appear to hate everything. Figure 3.3 illustrates the distribution of average ratings between movies. More than one half appear to have an average rating between 3 and 4, which confirms that movies are usually liked by their watchers. However, only a handful of movies have an average rating between 4 and 5, which means that very few are actually universally liked. By contrast, a lot more of movies appear to be disliked by all their watchers. Roughly a quarter of them have indeed an average rating lower than 3. Another important aspect to take into consideration is the number of ratings per user and/or per movie. The perfect long tail of figure 3.4 illustrates that the number of ratings varies by more than three orders of magnitude among users. A couple thousands of users –or bots?– count thousands of ratings while nearly 50% of users have less than 100 ratings. This chart also suggests that Netflix subscribers are actually quite active. More than 200,000 of them have more than 100 ratings! The same phenomenon occurs with distribution of ratings among movies, as shown in figure 3.5. Some blockbusters collect dozens of thousands of ratings, up to 200,000 ratings for a couple of them, while more than half of all movies actually amass less than 500 ratings. As noted in [9], these observations complicate the challenge to detect weak signals for users/movies with sufficient sample size while avoiding overfitting for users/movies with very few ratings.
Number of users with average rating of 50000 45000
40000 35000
30000 25000
20000 15000 10000 5000 0 1
1,2
1,4
1,6
1,8
2
2,2
2,4
2,6
2,8
3
3,2
3,4
3,6
3,8
4
4,2
Figure 3.2: Number of users with average ratings of
4,4
4,6
4,8
5
3.2. Data
31
Number of movies with average rating of 1600 1400 1200 1000 800 600 400
200 0 1
1,2
1,4
1,6
1,8
2
2,2
2,4
2,6
2,8
3
3,2
3,4
3,6
3,8
4
4,2
Figure 3.3: Number of movies with average ratings of
Number of ratings per user 5000 4500 4000
3500 3000 2500 2000 1500 1000 500 0
Figure 3.4: Number of ratings per user
4,4
4,6
4,8
5
3.2. Data
32
Number of ratings per movie 250000
200000
150000
100000
50000
0
Figure 3.5: Number of ratings per movie
3.2.3
Relevance of the RMSE measure
There has been much debate during the competition about the importance of the root mean square error (RMSE) metric. Many wondered about the relevance of this measure for assessing the quality of recommender systems. Some even questioned the importance of the challenge itself. Indeed, after all, what does it mean to reduce the RMSE from 0.9525 down to 0.8572? Is it even useful for the end-user? Yehuda Koren, one of the winners of the Netflix challenge, made the following experiment [35]. He proposed to evaluate the effect of lowering the RMSE of a recommender system on its capacity to find the top N recommendations for some user u. To this end, he used all 5-star ratings from the probe set as a proxy for movies that interest users. His goal was to find the relative place of these interesting movies within the top N recommendations. His experiment protocol was the following. First, for each 5-star rated movie i, Yehuda randomly picked 20 additional movies and predicted the rating of i and of these 20 other movies. Second, he sorted these predictions in descending order. Since those 20 movies were random, some may have been of interest to u but most probably wouldn’t have. Hence, since R(u, i) = 5, the best expected result was to find i in first position. Accordingly, a score was derived from the obtained ranking. If i was ranked first, then it was scored 0%. If i was ranked second, then it was scored 5%. And so on such that
3.3. Lessons
33
a case where i ranked last was scored 100%. Eventually, he averaged all of these scores and obtained a final ranking score. The trivial algorithm that returns for every unknown rating the overall average rating has an RMSE of 1.0540. The final ranking score of this method is 18.70%, which means that, on average, the most appealing movies are ranked after 18.70% of the other movies. By comparison, a neighborhood-based recommender system using the Pearson’s similarity measure (c.f., Section 2.3.1) yields an RMSE of 0.9430 on the Netflix data, which is roughly a 10% improvement over the trivial approach. The final ranking score of this method is 14.92%. That’s an improvement of 20.2% over the previous approach. Finally, one of the hybrid latent-factor based models of Yehuda scores an RMSE of 0.8949. With this algorithm, the final ranking score dropped to 10.72%, which is a 42.67% improvement over the first method. All in all, these experimental results are quite encouraging. They suggest that improvements in RMSE lead to significant improvements in terms of recommendation quality. It also appears that even small reductions in RMSE might result in meaningful improvements of the quality of the recommendations.
3.3 3.3.1
Lessons Publications
The science of making recommendations is a prime beneficiary of the Netflix competition. Many people became involved in the field of collaborative filtering and proposed a lot of new ideas. In particular, this (temporary?) enthusiasm for recommender systems led to a large amount of publications on the subject. Most notably, the various papers that the winning team was required to publish greatly contributed to the progress that has been made during the competition. See [8] for the advances made to win the first Progress Prize in 2007, [11, 4] for the Progress Prize of 2008 and [36, 5, 48] for the algorithms used by Bellkor’s Pragmatic Chaos to win the competition.
3.3.2
Blending predictions
Significant advances have been made during the contest to improve the quality of existing methods. However, one of the main outcomes of the Netflix competition is that contestants found no perfect model to make recommendations. Instead, the best results came from combining the predictions of models that complemented each other [9]. The very best latent-factor algorithms achieved an improvement ranging
3.3. Lessons
34
from 5.10% up to 8.24% for the latest and most sophisticated versions. Pure nearestneighbor methods scored way less. However, experience has shown that combining these methods together always yielded better results. That strategy worked so well that the final submission of the winning team is actually an aggregation of the predictions of no less than 307 different algorithms. The exact same strategy was used by the team which came second. This improvement comes from the fact that the two main collaborative filtering approaches (i.e., neighborhood and latent-factor models) address quite different levels of structures in the data [9]. Neighborhood models appear to be the most effective at detecting and leveraging localized relationships. Recall from Section 2.3.1 that these models identify a subset of similar users or a subset of similar items, and then aggregate their ratings to form the final prediction. Since the number of neighbors is typically limited to some value between 10 and 50, these methods are usually constrained to ignore a vast majority of ratings given by u or to i. As a consequence, neighborhood models usually fails at detecting weak signals in ratings. The opposite problem occurs for latent-factor models. They are good to estimate overall characteristics that relate simultaneously to most or all items (it is precisely their point), but they are usually no so effective to discover associations between closely related items. For instance, neighborhood models are better at correlating movie sequels than latent-factor models (e.g., a neighborhood-based model might find more easily that the three Lord of the Rings movies are highly correlated). In most cases, predictions have been combined using linear regression techniques [36], but some contestants [5, 48] were more creative and proposed to use artificial neural networks to blend the predictions together.
3.3.3
Implicit feedback
Recommendation algorithms introduced so far only take into consideration explicit feedback. Predictions are inferred from explicit ratings given by the users, and only from that. In practice however, these ratings might be difficult to collect, due to system constraints or to reluctance of users to cooperate [9]. As observed in Section 3.2.2, this problem leads to serious data sparseness and makes accurate predictions only more difficult to derive. By contrast, implicit feedback is abundant and usually very easy to collect. Examples of implicit feedback might include the rental or purchase history of a user, his browsing patterns or the keywords he uses. In recommender systems however, this source of information is often underexploited, or not exploited at all. Yet, this was one of the major keys to progress during the Netflix challenge. Instead of building models based on how users rated movies, some contestants came with the idea
3.3. Lessons
35
to examine what movies users rated, no matter how they rated them. This led them to explore a binary representation of the data and to propose models that could take advantage of it. The two most notables examples are NSVD, a variation of the SVD factorization technique, and conditional restricted Boltzmann machines. Both showed notable improvements once a binary view of the data was taken into account. This intuitively makes sense. If some user chose to watch some movie, it is most likely that it somehow already appealed to him. Few are those who pick their movies at random. What is more interesting however is that these new techniques are even more promising in the context of real life recommender systems, where implicit feedback is abundant. While the contest only let the contestants know who rated what, Netflix could for its part take into account the much broader information of who rented what. Indeed, that information would let them make valuable and personalized recommendations even to users with few or no ratings but with at least a decent rental history. This would greatly alleviate the sparseness problem.
Chapter 4
Restricted Boltzmann machines Memory, Agent Starling, is what I have instead of a view. Lecter (The Silence of the Lambs)
As pointed out in chapters 2 and 3, many algorithms have been proposed to make recommendations. From now on though, and for the rest of this text, focus will be entirely on a specific algorithm called restricted Boltzmann machines (RBMs). The importance of this particular model is actually threefold. First, it was one of the best single model that has been used during the Netflix challenge. Every leading team included several variations of this model in their final blending. Second, its applications are not limited to recommender systems. They have been used for various other tasks, such as digit recognition, document retrieval or image denoising. Third, RBMs can be used as the building blocks of Deep Belief Networks, a new class of neural networks issued from the emergent deep learning area of machine learning research [32, 12, 40]. Section 4.1 first reviews the model from which restricted Boltzmann Machines have been derived. Section 4.2 then focuses on RBMs themselves. It introduces the complete learning algorithm and then presents an insightful application example. RBMs are then examined in section 4.3 in the context of collaborative filtering. A variation of the model in which implicit feedback is taken into account is also examined in this section. Finally, section 4.4 presents a thorough experimental study of the model and of its parameters when tested over the Netflix data. The effect of each parameter of the model is examined.
4.1 4.1.1
Boltzmann machines Model
Boltzmann machines are a type of neural network invented by David Ackley, Geoffrey Hinton and Terrence Sejnowski [1]. Intuitively, the purpose of these networks is to model the statistical behaviour of some part of our world. What this means is that a Boltzmann machine can be shown some distribution of patterns that comes from the
4.1. Boltzmann machines
37
real world and then infers an internal model that is capable of generating that same distribution of patterns on its own [50]. Typical applications of such a model include pattern classification, generation of plausible patterns, in case we need some more, or reconstruction of partial patterns. For instance, Boltzmann machines could be trained on a distribution of photographs and (hopefully) be used to complete some partial images.
Figure 4.1: A Boltzmann machine. Hidden nodes are shown in blue while visible nodes are shown in orange. Nodes can be interconnected in any way. Technically, a Boltzmann machine is a recurrent neural network composed of stochastic binary units with symmetric connections. Nodes of a Boltzmann machine are usually divided into a set of visible units which can have data clamped on them, and a set of hidden units which act as latent variables [29]. Units are connected to each other with symmetric connections in any arbitrary way, except with themselves (c.f. figure 4.1). Each unit i has a binary state si and turns either on or off (i.e., si = 1 or si = 0) with a probability that is a logistic function of the inputs it receives from the other units j it is connected to: p(si = 1) =
1 P 1 + exp(−bi + j sj wij )
(4.1)
where bi is the bias term of unit i and wij is the weight of the symmetric connection between unit i and unit j. The weights and biases of a Boltzmann machine define an
4.1. Boltzmann machines
38
energy function over global configurations (i.e., binary state vectors) of the network. The energy of a configuration (v, h), where v is a binary state vector of the visible units and h a binary state vector of the hidden units, is defined as: X (v,h) X (v,h) (v,h) E(v, h) = − bi si − si sj wij (4.2) i
i+ − < si sj >− ) (4.6) ∂wij where • < si sj >+ is the averaged probability, when data vectors from P + (V ) are clamped on the visible units, of finding both unit i and unit j turned on when the Boltzmann machine runs at equilibrium. • < si sj >− is the averaged probability of finding both unit i and unit j turned on when the Boltzmann machine runs freely at equilibrium. In practice, computing < si sj >+ is called the positive phase and can be performed as described in algorithm 4.1. Computing < si sj >− is called the negative phase and can be done as described in algorithm 4.2. Algorithm 4.1 BM - Positive phase 1. Clamp a data vector on the visible units of the Boltzmann machine. 2. Update the hidden units in random order using equation 4.1. 3. Once the Boltzmann machine has reached its equilibrium distribution, sample state vectors and record si sj . 4. Repeat steps 1, 2 and 3 for the entire dataset. Average to get < si sj >+ .
Algorithm 4.2 BM - Negative phase 1. Initialize the Boltzmann machine with a random state. 2. Update visible and hidden units in random order using equation 4.1. 3. Once the Boltzmann machine has reached its equilibrium distribution, sample state vectors and record si sj . 4. Repeat steps 1, 2 and 3 many times. Average to get < si sj >− .
4.2. Restricted Boltzmann machines
40
Once these two quantities have been computed, the learning rule simply consists in iteratively increasing wij in the opposite direction of the gradient, hence: ∆wij = γ(< si sj >+ − < si sj >− )
(4.7)
where γ > 0 is some learning rate. The learning rule for the biases is similar and is given by: ∆bi = γ(< si >+ − < si >− ) (4.8) The learning rules of equations 4.7 and 4.8 are remarkably simple and only depend on local information. Unfortunately, this simplicity of the learning algorithm comes at a price. First, it can take a very long time for the network to reach equilibrium, even when heuristics such as simulated annealing are used to accelerate convergence. The time required to settle to equilibrium actually grows exponentially with the number of units. Second, the learning signal is in practice very noisy, since it is the difference of two approximated expectations. These two problems are so critical that they make the algorithm actually impractical for large networks with many units [29].
4.2 4.2.1
Restricted Boltzmann machines Model
As its name suggests, a restricted Boltzmann machine (RBM) is a Boltzmann machine with a restricted architecture. It consists of a layer of visible units and a layer of hidden units, with no visible-visible or hidden-hidden connections [30]. An example is illustrated in figure 4.2.
Figure 4.2: A restricted Boltzmann machine
4.2. Restricted Boltzmann machines
4.2.2
41
Learning
With these restrictions, computing < si sj >+ no longer requires any settling. Indeed, when a data vector is clamped on the visible units, the hidden units are conditionally independent and unbiased samples from < si sj >+ can be computed in one parallel step using equation 4.1. Computing < si sj >− is also simplified. Rather than updating units in random order to reach equilibrium, units can now be updated using a procedure called Gibbs sampling, which consists in updating visible and hidden units in chain, alternating between updating all the visible units in parallel and updating all the hidden units in parallel. However, it may still require a large number of iterations before converging to the equilibrium distribution. Fortunately, learning actually still works quite well if < si sj >− is replaced with an approximation < si sj >T which is obtained as described in algorithm 4.3. The learning rules become: ∆wij = γ(< si sj >+ − < si sj >T )
(4.9)
∆bi = γ(< si >+ − < si >T )
(4.10)
Algorithm 4.3 RBM - Contrastive divergence 1. Clamp a data vector on the visible units of the RBM. 2. Update all the hidden units in parallel using equation 4.1. 3. For T steps, alternate between updating all the visible units in parallel and updating all the hidden in parallel, still using equation 4.1. 4. Sample si sj from the current configuration. 5. Repeat steps 1, 2, 3 and 4 for the entire dataset and average to get < si sj >T .
In practice, learning rules 4.9 and 4.10 do not follow the gradient of equation 4.5 anymore. Instead, they closely approximate the gradient of another objective function called contrastive divergence [28]. Intuitively, this still works because it is not necessary to run the chain of updates until equilibrium to see how the model systematically distorts data vectors. In particular, if we run the chain for just a few steps and then lower the energy of the data (i.e., increase wij or bi for the data) and raise the energy of whichever configuration the Boltzmann machine preferred to the data (i.e., lower wij or bi for those configurations), the model will be more likely
4.2. Restricted Boltzmann machines
42
to generate the data and less likely to generate alternatives [29]. Experimental evidences show that contrastive divergence learning is indeed sufficient enough to be practical, even for T = 1. Theoretical justifications can be found in [28]. j
j
< 𝑠𝑖 𝑠𝑗 >+
i
j
i
t=0
< 𝑠𝑖 𝑠𝑗 >𝑇
…
i
t=1
t=T
Figure 4.3: Constrative divergence learning. Visible units and hidden units are updated in alternance for T steps. Correlations < si sj > are measured after the first update of the hidden units and then again at the end of the chain after T steps.
4.2.3
Illustration
To get more insight on the inner workings of restricted Boltzmann machines, let’s conclude this section with a small example. We wish to model a small distribution of 9 × 9 pixel images. These images consists of nine different binary patterns representing basic geometric shapes (c.f., figure 4.4).
Figure 4.4: Distribution of patterns Since we want to model those patterns over the visible units of a Boltzmann machine, as many visible units as the number of pixels in an image are required. Each one of the V visible units will correspond to one of the 81 pixels, and viceversa. By contrast, the number H of hidden units is unconstrained. We can use as many as we want. Intuitively however, we can already expect that the accuracy of the model will increase with respect to the number of hidden units. For the sake of simplicity, we will use a full mesh of connections between the visible units and the hidden units. All in all, the model will therefore count up to V ∗ H free parameters for the weights on the connections and V +H free other parameters for the bias terms of the units. Our goal is to adjust these parameters in order to model as accurately as possible the distribution of patterns.
4.2. Restricted Boltzmann machines
43
Using learning rules 4.9 and 4.10, we train four different RBMs: one with a single hidden unit, a second with 5 hidden units, a third with 10 hidden units and a fourth with 25 hidden units. The four of them are trained for 100 cycles on a dataset composed of 1000 random patterns. Learning rate γ is fixed to 0.75 and T to 1. Let’s first examine what the resulting RBMs believe in. More precisely, we want to see the low-energy configurations (also called fantasies) the networks tend to stabilize to when they run at equilibrium. If learning worked correctly, we expect those configurations to correspond to some of the patterns of the distribution. To this end, we initialize the visible units with random data and then run the alternating Gibbs sampling algorithm for 1000 iterations. That procedure is repeated 10 times for each of the four RBMs. The resulting visible configurations are shown in figure 4.5. The first row pictures the states of the visible units for the RBM trained with a single hidden node. The second, third and fourth rows correspond respectively to those of the RBMs trained with 5, 10 and 25 hidden units. Pixels in the figure represent the probability for the corresponding visible units to be turned on. A white pixel means that the visible unit is very likely to be on. Accordingly, a black pixel means that the visible unit is very unlikely to be turned on.
Figure 4.5: Fantasies of restricted Boltzmann machines The first RBM does not settle to any of the patterns. Rather, it always settles to the same unstable configuration (because of the grey pixels) from which 6 of the 9 patterns can be reconstructed. By contrast, the second, third and fourth RBMs all settle to one of the patterns. This suggests that learning managed to distort the energy landscape of the RBMs so as to make at least one of the minima corresponds to one of the patterns. Note however that all 9 patterns are not represented. This could either mean that the missing patterns have a greater energy than those of the figure (the RBM tends to settle to the configuration with the lowest energy), or that it
4.2. Restricted Boltzmann machines
44
is easier for the networks to escape from these configurations (due to the stochastic behaviour of the units, it is possible to come back to a configuration with a higher energy and therefore to escape from a local minima). Let’s now examine how good these RBMs are at identifying and reconstructing incomplete or scrambled patterns. This time, visible units are initialized with patterns drawn from the original distribution but where some of the white pixels have been randomly replaced with black pixels (with a probability of 0.25), and where some of the black pixels have been replaced with white pixels (with probability of 0.025). A single Gibbs sampling step is then performed. Again, that procedure is repeated 10 times for each of the four RBMs. If learning worked correctly, we expect the networks to be able to infer the missing pixels and to erase those which have been added. Since these patterns should already correspond to some low-energy configurations, it is indeed more than likely that a Gibbs sampling transition would reduce the global energy of the RBM even further, hopefully towards a local minima corresponding to the original pattern. Figure 4.6 illustrates the results. The first row corresponds to the patterns put on the visible units of the RBMs. The four other rows present the reconstructions, respectively for the RBM with 1, 5, 10 and 25 hidden units.
Figure 4.6: Reconstructions of incomplete and scrambled patterns We observe from figure 4.6 that reconstructions significantly improve as the number of hidden units increases. The RBM trained with a single hidden unit do not manage to reconstruct any single pattern while the one trained with 25 hidden units perfectly reconstructs them all, even the most damaged (e.g., the third or the ninth
4.3. RBMs for collaborative filtering
45
pattern). We also note that patterns sharing less pixels with others, such as the square figure, appear to be more difficult to reconstruct. Conversely, those sharing many pixels with other patterns are easier to model, such as the cross figures. This is actually not surprising, since the parameters of the model cannot store an infinite amount of information. Pixels that are turned on more often tend to be learned first, which reduce the capacity of the model to learn less common patterns. By looking a bit further, we can actually discover that each hidden unit models some specific (parts of) patterns. Figure 4.7 shows a normalized representation of the weights on the connections between the visible units and 10 of the 25 hidden units of the fourth RBM. For example, it is obvious that the sixth hidden unit of the figure specializes into modelling the square shape. By comparison, this specific pattern is absent in the weights of the three other RBMs, which explains why they all fail at reconstructing the square shape.
Figure 4.7: Weights of a restricted Boltzmann machine
4.3
RBMs for collaborative filtering
Imagine for an instant that the distribution of patterns of the previous example would correspond to user ratings instead of geometric shapes. A pixel would correspond to a movie and its intensity to the rating the user gave to the movie. Accordingly, learning the distribution of patterns would amount to learn how to perfectly regenerate the entire dataset of ratings. Of course, this may be not realistic on a dataset as large as the Netflix dataset, but it’d still be a reasonable thing to do since it would identify dependencies between ratings and movies. Then, just like we used RBMs to reconstruct incomplete and scrambled geometric shapes, the rating pattern of a user could hopefully be completed with the movies he would most likely appreciate. In essence, this is the strategy we will use for the rest of this work.
4.3.1
Basic model
The model presented in this section was first proposed in [51] by Ruslan Salakhutdinov et al., as they were themselves competing for the Netflix Prize. Most of this section is directly based on this publication.
4.3. RBMs for collaborative filtering
46
Assume that we have M movies, N users and that ratings are given as integer values on a scale from 1 to K. The first issue in applying RBMs to movie ratings is how to model integer-valued ratings when the outcome of a visible unit is limited to binary values. An easy solution to this problem is to use composite visible units, called softmax units, and which roughly consist in a combination of K binary visible units. Each rating is transformed into a binary code such that the k-th binary unit of the softmax is turned on if and only if the user rated that movie as k. The second problem is how to deal with the large number of missing ratings. The solution proposed in [51] is to consider that the visible units corresponding to the movies that the user did not rate simply do not exist (c.f., 4.8). In practice, this simply amounts to consider that these visible units are always turned off and hence that their state is always zero. Alternatively, this can also be seen as using an unique RBM per user, all sharing the same weights and biases, all with the same number of hidden units but each only including the softmax units for the movies rated by their user.
ℎ𝑗 𝒉 𝑊𝑖𝑗𝑘
𝑾
Missing rating
𝑽
Missing rating
𝑣𝑖𝑘
Figure 4.8: Restricted Boltzmann machine for collaborative filtering. Binary visible units are replaced with softmax units. For each user, the RBM only include the softmax units for the movies rated by that user. A full mesh of connection is used between visible and hidden units.
4.3. RBMs for collaborative filtering
47
More formally, assume that some user u rated m movies. Let V be a K × m matrix such that vik = 1 if u rated movie i as k and 0 otherwise. Let hj , j = 1, ..., F , be the binary values of the hidden units. Columns of V are modelled using a multinomial distribution (a softmax) and hidden latent features h are modelled just like in equation 4.1: PF exp(bki + j=1 hj Wijk ) k (4.11) p(vi = 1|h) = PK PF l l j=1 hj Wij ) l=1 exp(bi + p(hj = 1|V ) =
1 + exp(−bj −
1 Pm PK i=1
k=1
vik Wijk )
(4.12)
where Wijk is the weight on the connection between the rating k of movie i and the hidden unit j, bki is the bias of rating k for movie i and bj is the bias term of hidden unit j.
4.3.2
Learning
Even though the activation function of the visible units has changed, learning rules 4.9 and 4.10 remain the same. The only difference is that Gibbs sampling is used to reconstruct the distribution only over the non-missing ratings. Using the notations introduced previously, the learning rules become:
4.3.3
∆Wijk = γw (< vik hj >+ − < vik hj >T )
(4.13)
∆bki = γv (< vik >+ − < vik >T )
(4.14)
∆bj = γh (< hj >+ − < hj >T )
(4.15)
Making recommendations
Back to business. How to make recommendations. Now that we know how to model a rating distribution over the visible units of a restricted Boltzmann machine, inferring the missing ratings is actually quite straightforward: clamp the user ratings on the softmax units, and then perform a single Gibbs sampling step over all the missing ratings. That’s it. Just like with the geometric shapes, the most common rating trends with respect to the user ratings should automatically be derived. Hopefully, those should correspond to movies that the user might like. The exact prediction algorithm is given below (c.f., algorithm 4.4).
4.3. RBMs for collaborative filtering
48
Algorithm 4.4 RBM - Making recommendations Inputs: a user u, an movie i Outputs: an estimation of R(u, i) 1. Clamp the ratings of u over the softmax units of the RBM. 2. Compute pˆj = p(hj = 1|V ) for all hidden units j. p) = 3. Compute p(vik = 1|ˆ
PF k exp(bk ˆj Wij ) i+ j=1 p PF PK l l+ p ˆ exp(b j=1 j Wij ) l=1 i
for k = 1, ..., K.
4. Take the expectation as the prediction, i.e., R(u, i) =
4.3.4
PK
k=1
p(vik = 1|ˆ p)k.
Conditional RBM
The recommendation algorithms presented so far, including the RBM-based model, do not take into account any form of implicit feedback. All of them use explicit ratings to infer the preferences of users. Yet, there is an additional source of information that could be exploited in the Netflix data: we know which user/movies pairs occur in the qualifying set. We do not know whether these users liked those movies or not, but we know at least that they took the extra effort to rate them. This actually happens to be a very valuable source of information, especially for users for which we only have a small number of ratings in the training set. For instance, if some user is known to have rated Rocky V, then we already have a good bet about the kinds of movies he might like. The architecture of the restricted Boltzmann machine can be modified to take this extra information into account (c.f., figure 4.9). Let r ∈ {0, 1}M be a binary vector of length M indicating which movies a user rated (even if these ratings are unknown). The idea is to define a joint distribution over (V, h) conditional on r [51]. In particular, the activation functions are modified so that r will now affect the states of the hidden units: PF exp(bki + j=1 hj Wijk ) k p(vi = 1|h) = PK (4.16) PF l l l=1 exp(bi + j=1 hj Wij ) p(hj = 1|V, r) =
1 + exp(−bj −
1 Pm PK i=1
k=1
vik Wijk +
PM
i=1 ri Dij )
(4.17)
where Dij is an element of a learned matrix that models the effect of the vector r on h. Learning D is as simple as learning the biases terms. The corresponding learning rule takes the form:
4.3. RBMs for collaborative filtering
49
∆Dij = γd (< hj >+ − < hj >T )ri
(4.18)
Finally, let’s note that this extension of the model happens to be even more interesting in the context of real life recommender systems. Indeed, in that case, r could similarly be populated with the (much larger) list of movies a user rented (instead of only those he rated). Again, we wouldn’t know whether that user liked or not what he rented, and we couldn’t infer a rating prediction from this only source information, but it may still constitute a very good head start. For instance, if this time a user is known to have rented all six movies of Rocky, then there is little doubt about the kinds of movies he likes.
ℎ𝑗
𝑫
𝒉 𝑊𝑖𝑗𝑘
𝑾
𝒓
Missing rating
𝑽
Missing rating
𝑣𝑖𝑘
Figure 4.9: Conditional restricted Boltzmann Machine. The binary vector r indicates rated and unrated movies, and affects the binary states of the hidden units.
4.4. Experimental results
4.4 4.4.1
50
Experimental results Implementation
Both basic and conditional restricted Boltzmann machines were implemented from scratch in C++. At the price of some more effort in the early stages of the development, this language indeed guaranteed an implementation that was both efficient and flexible. Python was considered at first for its ease of use, but it happened to be very impractical on very large datasets. To speed up convergence, the learning algorithm (c.f., algorithm 4.5 for the complete learning algorithm) was implemented using mini-batches. In batch learning, training cases are treated all at once and the parameters of the model are updated only once the algorithm has gone through the entire dataset. In online learning, training cases are treated in turn and the parameters of the model are updated after each example. Mini-batch learning lies between these two approaches. In this implementation, training cases (i.e., users) are treated in bunches of 100 or 1000. Terms < . >+ and < . >T are computed from these training cases only and then used to update the parameters of the model. A second characteristic of the implementation is that it includes a heuristic called the momentum method [31]. The idea is to take into account the update computed at iteration t − 1 when computing the update at iteration t: ∆Wijk (t) = γ(< vik hj >+ − < vik hj >T ) + α∆Wijk (t − 1)
(4.19)
where α ∈ [0; 1]. Learning rules 4.14, 4.15 and 4.18 are modified accordingly. The motivation behind this heuristic is to accelerate convergence when updates always happen in the same direction and to damp oscillations when consecutive updates have different signs. To make the implementation more convenient and efficient, the 2 Go of text files representing the Netflix dataset were converted into a single binary and compact file of no less than 450 Mo. The matrix R was encoded using the good old Yale Sparse Matrix format [22]. The probe set was encoded using the same format. For comparison, loading 17770 different text files at run-time from a standard hard drive disk easily took more than one hour. Loading the single compacted binary file takes no longer than a few seconds at most. Simulations were all performed on the NIC3 supercomputer of the University of Li`ege. This equipment counts no less than 1300 cores integrated into Quadcore Intel L5420 2.50 Ghz microprocessors. Random access-memory ranges from 16 Go to 32 Go per motherboard. In the experiments presented below, simulations were run on a single core (for now) with 1 Go of memory allocated (dataset included).
4.4. Experimental results
51
Algorithm 4.5 RBM - Learning algorithm Initialize Wijk ’s with small values sampled from a zero-mean normal distribution; Initialize bki ’s to the log of their respective base rates; Initialize bj ’s with zeroes; Initialize Dij ’s with zeroes; n := 0; Compute the prediction error Errn at epoch n; repeat for all mini-batch of users in the training set S do for all user u in the current mini-batch do Clamp the ratings of u on the visible units; Compute pj = p(hj = 1|V, r) for all the hidden units; Record samples vik pj , vik , pj ; Run the Gibbs sampler for T steps; Compute pj = p(hj = 1|V, r) for all the hidden units; Record samples vik pj , vik , pj ; end for Average the first samples to get < vik hj >+ , < vik >+ and < hj >+ ; Average the last samples to get < vik hj >T , < vik >T , < hj >T ; Update Wijk ’s using equation 4.13 (augmented with momentum); Update bki ’s using equation 4.14 (augmented with momentum); Update bj ’s using equation 4.15 (augmented with momentum); Update Dij ’s using equation 4.18 (augmented with momentum); end for n := n + 1; Compute the prediction error Errn at epoch n; until Errn−1 − Errn > �
Algorithm 4.6 RBM - Test algorithm ˆ i) using algorithm 4.4. 1. For all user-movie pairs in the test set T , compute R(u, 2. Compute the RMSE of the predictions: v u u 1 X ˆ i))2 RM SE = t (R(u, i) − R(u, |T | (u,i)∈T
4.4. Experimental results
4.4.2
52
Results
Experiments were all performed on the Netflix dataset. The ratings from the probe set were all extracted from the original training set, resulting in a new dataset of 99,072,112 user ratings. Models were all trained for 50 or 100 passes (or epochs) on that dataset. The training error of the model was computed (c.f., algorithm 4.6) after each epoch on a random subset of the training set. The generalization error (i.e., the error on an independent dataset) was evaluated on the probe set. Learning was not stopped if the model started to overfit the training set (contrary to the stop criterion of algorithm 4.5). Unless said otherwise, the models presented in this section were all trained using 100 hidden units and mini-batches of 100 training cases. Learning rates were set to 0.0015 for γw , 0.0012 for γv , 0.1 for γh and 0.001 for γd . T was set to 1, momentum α to 0.9. The values of these parameters were found empirically and happen to yield quite satisfying results. To begin with, let’s first mention that learning time took extremely long in some cases. Despite a meticulous implementation, a single pass through the entire dataset took on average more than 20 minutes of computing time. Hence, several days(!) were actually necessary to run the learning algorithm for 50 or 100 epochs. Unfortunately, this is not a bug in the implementation. Contestants of the Netflix Prize reported computation times of the same order of magnitude. Before examining how to solve that major issue in the next chapter, let’s first focus for the rest of this section on the results of the model in terms of pure accuracy. Let’s start with the performances of the basic RBM against those of the conditional version. Figure 4.10 shows the generalization error of both models over the probe set. Figure 4.11 presents the training error. The x-axis shows the number of epochs while the y-axis displays the RMSE of the model. First, it is with delight that we find out that the obtained results are those expected. The lowest RMSE scored by the basic RBM is 0.9080 (i.e., a 4.67% improvement over Cinematch), while the lowest RMSE achieved by the conditional model is 0.9056 (i.e., a 4.92% improvement). By comparison, these results rank slightly worse than those achieved by the RBMbased models of the winning team of the Netflix Prize, but also much better than those of Hinton et al. in [51]. As expected, the conditional model performs better in generalization than the basic model. The same happens to be true for the training error. As often in machine learning, it is also quite interesting to note that both models start to overfit the training set between epoch 15 and 20. From this moment on, the training error keeps decreasing steadily, while the error in generalization of both models starts increasing instead of decreasing. Intuitively, this means that the models are getting better at regenerating known ratings than at predicting new
4.4. Experimental results
53
ones. More technically, overfitting actually happens when the model starts fitting the noise in the dataset, and not only the regularities in the mapping from input to output. Given the very large number of free parameters, this is not so surprising though. Finding a satisfying combination of parameters is not an easy task. First, all of them have a specific effect on the learning curves. Second, they all add up together on the final result, sometimes cancelling or reinforcing each other, which complicates matters even most. Third, given the time required to evaluate a set of parameters, it is not practical to test every possible combination. In that context, the four experiments presented below only aims at studying the individual effect of each parameter, when all other things are kept equal. Simulations were all carried out using the conditional model. 1. Learning rate: Let’s first examine the influence of the learning rate on the convergence of the algorithm. To make things simpler, all four different learning rates (i.e., γw , γv , γh and γd ) are set to the same value γ, with γ ranging from 0.01 to 0.00001. Figures 4.12 and 4.13 respectively illustrate the effect of modifying γ on the generalization error and on the training error. In both cases, the effect appears to be the same. On one hand, too small values (γ = 0.00001) significantly slow down learning. On the second hand, too large values (γ = 0.01 or 0.005) considerably speed up learning in the very first epochs but then quickly fail at making the model any better. Intermediate values (γ = 0.001, 0.0005 or 0.0001) combine a fast convergence in the first iterations with a lower RMSE in the latter epochs. 2. Momentum: As illustrated in figures 4.14 and 4.15, the momentum heuristic has a tremendous effect on the speed of convergence. It gets nearly twice faster with this heuristic (c.f., α = 0.8 or 0.9 versus α = 0.0)! The effect is especially significant in the first iterations of the algorithm. The larger the momentum, the faster the convergence becomes. In the latter iterations however, the momentum effect starts disappearing and no significant difference is observed between the learning curves. By looking more carefully at the numbers in the latter iterations (beyond 50), we observed however that the lowest overall RMSE is achieved when α is set to 0.2: RMSE is reduced from 0.9056 (α = 0.9) down to 0.9006 (i.e., a 5.44% improvement over Cinematch). As a result, this gain of velocity for large values of α comes at the price of a slightly worse final accuracy. Yet, considering the potential gains in terms of computing time, this may
4.4. Experimental results
54
be worth the price in some situations. Finally, let’s also note that the heuristic makes learning completely degenerate for very large values of α (e.g., α = 0.99 on the learning the curves). 3. Size of mini-batches: The size of mini-batches directly affects the number of times the model parameters are updated. The larger the mini-batch, the less often the parameters get updated. Conversely, the smaller the mini-batch, the more often the model parameters get updated. At the same time however, the smaller the mini-batch, the less samples are recorded to compute the < . > terms, and the noisier the learning signal gets. This is exactly what happens on figures 4.16 and 4.17. For small mini-batches (10 or 50 training cases), convergence is fast in the first iterations (because of the large number of updates) but then fails at making the model any better (because of the poor learning signal). For large mini-batches (500, 1000 and 5000 training cases), convergence is indeed slower (because of the smaller number of updates) but learning reduces the RMSE further than with smaller mini-batches (because of the increased quality of learning signal). The best trade-off seems to be mini-batches of either 500 or 1000 training cases. This does not directly reflect into the figures, but increasing the size of minibatches has also the effect of reducing the time required to run the learning algorithm. Indeed, updating more than V ∗H ∗K parameters when V = 17770, H = 100 and K = 5 is not an insignificant computing step. This is actually the reason why some of the training curves are not complete for the smaller mini-batches. It took way too long to compute! 4. Number of hidden nodes: As already noted in Section 4.2.3, increasing the number of hidden nodes directly increases the representational power of the model. As figure 4.19 indeed illustrates, the more the hidden nodes, the further the RMSE is reduced over the training set. On the probe set however, as figure 4.18 shows, increasing the number of hidden nodes beyond 90 or 110 does not make the model any better in generalization. Quite logically, the more the hidden nodes, the more the model overfits the data and the worse it becomes in generalization.
4.4. Experimental results
55
RBM + Conditional RBM (Probe set) 0,96
0,95
RMSE
0,94
0,93
0,92
0,91
0,9 0
5
10
15
20
25
30
35
40
45
50
45
50
Epochs default-basic-vs
default-cond-vs
cinematch
Figure 4.10: Default parameters (Generalization error)
RBM + Conditional RBM (Learning set) 0,895 0,875
RMSE
0,855 0,835 0,815 0,795 0,775
0
5
10
15
20
25
30
35
40
Epochs default-basic-ls
default-cond-ls
Figure 4.11: Default parameters (Training error)
4.4. Experimental results
56
Learning rate (Probe set) 1 0,99 0,98 0,97 RMSE
0,96 0,95 0,94 0,93 0,92 0,91 0,9 0
5
10
15
20
25
30
35
40
45
50
45
50
Epochs rate-0.01-vs
rate-0.005-vs
rate-0.001-vs
rate-0.0001-vs
rate-0.00005-vs
rate-0.00001-vs
rate-0.0005-vs
Figure 4.12: Effect of the learning rate (Generalization error)
Learning rate (Learning set) 0,975
RMSE
0,925
0,875
0,825
0,775 0
5
10
15
20
25
30
35
40
Epochs rate-0.01-ls
rate-0.005-ls
rate-0.001-ls
rate-0.0001-ls
rate-0.00005-ls
rate-0.00001-ls
rate-0.0005-ls
Figure 4.13: Effect of the learning rate (Training error)
4.4. Experimental results
57
Momentum (Probe set) 0,95
0,94
RMSE
0,93
0,92
0,91
0,9 0
5
10
15
20
25
30
35
40
45
50
45
50
Epochs momentum-0.0-vs
momentum-0.1-vs
momentum-0.2-vs
momentum-0.3-vs
momentum-0.4-vs
momentum-0.5-vs
momentum-0.6-vs
momentum-0.7-vs
momentum-0.8-vs
momentum-0.9-vs
momentum-0.99-vs
Figure 4.14: Momentum heuristic (Generalization error)
Momentum (Learning set) 0,895 0,875
RMSE
0,855 0,835 0,815 0,795
0,775 0
5
10
15
20
25
30
35
40
Epochs momentum-0.0-ls
momentum-0.1-ls
momentum-0.2-ls
momentum-0.3-ls
momentum-0.4-ls
momentum-0.5-ls
momentum-0.6-ls
momentum-0.7-ls
momentum-0.8-ls
momentum-0.9-ls
momentum-0.99-ls
Figure 4.15: Momentum heuristic (Training error)
4.4. Experimental results
58
Batch size (Probe set) 0,95
0,94
RMSE
0,93
0,92
0,91
0,9 0
10
20
30
40
50
60
70
80
90
100
Epochs minibatch-10-vs
minibatch-50-vs
minibatch-100-vs
minibatch-500-vs
minibatch-1000-vs
minibatch-5000-vs
Figure 4.16: Effect of the size of mini-batches (Generalization error)
Batch size (Learning set) 0,895 0,875
RMSE
0,855 0,835
0,815 0,795 0,775 0
10
20
30
40
50
60
70
80
Epochs minibatch-10-ls
minibatch-50-ls
minibatch-100-ls
minibatch-500-ls
minibatch-1000-ls
minibatch-5000-ls
Figure 4.17: Effect of the size of mini-batches (Training error)
90
100
4.4. Experimental results
59
Hidden units (Probe set) 0,94
0,935 0,93
RMSE
0,925 0,92 0,915 0,91 0,905 0,9 0
10
20
30
40
50
60
70
80
90
100
Epochs hidden-10-vs
hidden-30-vs
hidden-50-vs
hidden-70-vs
hidden-90-vs
hidden-110-vs
hidden-130-vs
hidden-150-vs
Figure 4.18: Effect of the number of hidden nodes (Generalization error)
Hidden units (Learning set) 0,89 0,87
RMSE
0,85 0,83 0,81
0,79 0,77 0,75
0
10
20
30
40
50
60
70
80
90
Epochs hidden-10-ls
hidden-30-ls
hidden-50-ls
hidden-70-ls
hidden-90-ls
hidden-110-ls
hidden-130-ls
hidden-150-ls
Figure 4.19: Effect of the number of hidden nodes (Training error)
100
4.4. Experimental results
4.4.3
60
Improvements
The results obtained so far are very satisfying. Yet, with some more determination, the RMSE can be reduced even further. Considering 100 hidden nodes, M = 17770 and K = 5, the model ends up with 8885000 weights, 88850 bias terms for the visible units, 100 others for the hidden units and 1777000 values for the D matrix. This excessively large number of free parameters makes the model very sensitive to overfitting, and prevents it from achieving an even lower RMSE. In this section, we investigate two different heuristics to counter as much as possible this phenomenon. 1. Weight decay: Weight decay is a popular regularization technique [38] whose goal is to limit the amplitude of weights by penalizing the larger ones. Learning rule 4.13 is adapted in the following way: ∆Wijk = γ(< vik hj >+ − < vik hj >T −βWijk )
(4.20)
where β is a penalizing factor called weight cost. As intended, this penalty causes the weights to converge to smaller absolute values than they otherwise would. Larger values of β will indeed tend to shrink the size of weights toward zero. In practice, the problem is that excessively large weights can lead to excessively rough variations in the outputs of the network, even for small changes in the inputs. Weight decay helps alleviate this problem by smoothing the variations. Figures 4.20 and 4.21 illustrate the effect of this heuristic on the generalization and training error of the conditional RBM. No or too less penalizing weight costs cause the model to overfit as already observed. By contrast, a weight decay of 0.001 makes divergence nearly stop and even manages to reduce the RMSE from 0.9056 down to 0.9035. While being better in generalization, we observe as expected that the performances of the regularized model are worse on the learning set. As often, we also note that a too penalizing weight-cost (β = 0.01) makes learning degenerate. 2. Annealing: The idea of the annealing heuristic is to decrease the learning rate γ over time. The intuitive motivation is that learning steps should be less and less important as the learning algorithm converges. Accordingly, instead of using a static learning rate γ, learning uses a dynamic rate γ(t) computed in the following way: γ (4.21) γ(t) = 1 + ρt
4.4. Experimental results
61
where γ is the base learning rate, t is the current epoch and ρ > 0 is a parameter controlling the decreasing rate of γ(t). The effects of this heuristic are shown on figures 4.22 and 4.23. For comparison, the learning curves of the model trained without annealing are shown in orange. In generalization, speeding up the decrease of γ(t) (i.e., ρ = 2 or 4) appears to improve the overall accuracy of the model. When running the simulation for 100 epochs instead of 50, RMSE actually decreases from 0.9056 down to 0.8989 for ρ = 2 (i.e., a 5.62% improvement over Cinematch). The opposite phenomenon seems to happen for the training error. The less γ(t) decreases, the more the model overfits the training set. Surprisingly however, a decreasing rate of 6, 8 or 10 happens to be better than a static learning rate (for which ρ → ∞). This suggests that a decreasing learning rate is actually beneficial in both cases. In the end, the lowest RMSE achieved in this work using a single model is 0.8987 (i.e., a 5.64% improvement). It was obtained using a conditional restricted Boltzmann machine trained for 100 passes over the training set, using mini-batches of size 500, γw = 0.0015, γv = 0.0012, γh = 0.1, γd = 0.001, T = 1, α = 0.9, β = 0.0001 and the annealing heuristic with ρ = 3. Unfortunately, combining the optimal parameters found individually in the previous and in this section did not yield a better model. Rather this combination of parameters was found empirically by trial and error. Despite the remarkable accuracy of the model, this is clearly one of its major drawbacks. Namely, it cannot be applied as an off-the-self method to tackle any kind of problems. Parameters have to be finely tuned before getting satisfying results. To conclude this section, let’s also mention that Hinton et al. introduced an orthogonal approach to tackle the overfitting problem of restricted Boltzmann machine. In [51], they proposed to reduce the number of free parameters of the model by factorizing the parameter matrix W into a product of two lower-rank matrices A and B. That way, they managed to reduce the number of free parameters by a factor of 3 while preserving a similar accuracy over the probe set.
4.4. Experimental results
62
Weight-cost (Probe set) 0,95
0,94
RMSE
0,93
0,92
0,91
0,9 0
5
10
15
20
25
30
35
40
45
50
45
50
Epochs weight-cost-0.01-vs
weight-cost-0.001-vs
weight-cost-0.0001-vs
weight-cost-0.00001-vs
weight-cost-0.000001-vs
weight-cost-0.0-vs
Figure 4.20: Weight decay heuristic (Generalization error)
Weight-cost (Learning set) 0,845 0,835
RMSE
0,825 0,815 0,805 0,795 0,785
0,775 0
5
10
15
20
25
30
35
40
Epochs weight-cost-0.01-ls
weight-cost-0.001-ls
weight-cost-0.0001-ls
weight-cost-0.00001-ls
weight-cost-0.000001-ls
weight-cost-0.0-ls
Figure 4.21: Weight decay heuristic (Training error)
4.4. Experimental results
63
Annealing (Probe set) 0,909 0,907
RMSE
0,905 0,903 0,901 0,899 0,897 0,895 0
10
20
30
40
50
60
70
80
90
100
90
100
Epochs annealing-2-vs
annealing-4-vs
annealing-6-vs
annealing-8-vs
annealing-10-vs
default-cond-vs
Figure 4.22: Annealing heuristic (Generalization error)
Annealing (Learning set) 0,825 0,82 0,815 0,81 RMSE
0,805
0,8 0,795 0,79 0,785 0,78 0,775 0
10
20
30
40
50
60
70
80
Epochs annealing-2-ls
annealing-4-ls
annealing-6-ls
annealing-8-ls
annealing-10-ls
default-cond-ls
Figure 4.23: Annealing heuristic (Training error)
Chapter 5
Scalable RBMs I feel the need... the need for speed! Maverick and Goose (Top Gun)
Restricted Boltzmann machines constitute one of the most accurate classes of stand-alone models to make recommendations. However, as already briefly pointed out in chapter 4, they are also one of the most resource-consuming. Several days of computing time to learn a single model is not acceptable. In practice, this is even less reasonable when the model needs to be periodically recomputed due to additions or changes in the database, or when the item-movie database is actually bigger than the Netflix dataset. Clearly, as presented in the previous chapter, restricted Boltzmann machines are not one of the most scalable models. The solution that we propose to solve this major issue is to leverage multi-core and distributed architectures in order to reduce computing times. Three different and original approaches are considered. Section 5.1 revisits algorithms 4.5 and 4.6 in the context of shared memory architectures and introduces a parallel version of the algorithms. Section 5.2 is concerned with distributed architectures. It proposes to reformulate the learning and test algorithms into MapReduce tasks. Finally, section 5.3 studies ensembles of RBMs. For all three approaches, parallel efficiency is discussed as well as the impact on the quality of recommendations.
5.1
Shared memory architectures
During this work, I was given the opportunity to work on the NIC3 supercomputer of the University of Li`ege. This equipment counts up to 1300 cores dispatched on blades of 2x4 cores. In a sense, this supercomputer can be seen as an extremely fast local area network of double-quadcore platforms. Unfortunately however, one cannot come up with an arbitrary sequential algorithm, launch it on the supercomputer and then hope it will magically leverage the 1300 cores at hand. In order to fully exploit its capacities, algorithms have to be designed with that specific architecture in mind.
5.1. Shared memory architectures
65
In that context, the objective of this section is to analyze how algorithms 4.5 and 4.6 could be rewritten to fully exploit, at first, a single blade of 2x4 cores. More specifically, we are interested in shared-memory multiprocessor architectures in which processes executing on different processors have access to a common (shared) memory. In these architectures, processes communicate by altering the content of that memory by means of an interconnection network. On small multiprocessors (i.e., with a few number of cores, such as those found in today desktop computers or those found on the blades of the NIC3 supercomputer), this interconnection network is often implemented by a memory bus, which guarantees uniform memory access times between every cores and every memory locations. Those multiprocessors are called UMA machines (Uniform Memory Access) or symmetric multiprocessors. By contrast, on larger multiprocessors (i.e., with tens or hundreds of cores), the shared memory is distributed among nodes and organized hierarchically. In particular, the interconnection network is often implemented as a tree-structured collection of switches and memories. Because it leads to nonuniform memory access times, those multiprocessors are called NUMA machines [6]. In this section, algorithms 4.5 and 4.6 will be revisited for symmetric multiprocessors only.
5.1.1
Concurrent algorithms
Concurrent programming is a pet peeve for many programmers. In many cases, it may lead to programs giving rise to non reproducible bugs, due to unforeseen scenarii, memory inconsistencies or deadlocks. A nightmare to debug and test. Yet, algorithms 4.5 and 4.6 can be parallelized in a very easy and safe way. Let’s first consider the learning algorithm of a restricted Boltzmann machine (c.f., algorithm 4.5). Luckily, due to the mini-batch formulation of the training procedure, the algorithm is actually embarrassingly parallel: it can be parallelized with little or no effort. The strategy that we propose is to put the model parameters into shared memory and then simply dispatch the processing of the mini-batches between processes. Each process then iteratively computes the < . > terms for its mini-batches and updates the model parameters. The only critical point is to make sure that the model parameters are updated in mutual exclusion, hence avoiding two processes to interfere with each other in case they would happen to update the same parameter at the same time. A high-level and concurrent version of algorithm 4.5 is given in algorithm 5.1. The inner for-all loop has to be considered as a loop whose iterations are computed in parallel by the team of n processes created just before. An issue that arises with algorithm 5.1 is how the iterations of the inner for-all loop should be divided among processes. The most instinctive strategy would be to divide the mini-batches equally between the processes. In particular, if the training
5.1. Shared memory architectures
66
dataset S is composed of m mini-batches, then each process should be assigned to roughly m n mini-batches. In practice however, this strategy may lead to very poor load balancing since some mini-batches may be composed of training cases with many ratings (hence taking longer to process), while some others may be composed of training cases with very few ratings (hence taking much less time to process). In our case, a better approach is to use a guided schedule strategy. Namely, the mini-batches are assigned to processes in chunks of decreasing sizes. When a process finishes its assigned chunk of mini-batches, it is dynamically assigned another chunk, until none remain. That way, processes do not remain idle in case they finish to process their list of batches sooner than others. In addition, the size of the chunks is (exponentially) decreased over time to guarantee a better workload in the latest iterations of the algorithm. Algorithm 5.1 RBM - Learning algorithm (Multi-threaded) Initialize the model parameters into shared memory; n := 0; Compute the prediction error Errn at epoch n; repeat parallel n do // Fork off n processes for all mini-batch in the training set S do //Iterations are executed in parallel by the n processes Compute the < . > terms for the current mini-batch; Update the model parameters (with mutual exclusion); end for end parallel n := n + 1; Compute the prediction error Errn at epoch n; until Errn−1 − Errn > � Due to its simplicity, the test algorithm (c.f., algorithm 4.6) given in the previous section was formulated from a very high level point of view. When looking at it more closely however, two aspects of the algorithm can be parallelized: ˆ i), the • First, instead of using a single process to compute the predictions R(u, workload can be dispatched to a team of n processes in such a way that each process is assigned to a bunch of user/movie pairs for which it has to predict the ratings. Just like with the learning algorithm, training cases can be dynamically assigned to processes to achieve a more balanced workload. • Second, the computation of the final RMSE score can itself be parallelized us-
5.1. Shared memory architectures
67
ing a divide and conquer strategy. Instead of using a single process to compute the sum of squared errors, the computation of the whole sum can be split into a sum of n smaller sums; one assigned to each of the n processes. The final RMSE is then obtained by aggregating these partial sums and computing the square root mean. The revisited algorithm is given below (c.f., algorithm 5.2). Algorithm 5.2 RBM - Test algorithm (Multi-threaded) parallel n do sub := 0; // Private variable to each process for all (u, i) pairs in the test set T do //Iterations are executed in parallel by the n processes ˆ i); Compute R(u, ˆ i))2 ; sub := sub + (R(u, i) − R(u, end for end parallel Reduce q the sub variables into a single value sum; return
5.1.2
1 |T | sum;
Results
The original implementation written in C++ was modified using the OpenMP programming interface. The main advantage of this API is that it makes parallelization very easy without letting the programmer shooting himself in the foot. As a matter of fact, all one needs to do is to add a few compiler directives and then let the API magically transform the original sequential code into a concurrent program. For instance to transform a for statement into a parallel for in which iterations are assigned to processes using the guided schedule strategy, a single line of code actually needs to be inserted into the original implementation: #pragma omp parallel for schedule(guided). More details about the implementation can be found directly into the source code of this work. Two different metrics will be used to discuss the gains of parallelization. The first metric is the speedup factor Sn , which is defined as the ratio between the execution time T1 of a sequential algorithm and the execution time Tn of its parallel counterpart on n processors: T1 (5.1) Sn = Tn
5.1. Shared memory architectures
68
The goal of this metric is to measure how much a parallel algorithm is faster than a corresponding sequential algorithm. An ideal speedup is achieved when Sn = n. In that case, speedup is linear and doubling the number of processes makes the parallel algorithm run twice faster. Due to a better use of the processor cache, speedup may even be superlinear (i.e., Sn > n) in some rarer cases. Unfortunately however, most parallel algorithms show sublinear speedup (i.e., Sn < n). The second metric is the parallel efficiency of a parallel algorithm: En =
Sn T1 = n nTn
(5.2)
It measures how well a parallel program utilizes extra processors. Algorithms with sublinear speedup have a parallel efficiency between 0 and 1, those with linear speedup have a parallel efficiency equal to 1 and those with superlinear speedup have a parallel efficiency greater than 1. The speedup and parallel efficiency of the concurrent version of the learning algorithm (c.f., algorithm 5.1) were evaluated using the model parameters mentioned at the end of section 4.4.3. The execution time of the algorithm was recorded when varying the number of cores from 1 to 8. Figure 5.1 shows the speedup achieved by the algorithm. Figure 5.2 shows its parallel efficiency. As the figures illustrate, speedup is sublinear. Adding more processors –up to 5– appears to steadily reduce computing times. From 6 and beyond however, gains become insignificant. The parallel efficiency of the algorithm indeed suggests that processors are more and more underexploited as their number increases. The crux of the problem actually directly comes from the fragment of code in charge of updating the parameters of the model. Since this part of the algorithm needs to be executed with mutual exclusion, processes may have to wait before entering this critical section. Worse, as the number of processes increases, the more likely they will wait and the longer they may queue. From a more formal point of view, this argument is theorized by Amdahl’s law [3] which states that the speedup of a parallel algorithm is bounded by the portion of code which is inherently serial. Indeed, if equation 5.1 is reformulated as T1 1 Sn = = (5.3) 1−ξ (ξ + n )T1 ξ + 1−ξ n where ξ is the percentage of code that cannot be parallelized and (1 − ξ) is the remaining part which is perfectly parallel, then Sn = 1ξ when n → ∞ [34]. In practice, this means that up to a point, there is no need to throw more cores at the program. It is not going to make it run faster. This is indeed what happens in the case of the learning algorithm. Using more than 5 cores is useless.
5.1. Shared memory architectures
69
Speed up 3
2,5
Speeup
2
1,5
1
0,5
0 1
2
3
4
5
6
7
8
7
8
Number of cores
Figure 5.1: Speedup of the learning algorithm
Parallel efficiency VS. Number of cores 1 0,9 0,8
Parallel efficiency
0,7
0,6 0,5 0,4 0,3 0,2
0,1 0 1
2
3
4
5
6
Number of cores
Figure 5.2: Parallel efficiency of the learning algorithm (I)
5.1. Shared memory architectures
70
Parallel efficiency VS. Batch size 0,5 0,45 0,4
Parallel efficiency
0,35 0,3
0,25 0,2 0,15
0,1 0,05 0 100
250
500
1000
2500
5000
Size of a mini-batch
Figure 5.3: Parallel efficiency of the learning algorithm (II) As a result of Amdahl’s argument, speedup or parallel efficiency can be improved by increasing (1 − ξ). In the case of the learning algorithm, this can be done easily by increasing the size of the mini-batches. Indeed, this causes the processes to update less often the parameters of the model, which in turn makes them less likely to be idling, hence increasing the amount of parallel execution. Figure 5.3 illustrates the effect the size of mini-batches on the parallel efficiency when the algorithm is run over 8 cores. We observe that it clearly improves when the size increases. As a consequence, increasing the size of the mini-batches does indeed reduce the running time of the program. Paradoxically however, as observed in section 4.4.2, increasing the size of the mini-batches will also make the learning algorithm to converge slower. Yet, very decent results might undoubtedly be obtained when retuning the other parameters. In conclusion, this first approach to parallelize the learning algorithm happens to give decent results in terms of running time. They are not spectacular, but they at least have the benefit to reduce the training phase of an RBM over the Netflix dataset from days down to a couple tens of hours. In practice, this greatly helped to tune the parameters of the algorithm. Since the test algorithm is far less critical than the learning algorithm, the performances of its parallelized version (c.f., algorithm 5.2) are not discussed in details in this work. To make it short, speedup is this time nearly linear due to the absence of critical sections, which is very satisfying.
5.1. Shared memory architectures
5.1.3
71
The delay effect
At first sight, both sequential and parallel learning algorithms may seem semantically equivalent. Yet, there is a subtle difference between the two algorithms. In the sequential algorithm, < . > terms are computed and then used right away to update the free parameters. In particular, the < . > terms are always computed using the latest version of the free parameters. In the parallel algorithm, < . > terms are also computed from the current parameters of the model, but they may not be used right away to update the parameters. Processes may indeed have to queue before entering the critical section to update the model. Incidentally, the < . > terms of the waiting processes may no longer correspond to those which would have been computed from the current model when the update eventually occurs. For example, two processes may compute < . > terms in parallel and reach the critical section at the same time. One of the processes would enter the section and update the model while the other would have to wait for the first to complete the update. Hence, when the second process would eventually enter the critical section, its < . > terms would no longer correspond to the current model, since it would have been updated in the meantime. This problem is known as the delay effect [56] and may in some cases damage the convergence of the algorithm if the number of processes is important.
Delay effect (Probe set) 0,9085
RMSE
0,9065 0,9045 0,9025 0,9005 0,8985
0
10
20
30
40
50
60
70
80
Epochs processes-4-vs
processes-8-vs
processes-12-vs
processes-16-vs
processes-20-vs
processes-24-vs
processes-28-vs
processes-32-vs
Figure 5.4: The delay effect
90
100
5.2. Distributed architectures
72
This delay effect was examined on the learning algorithm. Figure 5.4 illustrates its impact on the learning convergence when the number of processes is increased from 4 to 32. The number of cores was fixed to 4. As expected, convergence slightly decreases with respect to the number of processes. The more the processes, and the more the delay effect becomes visible. This result is actually quite paradoxical. On the one hand, the goal of parallelization is to make the algorithm runs faster. But on the other hand, we also observe that parallelization makes its convergence slower.
5.2
Distributed architectures
In the previous section, the learning and test algorithms of RBMs were rewritten in the context of shared memory architectures. However, as pointed out in the results, the proposed approach is of limited interest since it can fully exploit only a limited number of cores. In particular, it can only take advantage of a single blade of 8 cores of the NIC3 supercomputer. Let’s now see the bigger picture and analyze how algorithms 4.5 and 4.6 could be revisited to run on tens or hundreds of cores. More specifically, we are interested in distributed memory multiprocessor architectures in which processes executing on different processors have their own private memory. In these architectures, processors interact using a communication network rather than a shared memory. In particular, shared variables are no longer supported transparently by the operating system. It is now the duty of the programmer to synchronize processes with each other with explicit exchanges of messages. In that context, the approach that we propose is to reformulate both algorithms as MapReduce tasks.
5.2.1
MapReduce
MapReduce is a programming framework introduced by Google [21] in 2004 to support distributed computing on large datasets on clusters of computers. For years, programmers at Google implemented dozens of special-purpose routines to process large amounts of raw data, including crawled documents or web logs. Most of the computations were conceptually straightforward but they required to be distributed across hundreds or thousands of machines to finish in reasonable time. Unfortunately, the complex machinery needed to parallelize the computation, distribute the data and handle failures obfuscated the original simple algorithm with large amounts of additional code to deal with these issues. As a result, programmers designed an abstraction layer, MapReduce, that allowed them to ex-
5.2. Distributed architectures
73
press the computations they were trying to perform while hiding the parallelization, fault-tolerance or load balancing mechanisms into a library. The MapReduce abstraction is inspired from functional languages such as Lisp or Scheme. It proposes to reformulate algorithms in terms of user-defined map and reduce primitives (hence the name): • The map primitive is applied to each logical record of the input dataset. It takes as input a key/value pair and produces a set of intermediate results in the form of intermediate key/value pairs. • The reduce primitive is applied to all the intermediate values sharing the same key. Its purpose is to merge these values together and to produce a list of output values (typically 1). The main advantage of this formulation is that parallelization is automatic and entirely transparent. Since the map/reduce primitives should be designed without border effect, in a purely functional way, they can indeed be executed in parallel by different processes on different machines. In addition, the map and reduce primitives are the only operations the programmer actually has to define. Mechanisms of parallelization, data distribution, load balancing or fault-tolerance are entirely abstracted by the framework. Under the hood, the overall flow of operations (c.f., figure 5.5) in a typical implementation of the MapReduce is the following: 1. The first step in the execution of the MapReduce framework is to starts copies of the user program on a cluster of machines. 2. One of the copies is a special process called the master process. It is in charge of scheduling the operations between all the processes. The remaining copies are worker processes dispatched on various machines. Workers are assigned to map or reduce tasks (possibly both) by the master process. 3. The worker processes assigned to map tasks read the input records they are assigned to. For example, if we have 4 workers, then the first quarter of records of the input dataset might be assigned to the first worker, the second quarter to the second worker, and so on. 4. For each record, the worker processes execute the map primitive and emit intermediate key/value pairs. 5. Then, the worker processes assigned to reduce tasks gather the intermediate key/value pairs they are assigned to. Note that in a typical implementation, the master process tries to ensure load balancing when assigning key/value pairs to workers.
5.2. Distributed architectures
74
6. Finally, for each key, the worker processes execute the reduce primitive on the list of intermediate values sharing that key and emit output values. To make things clearer, let’s conclude by considering the canonical example of counting the number of occurrences of each word in a large collection of documents [21]. Algorithms 5.3 and 5.4 illustrate how such an algorithm could be implemented as map and reduce tasks. The map function (c.f., algorithm 5.3) is executed on each document and emits for each word a key/value pair whose key is the word and the value is 1. Note that the key passed in the input arguments of the map function is not used in this case but may be useful in other applications. The framework then puts together all the intermediate key/value pairs with the same key and feed them to the reduce function (c.f., algorithm 5.4). The number of appearances of a word is then computed within the reduce function as the sum of its input values. Algorithm 5.3 MapReduce - Counting words (map) Inputs: a pair (k, v) where v is a document and k is left undefined Outputs: a list of intermediate key/value pairs for all word w in document v do Emit an intermediate key/value pair (w, 1); end for
Algorithm 5.4 MapReduce - Counting words (reduce) Inputs: a word w, a list of number of occurrences l Outputs: an output pair (word, number of occurrences) sum := 0; for all value v in l do sum := sum + v; end for Emit an output key/value pair (w, sum);
5.2.2
Learning and testing over MapReduce
The MapReduce paradigm has been used with success in many large-scale applications, including bioinformatics [44], image processing [16] or web mining [21]. In machine learning, researchers proposed to reformulate some of the most famous algorithms into map and reduce tasks, notably in [19, 46]. In this section, we propose to reexpress algorithms 4.5 and 4.6 in terms of map and reduce tasks.
Dataset
(3) Read input key/value pairs
Map phase
Worker
Worker
Worker
(1) Fork
(5) Read intermediate key/values pairs
Reduce phase
Worker
Worker
(2) Assign reduce task
(1) Fork
Figure 5.5: MapReduce operation flow
(4) Generate intermediate key/value pairs
(2) Assign map task
Master
(1) Fork
User program
(6) Generate output values
5.2. Distributed architectures 75
5.2. Distributed architectures
76
Let’s first consider the learning algorithm of a restricted Boltzman machine. First and foremost, the strategy which consisted in processing mini-batches in parallel is no longer feasible in a distributed environment. This approach indeed implicitly implies that all the processes have always access to the latest version of the model. In a distributed architecture, this means that the whole bunch of parameters (i.e., the Wijk ’s, the bj ’s, the bki ’s and the Dij ’s) needs to be broadcast through the network after each update. In practice, this is not bearable since communicating millions of values (i.e., roughly 64 Mo in a typical configuration) through the network, as fast as it may be, is always much more costly than processing mini-batches composed of a few hundreds or thousands of training cases. In other words, such an approach would totally annihilate the benefits of parallelization due to the cost of communications. This would also be of very limited interest since we already have observed in section 5.1.2 that using more than a handful of processes is useless with this strategy. If mini-batches are too costly in terms of communications, one might as well totally abandon mini-batch learning and return to the very first batch formulation of the learning algorithm. In that context, the cost of communications would indeed no longer dominate the cost of processing since the few millions of free parameters would be updated only once in every entire pass over the whole dataset. Coincidentally, parallelizing the learning algorithm would amount to parallelize the computation of the < . > terms over the whole dataset and then to update the parameters among all the workers. Computing the < . > terms can be reformulated into map and reduce primitives as presented in algorithms 5.5 and 5.6. The first operation of the distributed algorithm is to split the input dataset into sublists of users and to pass those lists to the map workers. In the map phase (c.f., algorithm 5.5), the worker processes loop over the list of ratings they are assigned to and record samples of vik hj ’s, vik ’s or hj ’s into accumulators, roughly one for each free parameter of the model. In the reduce phase (c.f., algorithm 5.6), the accumulators corresponding to the same free parameter are summed together and averaged to eventually compute < . >+ − < . >T terms. Note that algorithm 5.6 is only given for the weight parameters. Analogous reduce primitive should be defined to compute the < vik >+ − < vik >T and the < hj >+ − < hj >T terms. Once the execution of the MapReduce process is over, the < . > terms are gathered on the master process and then used to eventually update the model. The new parameter values are then broadcast back to all the worker processes before starting the next learning iteration and the next MapReduce execution. Finally, note also that unlike in the concurrent implementation of the algorithm, training cases cannot be assigned dynamically during the execution of the map phase. In practice, this might result in poor load balancing, and thus degrade the performances if sublists of training cases are computationally unbalanced.
5.2. Distributed architectures
Algorithm 5.5 MapReduce - Learning algorithm (map) Inputs: a pair (k, v) where v is a list of training cases and k is left undefined Outputs: a list of intermediate key/value pairs Initialize an accumulator matrix w acc with zeroes; Initialize a counter matrix w count with zeroes; Initialize an accumulator matrix vb acc with zeroes; Initialize a counter matrix vb count with zeroes; Initialize an accumulator matrix hb acc with zeroes; for all user u in v do Clamp the ratings of u on the visible units; Compute pj = p(hj = 1|V, r) for all the hidden units; w acckij := w acckij + vik pj for all movies i rated by u as k, for all j; vb accki := vb accki + 1 for all movies i rated by u as k; hb accj := hb accj + pj for all j; Run the Gibbs sampler for T steps; Compute pj = p(hj = 1|V, r) for all the hidden units; w acckij := w acckij − vik pj for all movies i rated by u, for all j, k; vb accki := vb accki − vik for all movies i rated by u, for all k; hb accj := hb accj − pj for all j; w countkij := w countkij + 1 for all movies i rated by u, for all j, k; vb countki := vb countki + 1 for all movies i rated by u, for all k; end for Emit intermediate key/value pairs ((i, j, k), (w acckij , w countkij )) for all i, j, k; Emit intermediate key/value pairs ((i, j), (vb accki , vb countki )) for all i, k; Emit intermediate key/value pairs (j, (hb accj , |v|)) for all j;
Algorithm 5.6 MapReduce - Learning algorithm (reduce) Inputs: a key (i, j, k) and a list l of doublets (w acckij , w countkij ) Outputs: an output pair ((i, j, k), < vik hj >+ − < vik hj >T ) sum := 0; count := 0; for all (w acckij , w countkij ) in l do sum := sum + w acckij ; count := count + w countkij ; end for sum Emit an output key/value pair ((i, j, k), count );
77
5.2. Distributed architectures
78
As for the test algorithm, a very similar approach as the one developed for shared memory architectures can be used. The first operation is to split the training set into sublists of users and to pass those lists to the map processes. In the map phase, the worker processes loop over the test cases they are assigned to and accumulate the squared error. In the reduce phase, a single worker process aggregates the partial sums and eventually computes the final RMSE. Algorithm 5.7 MapReduce - Test algorithm (map) Inputs: a pair (k, v) where v is a list of test cases and k is left undefined Outputs: a list of intermediate key/value pairs error := 0; count := 0; for all (u, i) pairs in v do ˆ i); Compute R(u, ˆ i))2 error := (R(u, i) − R(u, count := count + 1; end for Emit an intermediate key/value pair (⊥, (error, count));
Algorithm 5.8 MapReduce - Test algorithm (reduce) Inputs: a key k and a list l of doublets (sum, count) Outputs: an output pair (⊥, RM SE) sum := 0; nb := 0; for all (error, count) in l do sum := sum + error; nb := nb + count; end for p RM SE = sum nb ; Emit an intermediate key/value pair (⊥, RM SE);
5.2.3
Results
The MapReduce versions of the learning and test algorithms were implemented using the MapReduce-MPI library. This library was chosen over more popular implementations of MapReduce for two reasons. First, it is C++ compliant. As a result, this allowed us to reuse the original code base and to save a lot of time. Second, it
5.2. Distributed architectures
79
uses direct message passing (through MPI) to exchange data between processes. By contrast, some more popular implementations of MapReduce, such as Hadoop, operate on top of a distributed file system to exchange data between processes. While this additional level of abstraction might ease the implementation, in particular on heterogeneous clusters of machines, the overhead that it induces was not considered worth the cost. The results presented in this section were obtained from the batch version of the learning algorithm. Since updates now occur once in every pass over the training dataset, the learning parameters were revised. Parameters γw , γh , γv and γd were set to 0.5, momentum was set to 0.25 and weight decay to 0.0001. The annealing heuristic was not used. These values were found empirically and happen to yield good results. They were however not as finely tuned as those of the mini-batch algorithm. Processes were all assigned to both map and reduce tasks. Figures 5.6 and 5.7 show the speedup and parallel efficiency of the MapReduce algorithm. Execution times were recorded when running the learning algorithm with 1 to 8 processes, as well as with 16 and 24 processes. The first thing to notice from figure 5.6 is that speedup does not stop increasing beyond a handful of cores, as it was the case with the shared memory implementation. Rather, it keeps increasing steadily. The execution time is nearly 4 times shorter when using 8 processes than when using only a single one, and gets roughly 6 and 7.3 times faster when using 16 and 24 processes. The main reason of this improvement over the shared memory implementation is that the MapReduce implementation do not include any critical section per se. Hence, processes don’t have to queue anymore. Figure 5.7 shows that parallel efficiency only decreases slightly when increasing the number of processes, which suggests that the approach is truly scalable. Throwing brutishly more cores at the problem will reduce the overall execution time. Yet, even if parallel efficiency only decreases slightly, it decreases anyway. This means that using an incredibly large number of cores might still be rather wasteful up to a point. The bottleneck of the algorithm actually comes from communications. In particular, recall that each worker generates during the map phase roughly as many intermediate key/value pairs as the number of free parameters of the model. As a result, adding more workers causes the number of intermediate pairs to inflate, hence increasing the communications required to redistribute those pairs to the reduce workers. Along the same line, the broadcast of the latest copy of the model at the beginning of every iteration may also constitute one of the bottlenecks of the algorithm. Even tough writing a dedicated distributed algorithm from scratch might have been better than using a general framework, the results obtained in terms of execution times are very satisfying. All in all, this new algorithm confirms the ability of the MapReduce framework to embody various kinds of large-scale problems.
5.2. Distributed architectures
80
Speedup 8 7
6
Speedup
5 4 3 2 1 0 1
2
3
4
5
6
7
8
16
24
Number of processes
Figure 5.6: Speedup of the learning algorithm (MapReduce)
Parallel efficiency VS. Number of processes 1 0,9
0,8
Parallel efficiency
0,7 0,6 0,5 0,4 0,3
0,2 0,1 0 1
2
3
4
5
6
7
8
16
Number of processes
Figure 5.7: Parallel efficiency of the learning algorithm (MapReduce)
24
5.2. Distributed architectures
81
Training + Generalization error 1,02
RMSE
0,97
0,92
0,87
0,82 0
20
40
60
80
100
120
140
160
180
200
Epochs mapreduce-vs
mapreduce-ls
Figure 5.8: Convergence of the learning algorithm (MapReduce) Since the learning algorithm is now implemented as a batch algorithm, it might also be interesting to reconsider the learning curves. Figure 5.8 illustrates the training and generalization error of the model over 200 epochs. In accordance with what was observed in chapter 4 regarding the size of the mini-batches, convergence is slower (in terms of number of iterations) than with mini-batch learning (indeed, this amounts to use an extremely large mini-batch). Over 200 iterations, the lowest RMSE achieved on the probe set is 0.9163 (i.e., a 3.8% improvement over Cinematch). This is far from the best RMSE achieved with mini-batch learning (0.8987), but we believe that with some more tuning of the parameters better performances could easily be obtained. More interestingly, we also observe that the learning curves now include many small oscillations. These are the result of the fact that the model is now updated less often but with much larger steps than before. In some cases, these steps might be too important, hence the small peaks in the learning curves.
5.3. Ensembles of RBMs
5.3
82
Ensembles of RBMs
The third and final approach that we propose to make restricted Boltzmann machines more scalable is to consider ensembles of models.
5.3.1
Ensemble approach
The core idea of ensemble learning [27] is to build and combine several models to form a composite and hopefully more effective model. More specifically, ensemble methods exploit an existing learning algorithm to build several models M1 , ..., MT and the aggregate their predictions. For instance, if predictions Mi (x) are numerical, they can be simply averaged: T 1X Mens (x) = Mi (x) T i=1
(5.4)
The main motivation behind ensemble methods is to build a composite model with better performances in generalization than a single model built with the original algorithm. Ensemble methods differ in the way the different models are produced and their predictions aggregated. In bagging and model averaging methods, a significant reduction of variance makes the aggregated model to be generally more accurate. In boosting and analogous methods, better accuracy is achieved by reducing the model bias. Empirically, ensemble methods have shown very good results, especially when there is a significant diversity among the models. As a result, many ensemble methods seek to promote diversity among the models they combine, e.g., by including randomization [24]. By the way, this is the reason why combining the predictions of several models worked so well during the Netflix Prize. A second argument in favor of ensemble methods is ambiguity decomposition [39]. Assume that Mens is defined as in equation 5.4. Then it can be shown that: (f (x) − Mens (x))2 =
T T 1X 1X (f (x) − Mi (x))2 − (Mi (x) − Mens (x))2 T i=1 T i=1
(5.5)
where f is the function we want to model. This result indicates that the quadratic error of the ensemble model is always lower than the average quadratic error of the models Mi . Note however that this doesn’t mean that the quadratic error of the composite model is in all cases lower than the lowest quadratic error of the submodels. In our case, the objective is not only to make the model more accurate, but also to make learning more scalable. The idea that we propose is to sample the training
5.3. Ensembles of RBMs
83
dataset, to build smaller models on those samples and then to average the predictions of these models into a composite model. The benefits are twofold. First, it is embarrassingly parallel. Smaller models can be learned independently on different machines, no matter how many they are. Yet better, each one of the smaller models can itself be built in parallel using either the shared memory or the MapReduce approach. In addition, learning will inherently be faster since only a subset of the original training set will be used. Second, the end accuracy of the final model may hopefully be better than the accuracy of a single model trained on the whole dataset. Similar ensemble approaches have been proposed in the literature to tackle very large datasets, notably in [15, 17]. This approach is indeed interesting to consider when memory is too small with respect to the size of the dataset. From a more practical point of view, ensemble methods may also be very appealing to build updatable models. Instead of rebuilding a model from scratch every once in a while, a less resource-consuming strategy might be to recompute cyclically only some of the sub-models. Say for instance that a new movie has been added recently to the database of an online retailer and that only a handful of users have rated it. Obviously, recomputing a whole new model to integrate these new ratings may not be worth the cost if resources are limited. By contrast, recomputing only some of the sub-models and gradually including the new ratings may indeed be way less expensive.
5.3.2
Results
The ensemble models presented in this section were built by combining restricted Boltzmann machines trained over random subsets of the training dataset. Submodels were all trained for 50 iterations with γw set to 0.0015, γv to 0.0012, γh to 0.1, γd to 0.001, momentum to 0.9, weight decay to 0.0001 and an annealing rate ρ set to 3. 75 hidden units were used in all machines. A first set of RBMs were trained over random samples of 5000 movies, a second over samples of 10000 movies and a third over samples of 15000 movies. All were individually trained using the shared memory implementation over 4 cores. For each set of sub-models, an ensemble model was built by averaging the predictions of the RBMs, as in equation 5.4. Note that alternatively, the training set could also have been sampled by selecting subsets of users instead of subsets of movies, or even subsets of both movies and users. The resulting ensembles of RBMs were tested over the probe set using an increasing number of sub-models. If none of the sub-models was trained on the movie for which a prediction has to be made, then the average rating of that movie was used as the prediction. Figure 5.9 shows the accuracy of the three ensemble models when the number of sub-models varies from 1 to 20. The figure also shows the accuracy of
5.3. Ensembles of RBMs
84
a single model trained with the exact same parameters but over the whole dataset. As expected, we observe that the accuracy of the ensemble models increases with respect to the number of sub-models. Just like in bagging methods, it can actually be shown that the bias of the ensemble model is the same as the bias of the sub-models but that its variance is divided by a factor T when T sub-models are combined [25]. This explains the hyperbolic aspect of the curves and why improvements become less and less significant. Unfortunately, none of the ensemble models is better than the single model, which suggests that in all cases the decrease of variance does not compensate for the increase of the model bias due to subsampling. Quite logically, the lowest RMSE is achieved by the model whose RBMs are trained over 15000 movies; it scores an RMSE of 0.9098. By contrast, the RMSE of the single model is 0.9077. It is not visible on the figure, but in terms of wall clock time, the ensembles took shorter to train than the single model. Speedup is indeed inversely proportional to the fraction of the training set the sub-models are trained on. For instance, if sub-models are trained in parallel (assuming that resources are available) on random halves of the training set, then the ensemble model can be built twice as fast as the single model. At the price of some decrease in overall accuracy, this approach might therefore be interesting to consider when computing times are heavily constrained. To prove that ensemble models are nevertheless interesting to consider in a more general case, figure 5.10 shows the accuracy of an ensemble model combining RBMs trained over the whole dataset. To promote diversity, sub-models are all initialized with random and different weights, as it is often the case ensembles of neural networks [26]. Improvements are less significant than before, but we observe that accuracy still improves when combining several RBMs together. The reduction of variance makes RMSE drop from 0.9077 to 0.9051. Finally, figure 5.11 shows the lowest RMSE of the submodels, their average RMSE and the RMSE of the corresponding ensemble model. In all cases, ambiguity decomposition holds: the RMSE of the ensemble is always lower than the average RMSE of the sub-models. It also shows that, at least in this application, the RMSE of the ensemble appears to be always lower than the lowest RMSE of the sub-models. Admittedly, this approach is the less investigated of all three methods proposed in this chapter. Better ensemble models might undoubtedly be obtained by using more elaborate aggregating schemes. The discussion has at least the benefit of experimentally showing that combining models may lead to better accuracy.
5.3. Ensembles of RBMs
85
Ensembles of RBMs (I) 1 0,99 0,98 0,97 RMSE
0,96 0,95 0,94 0,93 0,92
0,91 0,9 1
3
5
7
9
11
13
15
17
19
Number of sub-models ensemble-5000-vs
ensemble-10000-vs
ensemble-15000-vs
single-all-vs
Figure 5.9: Accuracy of ensembles of RBMs (I)
Ensembles of RBMs (II) 0,909
0,908
RMSE
0,907
0,906
0,905
0,904 1
3
5
7
9
11
13
15
Number of sub-models single-all-vs
ensemble-all-vs
Figure 5.10: Accuracy of ensembles of RBMs (II)
17
19
5.3. Ensembles of RBMs
86
Ensembles of RBMs (III) 1,1
1,05
RMSE
1
0,95
0,9
0,85
0,8 5000 movies
10000 movies Lowest RMSE
Average RMSE
15000 movies Ensemble RMSE
Figure 5.11: Accuracy of ensembles of RBMs (III)
All
Chapter 6
Summary and future work This is your life and it’s ending one minute at a time. The narrator (Fight Club)
Parallel to the growth of electronic commerce, recommender systems have become a very active area of research, both in the industry and in the academic world. The goal of these systems is to make automatic but personal recommendations when customers are presented to thousands of possibilities and do not know what to look for. In practice, these systems have become so helpful that they now constitute an integral and substantive part of the business model of most online retailers. In chapter 2, we first reviewed the main categories of recommendation algorithms. The most popular and effective approaches, namely neighborhood-based and latent-factor algorithms, were then studied in more details in the second half of the chapter. Chapter 3 was devoted to the Netflix competition that was held from 2006 to 2009. The goal of the challenge was to substantially improve the recommender system that Netflix uses to make recommendations to its customers. All in all, the challenge was a great success – partly because of the 1M$ award – and highly benefited to the science of recommender systems. Many new ideas and algorithms were proposed by dozens of hobbyists and researchers. In chapter 4, a class of machine learning models called Boltzmann machines was deeply reviewed, first from a general point of view, and then in the context of recommender systems. A full implementation of the model was written and then experimentally tested on the Netflix dataset. The results that we obtained, in terms of accuracy over an independent test set, happened to be very satisfying and came close to, or even beat, some of the results published in the literature. One of the strongest issues of the experiments carried out in chapter 4 was that computing times turned out to be unbearably long to get satisfying results. In that context, three different approaches were proposed in chapter 5 to make Boltzmann machines more scalable: • In the first approach, we proposed to revisit the learning and test algorithms in the context of shared memory architectures. The resulting algorithm showed
88 interesting characteristics but also showed serious limitations in terms of potential speedup. • In the second approach, the learning and test algorithms were reformulated into MapReduce tasks. This strategy yielded truly scalable learning and test algorithms. In practice, computing times have been greatly reduced, squeezing a few days of single-processor computations into a few hours when dispatched over a dozen of cores. • Finally, in the third approach, we proposed an ensemble method in which smaller models were trained over subsets of the training set and then aggregated together into a composite model. The results of this approach showed that ensemble learning boosted computing times (in terms of wall clock time) but also reduced the end accuracy of the model with respect to a single model trained of the whole dataset. In our opinion, the MapReduce approach stands out among the methods investigated in this work. It is indeed the only one which showed very significant improvements in terms of computing times without reducing by much the accuracy of the end model. Directions of future work include improvements of the methods proposed in chapter 5. More particularly, the MapReduce approach might be revisited to try to reduce inter-process communications. More elaborate and hopefully better aggregating strategies might also be investigated with regard to the ensemble method. So are different sampling schemes of the input training dataset. Since restricted Boltzmann machines can be used in many other applications, it might also be interesting to evaluate our scalable versions of the learning and test algorithms on other tasks than collaborative filtering, and see if accuracy and speedup are of the same order of magnitude. Another very interesting extension of this work would be to adapt our scalable algorithms to Deep Belief Networks. More fundamentally, constant advances and cost decreases in storage capacity, communication networks and instrumentations have led to the generation of massive datasets in various domains. Current machine learning techniques however, often struggle at processing such huge datasets. In that context, parallelization, as we did in this work, is a very promising direction of research to solve these new kinds of very-large scale problems.
Appendix A
Source code The source code written during this work can be downloaded at http://www. student.montefiore.ulg.ac.be/˜glouppe/TFE/. It is mainly divided into three parts: 1. python/patterns/ This directory contains a small Python implementation of restricted Boltzmann machines. This is the implementation that was used to create the example of section 4.2.3. 2. python/data/ This directory contains the Python scripts that were used to convert the raw Netflix dataset into binary and compact files. 3. cpp/ This directory contains the C++ implementation that was used throughout this work. The single-threaded, the OpenMP and the MapReduce implementations are all included in the netflix/ subdirectory. It also contains a small C++ tool that was designed to aggregate the predictions of multiple models.
Bibliography
[1] A CKLEY, D. H., H INTON , G. E., AND S EJNOWSKI , T. J. A learning algorithm for Boltzmann machines. 522–533. [2] A DOMAVICIUS , G., AND T UZHILIN , A. Toward the next generation of recommender systems: A survey of the state-of-the-art and possible extensions. IEEE Trans. on Knowl. and Data Eng. 17, 6 (2005), 734–749. [3] A MDAHL , G. Validity of the single processor approach to achieving large scale computing capabilities. In Proceedings of the April 18-20, 1967, spring joint computer conference (1967), ACM, pp. 483–485. [4] A NDREAS , T., AND M ICHAEL , J. The Bigchaos solution to the Netflix Prize 2008, October 2008. [5] A NDREAS , T., M ICHAEL , J., AND B ELL , R. M. The Bigchaos solution to the Netflix Grand Prize, August 2009. [6] A NDREWS , G. R. Foundations of Parallel and Distributed Programming. AddisonWesley Longman Publishing Co., Inc., Boston, MA, USA, 1999. [7] B ALABANOVI C´ , M., AND S HOHAM , Y. Fab: content-based, collaborative recommendation. Commun. ACM 40, 3 (1997), 66–72. [8] B ELL , R., K OREN , Y., AND V OLINSKY, C. The BellKor solution to the Netflix prize. KorBell Team’s Report to Netflix (2007). [9] B ELL , R. M., AND K OREN , Y. Lessons from the Netflix Prize challenge. SIGKDD Explorations 9, 2 (2007), 75–79.
BIBLIOGRAPHY
91
[10] B ELL , R. M., AND K OREN , Y. Scalable collaborative filtering with jointly derived neighborhood interpolation weights. In ICDM ’07: Proceedings of the 2007 Seventh IEEE International Conference on Data Mining (Washington, DC, USA, 2007), IEEE Computer Society, pp. 43–52. [11] B ELL , R. M., K OREN , Y., AND V OLINSKY, C. The Bellkor 2008 solution to the Netflix Prize, October 2008. [12] B ENGIO , Y., AND L E C UN , Y. Scaling learning algorithms towards AI. LargeScale Kernel Machines (2007). [13] B ENNETT, J., AND L ANNING , S. The Netflix Prize. In KDD Cup and Workshop in conjunction with KDD (2007). [14] B REESE , J., H ECKERMAN , D., K ADIE , C., ET AL . Empirical analysis of predictive algorithms for collaborative filtering. In Proceedings of the 14th conference on Uncertainty in Artificial Intelligence (1998), pp. 43–52. [15] B REIMAN , L. Pasting small votes for classification in large databases and online. Machine Learning 36, 1 (1999), 85–103. [16] C ARY, A., S UN , Z., H RISTIDIS , V., AND R ISHE , N. Experiences on processing spatial data with mapreduce. In SSDBM 2009: Proceedings of the 21st International Conference on Scientific and Statistical Database Management (Berlin, Heidelberg, 2009), Springer-Verlag, pp. 302–319. [17] C HAWLA , N., H ALL , L., B OWYER , K., AND K EGELMEYER , W. Learning ensembles from bites: A scalable and accurate approach. The Journal of Machine Learning Research 5 (2004), 451. [18] C HIEN , Y., AND G EORGE , E. A bayesian model for collaborative filtering. In Proceedings of the 7th International Workshop on Artificial Intelligence and Statistics (1999). [19] C HU , C., K IM , S., L IN , Y., Y U , Y., B RADSKI , G., N G , A., AND O LUKOTUN , K. Map-reduce for machine learning on multicore. In Advances in Neural Information Processing Systems 19: Proceedings of the 2006 Conference (2007), The MIT Press, p. 281. [20] D AS , A. S., D ATAR , M., G ARG , A., AND R AJARAM , S. Google news personalization: scalable online collaborative filtering. In WWW ’07: Proceedings of the 16th international conference on World Wide Web (New York, NY, USA, 2007), ACM, pp. 271–280.
BIBLIOGRAPHY
92
[21] D EAN , J., AND G HEMAWAT, S. MapReduce: simplified data processing on large clusters. In OSDI’04: Proceedings of the 6th conference on Symposium on Opearting Systems Design & Implementation (Berkeley, CA, USA, 2004), USENIX Association, pp. 10–10. [22] E ISENSTAT, S., G URSKY, M., S CHULTZ , M., AND S HERMAN , A. Yale Sparse Matrix Package. I. The Nonsymmetric Codes., 1977. [23] F UNK , S. Netflix update: Try this at home, December 2006. [24] G EURTS , P., E RNST, D., AND W EHENKEL , L. Extremely randomized trees. Machine Learning 63, 1 (2006), 3–42. [25] G EURTS , P., AND W EHENKEL , L. Apprentissage inductif appliqu´e, Lec¸on 8: M´ethodes d’ensemble et s´election de variables. 5–6. [26] H ANSEN , J. Combining predictors: Meta machine learning methods and bias/variance & ambiguity decompositions. Aarhus University, Computer Science Department, 2000. [27] H ASTIE , T., T IBSHIRANI , R., AND F RIEDMAN , J. The Elements of Statistical Learning: Data Mining, Inference, and Prediction, Second Edition, 2nd ed. 2009. corr. 3rd printing ed. Springer Series in Statistics. Springer, September 2009. [28] H INTON , G. E. Training products of experts by minimizing contrastive divergence. Neural Computation 14, 8 (2002), 1771–1800. [29] H INTON , G. E. What kind of a graphical model is the brain? In IJCAI’05: Proceedings of the 19th international joint conference on Artificial intelligence (San Francisco, CA, USA, 2005), Morgan Kaufmann Publishers Inc., pp. 1765–1775. [30] H INTON , G. E. Boltzmann machine. Scholarpedia 2, 5 (2007), 1668. [31] H INTON , G. E. CSC321 – Introduction to Neural Networks and Machine Learning, Lecture 10, 2009. [32] H INTON , G. E., O SINDERO , S., AND T EH , Y. A fast learning algorithm for deep belief nets. Neural computation 18, 7 (2006), 1527–1554. [33] H INTON , G. E., AND S EJNOWSKI , T. J. Learning and relearning in Boltzmann machines. In Parallel distributed processing: explorations in the microstructure of cognition, vol. 1: foundations. MIT Press, Cambridge, MA, USA, 1986, pp. 282– 317.
BIBLIOGRAPHY
93
[34] K ARNIADAKIS , G., AND K IRBY, R. Parallel scientific computing in C++ and MPI. Cambridge University Press Cambridge, 2003. [35] K OREN , Y. How useful is a lower RMSE?, December 2007. [36] K OREN , Y. The Bellkor solution to the Netflix Grand Prize, August 2009. [37] K OREN , Y., B ELL , R., AND V OLINSKY, C. Matrix factorization techniques for recommender systems. Computer 42, 8 (2009), 30–37. [38] K ROGH , A., AND H ERTZ , J. A simple weight decay can improve generalization. Advances in neural information processing systems (1992). [39] K ROGH , A., AND V EDELSBY, J. Neural network ensembles, cross validation, and active learning. Advances in neural information processing systems (1995), 231–238. [40] L AROCHELLE , H., B ENGIO , Y., L OURADOUR , J., AND L AMBLIN , P. Exploring strategies for training deep neural networks. The Journal of Machine Learning Research 10 (2009), 1–40. [41] L EMIRE , D., AND M ACLACHLAN , A. Slope one predictors for online ratingbased collaborative filtering. Society for Industrial Mathematics (2005). [42] L INDEN , G., S MITH , B., AND Y ORK , J. Amazon.com recommendations: Itemto-item collaborative filtering. IEEE Internet Computing 7, 1 (2003), 76–80. [43] L OHR , S. Netflix awards $1 million Prize and starts a new contest. The New York Times Magazine (September 2009). [44] M ATSUNAGA , A., T SUGAWA , M., AND F ORTES , J. Cloudblast: Combining mapreduce and virtualization on distributed resources for bioinformatics applications. eScience, IEEE International Conference on 0 (2008), 222–229. [45] N ACHEV, A. An Approach to Collaborative Filtering by ARTMAP Neural Networks. In Third International Conference INFORMATION RESEARCH, APPLICATIONS AND EDUCATION (2005), Citeseer, p. 95. [46] O WEN , S., AND A NIL , R. Mahout in action (MEAP). Manning, 2010. [47] O’C ONNOR , M., AND H ERLOCKER , J. Clustering items for collaborative filtering. In the Proceedings of SIGIR-2001 Workshop on Recommender Systems, New Orleans, LA (2001).
BIBLIOGRAPHY
94
[48] P IOTTE , M., AND C HABBERT, M. The Pragmatic Theory solution to the Netflix Grand Prize, August 2009. [49] R ESNICK , P., I ACOVOU , N., S UCHAK , M., B ERGSTROM , P., AND R IEDL , J. Grouplens: an open architecture for collaborative filtering of netnews. In CSCW ’94: Proceedings of the 1994 ACM conference on Computer supported cooperative work (New York, NY, USA, 1994), ACM, pp. 175–186. [50] R OWEIS , S. Boltzmann Machines. Lecture Notes (1995). [51] S ALAKHUTDINOV, R., M NIH , A., AND H INTON , G. E. Restricted Boltzmann machines for collaborative filtering. In Proceedings of the 24th international conference on Machine learning (2007), ACM, p. 798. [52] S ARWAR , B., K ARYPIS , G., K ONSTAN , J., AND R IEDL , J. Recommender systems for large-scale e-commerce: Scalable neighborhood formation using clustering. In Proceedings of the Fifth International Conference on Computer and Information Technology (2002), pp. 158–167. [53] S U , X., AND K HOSHGOFTAAR , T. M. A survey of collaborative filtering techniques. Adv. in Artif. Intell. 2009 (2009), 2–2. [54] S YMEONIDIS , P., N ANOPOULOS , A., AND M ANOLOPOULOS , Y. Featureweighted user model for recommender systems. In UM ’07: Proceedings of the 11th international conference on User Modeling (Berlin, Heidelberg, 2007), Springer-Verlag, pp. 97–106. [55] T HOMPSON , C. If you liked this, you’re sure to love that. The New York Times Magazine (November 2008). [56] Z INKEVICH , M., S MOLA , A., AND L ANGFORD , J. Slow learners are fast. In Advances in Neural Information Processing Systems 22, Y. Bengio, D. Schuurmans, J. Lafferty, C. K. I. Williams, and A. Culotta, Eds. 2009, pp. 2331–2339.