Combining Visual Techniques for Association Rules Exploration Dario Bruzzese
Paolo Buono
Dipartimento di Istituzioni Economiche e Finanziarie Università di Macerata 62100 Macerata, Italy +39 0733258242
Dipartimento di Informatica Università di Bari 70125 Bari, Italy +39 0805442239
[email protected]
[email protected]
ABSTRACT
together with information visualization techniques [10].
The abundance of data available nowadays fosters the need of developing tools and methodologies to help users in extracting significant information. Visual data mining is going in this direction, exploiting data mining algorithms and methodologies together with information visualization techniques.
Association Rules [1] allow to discover implicative patterns among a set of items observed on a group of cases. Let I=i1, i2, …, im be the set of m items and T=t1, t2, …, tn be the set of n cases named transactions, where each transaction ti is a subset of I , i.e. t1⊆ I ∀ i.
The demand for visual and interactive analysis tools is particularly pressing in the Association Rules context where often the user has to analyze hundreds of rules in order to grasp valuable knowledge. This paper presents a visual strategy to face this drawback by exploiting graph-based technique and parallel coordinates to visualize the results of association rules mining algorithms. The combination of the two approaches allows both to get an overview on the association structure hidden in the data and to deeper investigate inside a specific set of rules selected by the user.
An Association Rule R is an implication of the form: A → C, where A and C, named respectively antecedent and consequent of the rule, are disjoint subset of I (A∩C=∅; A,C⊂I). The informative power of each rule is measured by two indexes:
Categories and Subject Descriptors
transactions in T holding A.
nR where nR is the number of n transactions in T holding A∪C;
I.3.6 [Computer graphics]: Methodology and Techniques – Graphics data structures and data type: I.3.6 [Computer graphics]: Methodology and Techniques – Interaction techniques
SR =
•
Support:
•
Confidence: C R =
nR nA
where nA is the number of
The Support measures the proportion of transactions in T containing both A and C; it is the estimate of the probability to observe in the same transaction the items involved in the rule (SR≈P(A∩C)1). The Confidence aims at measuring the strength of the logical implication described by the rule and it estimates the conditional probability of the consequent given the antecedent (CR≈P(C|A)).
General Terms Algorithms, Languages, Theory.
Keywords
The production of association rules, like other data mining tasks, is iterative. The goal of each iteration is to produce new association rules and prune uninteresting ones but, due to the very large number of rules usually mined (which can be more numerous than the original transactions), it is useful the use of visualization techniques to facilitate the user in exploring the extracted knowledge. [9] presents different possibilities to integrate data mining tools with information visualization techniques: 1) to filter the data set before the data mining process, 2) to show the partial results during different iteration steps, 3) to present the results of the data mining tool. The tool presented in
Visual Data Mining, Graph drawing, Parallel Coordinates, Association Rules
1. INTRODUCTION The abundance of data available nowadays fosters the need of developing tools and methodologies to help users in extracting significant information. Visual data mining is going in this direction, exploiting data mining algorithms and methodologies Permission to make digital or hard copies of all or part of this work for Permission to make digital hard copies offee all provided or part ofthat thiscopies work for personal or classroom use isorgranted without are personal usefor is granted without fee provided that copies are not madeororclassroom distributed profit or commercial advantage and that not made distributed forthe profit commercial advantage andcopy that copies bearorthis notice and full or citation on the first page. To copies beartothis notice and first page. To otherwise, republish, to the postfull on citation servers on or the to redistribute to copy lists, otherwise, to specific republish, to post on servers requires prior permission and/or a fee.or to redistribute to lists, requires permission and/or fee. AVI '04,prior May specific 25-28, 2004, Gallipoli (LE),a Italy AVI 2004, Gallipoli (LE), Italy © 2004 ACM 1-58113-867-9/04/0500..$5.00 © 2004 ACM 1-58113-867-9/04/0500..$5.00
1
381
When dealing with a probabilistic notation, A and C must be considered as the events describing the presence of the corresponding itemsets in a generic transaction while in the original association rules notation A and C represent sets of items. This is why either union (∪) or intersection (∩) symbols are exploited according to the specific framework is being used.
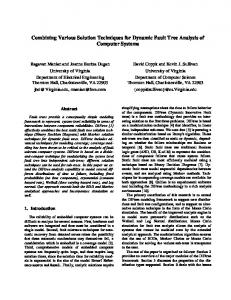
string “ed_on_M63(A)”, B is the string “close_to(A,B)”, and C is the string “relate_meet(A,B)”). Both antecedents and consequents of rules are coded with a label and colored rectangle (left frame) or with a colored circle (middle frame). In the prototype red is used for the antecedent, green for the consequent, the colors may be changed by the user. The rectangles are more useful when there are few rules to visualize. Textual description of antecedents or consequents can be shown as label in the rectangles and the user may see the details of the rules. The usual visualization of several rules is the one shown in the middle frame of the Figure 1, i.e. colored circles are used to reduce screen cluttering. Moreover, when the user goes with the cursor on a link, both antecedent and consequent are shown as labeled rectangles as visible in the right frame of the Figure 1, so that the details of the rule are visualized and the user may further investigate the rule. The confidence of a rule is coded by the length of the edge, the bigger is the confidence, the longer is the edge connecting the antecedent and the consequent. The support is coded by color: light blue means low support values, dark blue means high support values, up to black edges, which means a support of 100%.
this paper aims to help the data miner to interact both with partial results of association rules extraction algorithm and with the final association rule set. An example of the combination of two different visual approaches to work with association rules is presented. According to the Visual Data Mining paradigm, the proposed tool allows an interactive and explorative analysis of the whole set of mined association rules. The goal is to assist the user in transforming rough information in actionable knowledge.
2. VISUALIZING ASSOCIATION RULES IN A SOFTWARE TOOL There are several works that deal with the visualization of association rules. Some of these focus the attention primarily to the relationships among items by exploiting clustering techniques like VisualMine [7] but in most cases the user is not allowed to explore the relationships among different rules. Other tools analyze the rules in more detail with different techniques, like graph [8], but loosing the overview of the entire data set. Finally, other works use scatter plots or matrix, both 2D and 3D (see e.g. [11]), but the interpretation of the visualization is quite difficult and usually no interactive facilities are provided.
This graph representation easily reveals association rules that share the antecedent or the consequent. Such kinds of rules were not easy to find in the textual representation.
In this section two techniques to visualize association rules are presented: the first relies on a graph/based approach and the second exploits parallel coordinates to perform the same task from a different but complementary perspective.
Moreover, graph representations present problems related occlusion and scalability. To overcome this problem, various interaction mechanisms are provided, that allow the user to move a graph from one position to a different one on the screen by simply selecting, with a mouse click, the graph to move.
2.1 A Graph-Based Approach In [3], was first introduced a graph-based technique that allows a user to visualize a great number of association rules. Adding interaction, the user may manipulate the graph to explore association rules. The graph visualization is very useful to see the overall distribution of the rules, it is possible to immediately recognize relationships among different rules and between the antecedent and the consequent of the rules. As said in the introduction, the typical representation of association rules is: antecedent → consequent (A → C). The arrow represents the existing relationship between the antecedent and the consequent. Support and confidence are typical indicators for rules, but it is also possible to use other indicators.
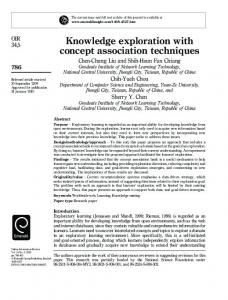
Figure 2. 9785 association rules shown in one screen
The visualization technique maps the text into a visual structure that gives more insights to the user. It is important to represent relationships among data hence graph visualization has been adopted, linking each antecedent to the related consequent.
In Figure 2, two different visualizations of a same set of about 10000 association rules is shown. To produce visualization of the right frame of the Figure 2, the user has modified the graph at the bottom center of the screen, so that the group of nodes is now better visible. Occlusion occurs primarily in static representations, so we generated dynamic visualizations with the use of animation. The graph moves according to the force-directed technique [4], showing the user a more clear view of a sub-graph. In the example of Figure 2, the user may easily see that there is a node (that in the figure is depicted as two semi-disc coloured with green and red respectively) that has almost all the links with the black colour (in the right frame of the Figure 2). What can the user get? The use of both colours, green and red, means that the selected node is an antecedent for a set of rules and it is a consequent for another set of rules. The black colour on almost all the links means that the group of rules has a confidence of 100%, that means that the rules has a strong statistical significance, so it
Figure 1. Two association rules represented in a graph Figure 1 depicts two association rules that are the results of a step of the data mining iterative process. The rules presented have the same antecedent: “A → B” and “A → C” (in Figure 1 A is the
382
is interesting to explore the set of rules related to this node. Another investigation may be performed by the user on the nodes with the longest edges, this could means that the node has a high support, that is another information for further investigating on that set of rules. When the user discovers a potential interesting pattern he may try to further investigate on the group of rules using another tool that exploits parallel coordinates technique; this can be done by selecting a group of rules of interest and, by using a pop-up menu, the user may send this group of rules to the parallel coordinates visualization tool, that is described in the next section.
figures (b) and (c) represent the rules obtained deleting, respectively from (a) and (d), the item y. It can be noticed that in the first case (a and b in Figure 3) the item y is very useful, because if it is dropped out by the rule, the confidence decreases from 1 to 0.4 (IU=+0.6); in the second case (c and d in Figure 3) the item y should not be considered as the rule x∩¬y→z is characterized by a stronger confidence (IU= -0.375). Finally, the descriptive approach for the assessment of the relevance of each item based on the IU index can be supported by the evaluation of the statistical significance of the difference between the Confidence of the rule with and without each item in the antecedent using a classical p-value approach.
2.2 A Parallel Coordinates Approach Parallel Coordinates [6], allow to visualize, on a 2d graph, ndimensional data sets (n>>2) by transforming the original dimensions in vertical axis parallel to each others. A point in ℜn is represented, in the Parallel Coordinates space (||-cords), by a line joining its values on the axes.
The ||-coords visualization of Association Rules exploits all the interactive functionalities of such method in order to assist the user in the Visual Data Mining process: selecting one or more lines with IU below a user specified threshold in order to remove those lines from the plot; changing the order of the items, selecting axis with very high and dense IU values and so on.
A visualization of association rules, based on ||-coords, has been proposed in [2] allowing to visualize groups of rules characterized by the same consequent. The antecedent items involved in the subset of rules become the dimensions of the graph; each rule crosses the axis according to the utility provided by the corresponding item to the rule.
In Figure 4 a plot of a subset of 774 rules characterized by the same consequent is shown. The user can decide which subset visualize by selecting a consequent item from a list box; the system automatically displays, in the ||-coords space, all the rules with that consequent and adds two supplementary dimensions for Support and Confidence measures (the order with which the items are initially arranged in the plot depends on the order they appear in the original database of transactions).
The utility of a generic item i in a rule R, is measured by comparing the confidence of the rule with and without the item i. Considering the rule R: x∩y→z2 , the Item Utility (Bruzzese & Davino, 2003) of the item y is defined as follows:
IU i =
C R − C R ( ¬y )
(
max C R ; CR ( ¬y )
)
where CR(¬y) represents the confidence of the rule x∩¬y→z. The IU ranges in the interval ]-1;+1] taking positive values for those items whose absence in the rule causes a decrease in the confidence, (CR>CR(¬y)), while it takes negative value for those items which reduce the predictive power of the rule (CR