decisions will be made about true and false null hypotheses, giving the ... Keywords: P-values, hypothesis evidence, hypothesis testing, statistical power, null ...
American Review of Mathematics and Statistics June 2017, Vol. 5, No. 1, pp. 1-6 ISSN: 2374-2348 (Print), 2374-2356 (Online) Copyright © The Author(s).All Rights Reserved. Published by American Research Institute for Policy Development DOI: 10.15640/arms.v5n1a1 URL: https://doi.org/10.15640/arms.v5n1a1
Comments and Suggestions on Defining and Using P-Values and Null Hypothesis Tests David Marshall1 & Keston Lindsay2 Abstract Recent corrections of fallacious language about P-values preserved the debatable definition of the P-value as an element of evidence for or against a null hypothesis. Hypothesis tests are mathematical simulations. Simulations provide expectations about modeled outcomes and cannot provide empirical evidence concerning the object of the simulation. No element of the H0 test simulation, including the P-value, provides “evidence” for or against a hypothesis. Adequately powered hypothesis test simulations provide very encouraging predictions that correct decisions will be made about true and false null hypotheses, giving the researcher confidence that a correct decision about the hypothesis will be made. Computed test statistics and their related P-values remain useful as after-the-fact decision tools, while sample data and descriptive statistics make the sole empirical evidentiary base of support for a hypothesis. Keywords: P-values, hypothesis evidence, hypothesis testing, statistical power, null hypothesis 1. Introduction 1.1 Defining and using P-values, current status The American Statistical Association (ASA) has responded to perennial concerns about conventional P-value hypothesis testing. A statement of six principles was formulated (Wasserstein & Lazar, 2016), to clarify proper definitions and uses of P-values in hypothesis tests, and provide benefit to the scientific community. The wellarticulated and detailed principles were neatly summarized in an online press release (ASA, 2016) as follows: 1. P-values can indicate how incompatible the data are with a specified statistical model. 2. P-values do not measure the probability that the studied hypothesis is true, or the probability that the data were produced by random chance alone. 3. Scientific conclusions and business or policy decisions should not be based only on whether a p-value passes a specific threshold. 4. Proper inference requires full reporting and transparency. 5. A p-value, or statistical significance, does not measure the size of an effect or the importance of a result. 6. By itself, a p-value does not provide a good measure of evidence regarding a model or hypothesis.
1David
Marshall, Ph.D. Professor, Department of Mathematics and Computer Science, The Texas Woman’s University, Denton, Texas, USA 2Keaston Lindsay, Ph.D. Assistant Professor, Department of Health Sciences, University of Colorado, Colorado Springs, Colorado, USA
2
American Review of Mathematics and Statistics, Vol. 5(1), June2017
The principles have the appearance of being logically and mathematically sound, and are expected to help resolve the debates about the usefulness of P-value hypothesis tests. Such information would lend to the elimination of flawed thinking and language in textbook treatments and classroom instruction about hypothesis testing, and flawed interpretations in scientific papers that use P-value null hypothesis tests, assuming that such practices will be continued. We note that the American Psychological Association (APA) had much earlier conducted a similar exercise (Wilkinson, 1999), though focused more on the integrity of research design and reporting strategies concerning hypothesis test results, and directly in response to a call for a ban on P-value hypothesis testing (Kirk, 1996; Schmidt, 1996; Schmidt and Hunter, 1997). APA concluded that researchers should continue to report P-values, though not in making an -based binary reject/do-not-reject decision about the null hypothesis, that one should never say “I accept the null hypothesis” (thus certifying the now-required wording “I fail to reject the null hypothesis”), and that confidence intervals and computed estimates of effect size should be added to reports. Hypothesis decisions should incorporate all such sources of information, not only the P-value. 1.2 A remaining problem with P-value definitions In the continuing discussion of the P-value we find a lingering weakness when defining and interpreting the probability, contained in the statement of principles, to wit that a P-value provides “evidence” in favor of or against the null hypothesis. The longstanding definition of the P-value as evidence is a potentially misleading statement of such common and appealing appearance that it is easily overlooked. The language of P-value instruction and practical interpretation can be unnecessarily figurative and thus uninformative, as well as inaccurate and thus misleading. The claim that a P-value provides “evidence” for or against a null hypothesis or H0 is at best a figure of speech, a flat assertion that P-values provide evidence favoring one or another hypothesis. Schervish (1996) states that, “This suggestion is always informal, and no theory is ever put forward for what properties a measure of support or evidence should have” (p. 204). It would seem that asserting P-values as items of evidence is done without benefit of proof that they are in fact evidence. We consider that Wasserstein et al. effectively confronted several tenacious fallacies about Pvalues in the second and fifth of their principles, but they retained the potentially confusing term “evidence,” at best as a metaphor, in two others. Beginning students would be well served by learning operational, not figurative definitions of hypothesis test procedures and tools such as the P-value. We will analyze hypothesis tests and the P-value in view of the claim that they provide evidence, and offer a justification for using hypothesis tests that does not rely on the insupportable assertion that either the P-value or any other aspect of a hypothesis test provides evidence, literally or otherwise, about the truth of a hypothesis. Properly conceived, the hypothesis test provides a useful context for gauging assumptions about population parameters, without providing mathematical evidence in support of any hypothesis or any decision about hypotheses. The hypothesis test is a simulation, which gives expectations about outcomes and nothing more, in “what if” or “as if” exercises that affect researchers’ beliefs. 2. On Evidence 2.1 That P-values provide evidence Wasserstein et al. (2016) provide the popular yet debatable portrayal of the P-value as an item of evidence in the full text of the first principle, and in the sixth principle:“1. P-values can indicate how incompatible the data are with a specified statistical model… the smaller the P-value the greater the statistical incompatibility… [which] can be interpreted as casting doubt on or providing evidence against the null hypothesis…” [emphasis added] (p. 8). “6. By itself, a P-value does not provide a good measure of evidence regarding a model or hypothesis” [emphasis added] (p. 11). Modern textbooks endorse this reasoning. For example, Rossman and Chance (2012) say that “…the smaller the Pvalue, the stronger the evidence against the null hypothesis…” (p. 359), while Moore, McCabe and Craig (2009) also offer that “The smaller the P-value, the stronger the evidence against H0 provided by the data” (p. 377). Starnes,Yates, andMoore (2011) assert that “… (small P-values) aregoodevidence that the null hypothesis is not true” [emphasis added] (p.465).
Marshall & Lindsay
3
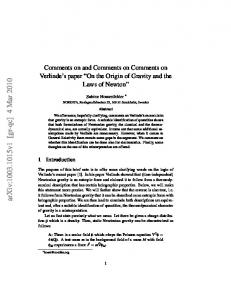
Note that, by implication, the larger the P-value the stronger the evidence in favor of H0, that is, the stronger the evidence that H0 is true. Given the operations of a hypothesis test, a decision to reject or not reject H0 is universally prompted by the observance of a P-value, because P-values are displayed on calculator and computer screens and printouts. Many decades of tradition have inaugurated the P-value as the presumed sine qua non of practice. Students of statistics will learn to use P-values, and will likely learn that P-values make for evidence on the truth of H0, when in fact the potential for a test to detect true hypotheses lies in prior statistical power, not in the posterior Pvalue. 2.2 Why H0 tests and their P-values cannot provide evidence Technically speaking, P-values define the chances that sampling errors of certain sizes or larger will be observed, when and only when H0 is true. Thus, no P-value can serve as evidence against its own definition. We note that Schervish (1996) disqualified P-values as measures of support or evidence based on another technical weakness; under certain conditions, a P-value lacks “coherence” in that it will permit contradictory conclusions for each of two hypotheses that imply each other. However, such technicalities seem trivial in comparison to the most fundamental fact that renders a hypothesis test incapable of providing “evidence.” Appropriately designed hypothesis tests are mathematical simulations of two competing assertions about population parameters, each of which is defined as true, and which demonstrates the predictability of sampling error when drawing samples from either model (see Figure 1). Note well that simulations of any phenomenon provide expectations about outcomes; they do not produce and provide empirical evidence concerning the object of the simulation.
Figure 1. Ideal mathematical models for a one-tailed t-test between the means of independent groups with α = 0.05, β = 0.05, using sample sizes of n1 = n2 = 88, alternative effect magnitude d = 0.50, and power of 95 percent.NOTE: Adapted from G*power (Erdfelder, Faul, & Lang, 2009). The simulationcan be designed so that it provides very high expectations that an eventual sampling operation will lead to a correct hypothesis decision, no matter whether H0 is true or false, such as is portrayed in Figure 1. The given model diagrams a t-test between independent means while postulating a true alternative effect of moderate magnitude or d = 0.50 (Cohen, 1988). We observe probabilities of 95 percent apiece that the true hypothesis will not be rejected, giving overwhelming odds that sample data will not lead to decision errors.
4
American Review of Mathematics and Statistics, Vol. 5(1), June2017
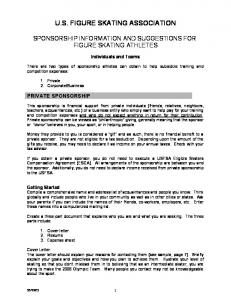
The mathematical H0 simulation begins with the assertion of mathematical models that represent two competing hypotheses, and ends with placement of sample data within the H0 model, as if a data summary had been sampled from that population. Data appearing within a rejection region, beyond a selected critical value of a test statistic, and/or having a sufficiently small P-value will evoke rejection of the null hypothesis. The researcher can trust such powered statistical models to lead to a correct decision about H0, and thereby prepare to cast strong doubt on H0 or express strong belief in the hypothesis. The value of a hypothesis test design is in its relative potential to give a researcher confidence that a false hypothesis will be rejected, that is, that a true hypothesis will not be rejected once data are drawn and statistics are computed (Marshall, Falley and Hamner, 2015). The design and particulars of the H0 test do not include any information or potential discovery that serves as after-the-fact evidence that a correct decision has been made, only that a correct decision is likely to be made, and only prior to obtaining actual sample data. Incorrectly identifying the size of the P-value as the strength of evidence giving confidence in one’s hypothesis decisions obscures the one true basis for such confidence, which is the potential of an adequately powered design to detect a true hypothesis. The powered sampling context is expected to reveal the truth, while the P-value only signals that H0 should be rejected or not rejected as the formal and traditional outcome of the simulation. Figure 2 defines a proposed hypothesis test that is not likely to reject H0, no matter whether the hypothesis is true or false. The probabilities that H0 will not be rejected are enormous regardless of whether the hypothesis is true (95 percent) or false (72 percent). When H0 is false, the vast majority of the sampled P-values will be larger than 5 percent, every one of which will provoke a Type II error, none of which provide evidence that H0 is true, and none of which will demonstrate that a correct decision has been made. The researcher who knows such facts in advance would be wise to abandon the test, and otherwise will not be able to stand by an eventual decision to not reject H0, will not be able to profess strong belief in H0.
Figure 2. Compromised mathematical models for a one-tailed t-test between the means of independent groups with α = 0.05, β = 0.72, using sample sizes ofn1 = n2 = 10, alternative effect magnitude d = 0.50, and power of 28 percent. The researcher who is not aware of the dismal odds that false H0 will be rejected will profess belief in H0 just the same, taking the large P-value as “good evidence that H0 is true.” Given such an example, Cohen’s (1990) remark makes perfect sense, that “…failure to subject your research plans to power analysis is simply irrational” (p. 1310). Proper study design predicts outcomes and decision-making which can be trusted to accurately identify population parameters, at least “on paper” when designing an inferential study. 2.3 Subjectivity and the H0 test
Marshall & Lindsay
5
Hypothesis tests provide no evidence about hypotheses, but we agree that the smaller the P-value the more difficult it is to believe in H0 as an explanation for sample data and a description of population parameters. P-values are facts that, by their sizes, can “cast doubt on” H0 as an explanation for data, but if and only if “strength of belief in H0” is at stake. Starnes et al. (2011) add that “AP-valuetellsushowsurprisingtheobservedoutcomeis” [emphasis added] (p. 465). The legitimate bases for rejecting or not rejecting H0 are degrees of surprise at a result and personal doubt in the H0 proposition, and not because of an ineffable habit based on the tradition of claiming evidence against H0.The terminal point of a hypothesis test is said to involve doubt and surprise, which are subjective states of mind.Regardless, these are purely psychological equations, subjective reactions to the mathematics, without benefit of further mathematical or empirical support from the hypothesis test context per se. Products of the simulation do not provide evidence in verifying the wisdom of one’s relative doubt about or belief in H0 (thus the value of the adage that we never know if H0 is true or false.) Glass and Stanley (1970) long ago rhapsodized that, “…the best one can do is to make a decision about H that has a high probability of being true” (p. 281), and their proclamation implies that such a fortunatedecision will be supported by high values of 1.0 – α and 1.0 – β, the probabilities that true H0 will not be rejected and that false H0 will be rejected, respectively. The ultimate outcome of a hypothesis test can be said to be comfort or discomfort about the decision made to reject or not reject H0, based solely on prior probabilities that correct decisions would be made. However, the decision about H0 cannot be verified by any materials of the hypothesis test. One can only trust the decision to be correct if the probabilities that correct decisions would be made were carried in large values of 1.0 – α and 1.0 – β. Moreover, when a hypothesis test is properly powered, data that rejects H0 might not be surprising since such data are expected when HA is true, that is, when H0 is false. 2.4 P-values and sampling designs The P-value is not in the probability set that provides chances that true and false hypotheses will be rejected, nor is the P-value an indicator that a false hypothesis has been correctly rejected or not rejected. The set of probabilities that predict correct and incorrect decision-making includes, and only includes 1.0 – α and 1.0 – β. The Pvalue merely identifies, in an abstract and indirect way, the extent to which observed sample data sit far from or nearby the H0 parameter. Given any P-value that is sufficiently small to evoke rejection of H0, there is a related test statistic that is sufficiently large, and the statistic directly gives birth to the P-value, as a function is integrated from the location of the test statistic to its right or left onward to infinity. P-values ride the coattails of test statistics, and subjective doubt about or confidence in the truth of H0, based on the extent to which data stray from the H0 parameter as reflected in the P-value, makes for the conclusion of the H0 test. Hogg, Tanis, and Zimmerman (2015) describe the phenomenon quite formally: “The P-value associated with a test statistic is the probability, under the null hypothesis H0, that the test statistic (a random variable) is equal to or exceeds the observed value (a constant) of the test statistic in the direction of the alternative hypothesis. Rather than select the critical region ahead of time, the P-value of the test can be reported and the reader then makes a decision” (pp. 376-377). The P-value is a quite handy tool; what seems small for a P-value is readily apparent as compared with what seems large for a corresponding test statistic. If a P-value appears sufficiently small to satisfy the user’s taste, then H0 can be rejected. However, neither a computed value of a test statistic nor its related P-value lends any additional information to further confirm, certify or otherwise uphold the decision to reject or not reject H0. 3. Empirical evidence and hypothesis tests The sole sources of concrete evidence in favor of any hypothesis are observed data and data summaries. Abundant empirical “evidence” favoring a hypothetical explanation for an experimental or survey outcome would be found in the actual data and data summaries of plentiful replications, and not in any of the materials of hypothesis tests applied to such data. For example, the alternative hypothesis HA: µ1> µ2 is given prima facie, tacit support by sample mean values appearing as M1>M2, with an associated effect size of d = 1.00, which would be deemed of large magnitude by Cohen’s (1988) standards. Multiple appearances of similar results occurring across studies would provide an empirical data base favoring HA, and make grist for the meta-analyst’s mill.
6
American Review of Mathematics and Statistics, Vol. 5(1), June2017
4. Summary We are obliged to establish validity and reliability for measures we use in research. We can depend on valid and reliable measures to provide information that is relevant (valid) and accurate (reliable). Powered study designs can similarly be depended upon to provide correct answers to questions about population parameters. The H0 test, as a simulation, is part of a larger research process, an element of a strategic and tactical complex intended to provide correct answers to research questions. The research design is not intended to “find statistical significance” as secured by a P-value, but rather to establish measured chances that correct decisions will be made and that useful conclusions will be drawn. Teaching hypothesis testing from a modern statistical power perspective identifies a test as an opportunity to set the occasion for profitable, correct decision-making, and not as a process that provides after-the-fact evidence about H0, or after-the fact support of a decision about H0. P-values and computed test values trigger pronouncements for or against H0, while pre-sampling probabilities, including adequate power, provide the chances that such declarations will be correct. The mathematical apparatus of thepowered H0 test virtually assures the researcher that a correct decision will be made about H0 once data are gathered, assuming that the simulation approximates a realworld process. Diminishing P-values herald ever-increasing differences between observed data and the null hypothesis, and, as a consequence, belief in H0 weakens. The word “evidence” is not needed when describing the reason for rejecting or not rejecting H0, and would be extraneous if added to the foregoing sentence. Relative faith in the decision to reject or not reject H0, in the absence of evidence, is the final outcome of the inferential process. Such faith is based on the design of a study in its prior capacities to reject false hypotheses, regardless of whether H0 or HA is true, and not on the appearance of data modeled as a sampling error when H0 is true, that is, on the P-value. 5. References ASA. (2016), www.amstat.org/asa/files/pdfs/P-ValueStatement Cohen, J. (1988), Statistical Power Analysis for the Behavioral Sciences (2nd Ed.). Hillsdale, N.J.: L. Erlbaum Associates. Cohen, J. (1990), “Things I Have Learned (so far).” American Psychologist, 45(12), 1304-1312. Erdfelder, E., Faul, F., & Lang, A. (2009). G*Power (Version 3.1.2)[Computer program], http://www.psycho.uniduesseldorf.de/aap/projects/gpower/ Glass, G. V., and Stanley, J. C. (1970), Statistical Methods in Education and Psychology, Englewood Cliffs, N. J.: Prentice-Hall, Inc. Hogg, R. V., Tanis, E. A., & Zimmerman, D. L. (2015), Probability and Statistical Inference (9th Ed.). Boston, MA: Pearson. Kirk, R. E. (1996), “Practical significance:A Concept Whose Time Has Come.”Educational and Psychological Measurement, 56(5), 746-759. Marshall, D. D., Falley, B. N., & Hamner, M. S. (2015), “Hypothesis Testing and Statistical Confidence: An OverdueObservation on the Efficacy of a Hypothesis Test.” American Reviewof MathematicsandStatistics, 3(1), 22-26. DOI: 10.15640/arms.v3n1a3. Moore, D. S., McCabe, G. P., & Craig, B. A. (2009), Introduction to the Practice of Statistics (6th Ed.), New York: W. H. Freeman and Company. Rossman, A. J., & Chance, B. L. (2012), Workshop Statistics: Discovery With Data (4th Ed.). Hoboken, NJ: John Wiley and Sons. Schervish, M. J. (1996), “P Values: What They Are and What They Are Not.” The American Statistician,50(3),203-206. Schmidt, F. L. (1996), “APA Board of Scientific Affairs to Study Issue of Significance Testing, Make Recommendations.” Score, 19, 6. Schmidt, F. L., & Hunter, J. E. (1997), “Eight common but false objections to the discontinuation of significance testing in the analysis of research data.” In L. L. Harlow, S. A. Mulaik, & J. H. Steiger (Eds.), What If There Were No Significance Tests? (37-64). Mahwah, N. J.: Lawrence Erlbaum. Starnes,D.S.,Yates,D.,&Moore,D.S.(2011),StatisticsThroughApplications. NewYork,NY:W.H.Freeman andCompany. Wasserstein, R. L., & Lazar, N. A. (2016), “ASA Statement on Statistical Significance And P-Values.” The American Statistician, DOI: 10.1080/00031305.2016.1154108. Wilkinson, L., and the APA Task Force on Statistical Inference, APA Board of Scientific Affairs. (1999), “Statistical Methods in Psychology Journals: Guidelines and Explanations.”American Psychologist, 54: 594-604.