AUGUST 2009
NOTES AND CORRESPONDENCE
2703
NOTES AND CORRESPONDENCE Comments on ‘‘Structure and Formation Mechanism on the 24 May 2000 Supercell-Like Storm Developing in a Moist Environment over the Kanto Plain, Japan’’ MATTHEW J. BUNKERS NOAA/National Weather Service, Rapid City, South Dakota
DARREN R. CLABO South Dakota School of Mines and Technology, Rapid City, South Dakota
JON W. ZEITLER NOAA/National Weather Service, New Braunfels, Texas (Manuscript received 11 December 2008, in final form 3 February 2009)
1. Introduction Shimizu et al. (2008, hereinafter S08) presented an interesting case study of a rare severe nontornadic storm over the Kanto Plain in Japan—a storm that we contend was in fact a supercell. S08 labeled this as only a ‘‘supercell-like storm’’ based on perceived similarities and differences to supercells that occur across the U.S. Great Plains. The authors further suggested that midtropospheric relative humidity (RH) is an environmental factor involved in the formation of supercells, and as such somehow helped produce supercell-like characteristics in the Kanto Plain storm. The purpose of this comment is to elaborate on the storm characteristics and its environment, and to demonstrate that it indeed was a supercell by conventional definitions. Whether or not to call the Kanto Plain storm a supercell may appear to be semantics; however, to operational forecasters the proper early identification of a storm as a supercell has important implications for the warning process (e.g., Moller et al. 1994), as is discussed in more detail below. Attention also is drawn to moist supercellular environments in the United States to show they are not that different from the environment of the
Corresponding author address: Dr. Matthew J. Bunkers, National Weather Service, 300 East Signal Drive, Rapid City, SD 57701-3800. E-mail:
[email protected] DOI: 10.1175/2009MWR2909.1
Kanto Plain supercell; in fact, they may be considerably more moist.
2. Supercell definitions and the Kanto Plain storm a. Supercell definitions The general definition of a supercell is a convective storm with a deep, persistent mesocyclone (or mesoanticyclone) that has a relatively high positive (or negative) correlation between vertical vorticity and vertical velocity (r $ 0.4; Weisman and Klemp 1984).1 Rotation is first observed in the midlevels of a supercell due to tilting of environmental horizontal vorticity into the updraft followed by subsequent stretching (Davies-Jones 1984). The depth and persistence of the circulation, as well as the minimum vertical vorticity magnitude (or tangential shear of the radial velocity when evaluated with singleDoppler data), have been defined in a variety of ways (Table 1). The latter criterion typically is associated with 1 The correlation between vertical vorticity and vertical velocity does not reach unity because, among other things, the notion of a purely rotating updraft is ideal. Lemon and Doswell (1979) suggested that the ‘‘rotating updraft’’ evolves to a divided mesocyclone as the supercell matures (i.e., the mesocyclone comes to include regions of downdraft); as such the updraft is more aptly described as ‘‘spiraling’’ (e.g., Fankhauser 1971, see his Fig. 19). This divided mesocyclone structure is most prevalent in the lower troposphere, and less apparent from the midlevels upward where the mesocyclone and updraft can remain significantly associated.
2704
MONTHLY WEATHER REVIEW
VOLUME 137
TABLE 1. Mesocyclone definitions based on various published literature. Refer to section 2 for the corresponding discussion. Parameter Depth of circulation
Persistence of circulation
Min vertical vorticity
Definition
References
1) Height greater than diameter 2) Significant fraction of the convective storm cloud (usually several kilometers) 3) At least one-third of the convective storm’s depth 4) $3 km 1) $10 min 2) On the order of a few tens of minutes 3) $30 min 1) $0.5–0.6 3 1022 s21 2) $0.3–0.6 3 1022 s21 3) $1 3 1022 s21
a minimum single-Doppler velocity differential of 22–30 m s21 across the mesocyclone/mesoanticyclone. Moreover, the observed velocity differential or tangential shear is range dependent (e.g., Stumpf et al. 1998), with lower thresholds at farther ranges because the measured peak velocity values—relative to the true values—decrease with range as a result of beam broadening (e.g., Donaldson 1970). In their operational study of tornadic versus nontornadic supercells, Thompson et al. (2003) employed a minimum time criterion of 30 min and a minimum azimuthal shear threshold of 0.2 3 1022 s21 (calculated using 1-km resolution velocity data) through only the lowest two elevation angles of the radar in order to identify a storm as a supercell. This shear threshold corresponds to a minimum velocity differential of 20 m s21 across not more than a 10-km width, and is slightly lower than the minimum vertical vorticity value given in Table 1. Thompson et al. (2003) additionally required the presence of reflectivity signatures such as hook echoes or inflow notches for their right-moving supercells. Although this definition of a supercell differs somewhat from those cited in Table 1, it still represents the triad of rotation, depth, and persistence that have become the hallmarks of a supercell.
b. Supercellular characteristics of the Kanto Plain storm S08 did not consider the Kanto Plain storm a supercell primarily because they thought that rotation of sufficient strength did not persist long enough. Nevertheless, the maximum midlevel vertical vorticity for the Kanto Plain storm, derived from a dual-Doppler analysis, exceeded 1 3 1022 s21 for 30 min from 1154 through at least 1224 Japan standard time (JST; S08, 2395–2396). And at 1224 JST the maximum vertical vorticity was
Donaldson (1970) Doswell and Burgess (1993)
Moller et al. (1994), Doswell (1996) Burgess (1976), Stumpf et al. (1998) Donaldson (1970), Burgess (1976), Stumpf et al. (1998) Doswell and Burgess (1993), Moller et al. (1994), Doswell (1996) Browning (1977) Donaldson (1970), Burgess (1976), Burgess et al. (1982) Burgess and Lemon (1990), Stumpf et al. (1998) Brandes (1993), Moller et al. (1994), Doswell (1996), Weisman and Rotunno (2000)
.1.2 3 1022 s21 at 4 km MSL. This is at or above the most stringent minimum criteria for vertical vorticity and persistence given in Table 1 (i.e., $1 3 1022 s21 and $30 min, respectively). Furthermore, the Kanto Plain storm displayed a hook echo and bounded weak-echo region (BWER) during this time as shown by S08 (p. 2396 and p. 2399, respectively), which is further evidence of organized storm-scale rotation. The hook echo actually persisted until 1236 JST according to S08 (p. 2405). These items alone are enough to garner supercell status for the Kanto Plain storm; hence, it is not clear why the storm would be labeled as only supercelllike. Marwitz (1972, p. 166) went so far as to say that ‘‘a hook near cloud base is probably a sufficient condition to identify a particular storm as a supercell storm.’’ Indeed, Browning (1964) established the structure of a supercell using only reflectivity data—well before Doppler radar data were readily available to ascertain vertical vorticity. Over half of the mesocyclone definitions cited in Table 1 have a lower bound of vertical vorticity/ tangential shear around 0.5 3 1022 s21. This is shown clearly in Burgess (1976, see his Fig. 3) as well as in Burgess and Lemon (1990, see their Fig. 3.4). There was no evidence for a lower bound of 1.0 3 1022 s21 in Burgess and Lemon (1990), as was suggested by S08. The mesocyclonic stage of the Kanto Plain storm, therefore, would have been longer than 30 min using the lower bound of 0.5 3 1022 s21. Even though S08 stated that maximum vertical vorticity was ,0.4 3 1022 s21 before 1154 JST, this was calculated below 4–4.5 km MSL. Yet Burgess (1976) suggested scanning from 3 to 7 km AGL to detect the midlevel mesocyclone, which is where rotation typically is strongest and first observed during its nascent stage (Burgess et al. 1982). Since S08 did not provide vertical vorticity calculations from
AUGUST 2009
NOTES AND CORRESPONDENCE
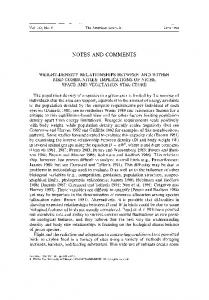
4 to 7 km AGL, it is difficult to say how long the midlevel rotation actually persisted. It is noted that Weisman and Klemp (1984) suggested that supercells last for .60 min. However, this was not part of any formal definition of a mesocyclone, and furthermore, their study focused on modeling (versus observations) of supercell thunderstorms. The mesocyclone persistence criterion of 10–20 min posited by the studies mentioned in Table 1 is based on the convective time scale (see also Rotunno and Klemp 1985, p. 271) and/or the time continuity for at least half a revolution at the radius of maximum wind. The time for half a revolution can be as little as 6 min according to Burgess (1976, p. 99), who reported four mesocyclones with lifetimes of 15–30 min. Even the time for a 6-km diameter mesocyclone to make a half revolution at a modest rotational velocity of 10 m s21 is only 15.7 min. Consequently, although supercells can be rather long lived ($4 h, Bunkers et al. 2006a), short lifetimes of 20–60 min are not unusual. Further evidence of supercell processes in the Kanto Plain storm is revealed by its motion. It is well known that supercells deviate from the mean wind in a direction transverse to the vertical wind shear (e.g., Marwitz 1972; Browning 1977; Weisman and Klemp 1984; Bunkers et al. 2000; Zeitler and Bunkers 2005). At times this can produce a ‘‘reverse S-shaped’’ storm track (Fankhauser 1971, see his Fig. 3). For the Kanto Plain storm, the observed motion from 1200 to 1230 JST nearly matched the predicted right-moving supercell motion (Fig. 1), strongly suggesting that supercell processes were active (Weisman and Klemp 1984; Rotunno and Klemp 1985; Weisman and Rotunno 2000). In fact, the radar images from 1124 to 1242 JST (S08, see their Fig. 8) suggest the motion was very steady, and similar to the predicted supercell motion in Fig. 1. It was not until around 1242 JST that the storm motion transitioned toward the eastsoutheast, closer to the mean wind and left of its previous track. Collectively, the above information suggests that the Kanto Plain storm may have been supercellular for at least an hour. Why should anyone care whether the Kanto Plain storm was a supercell or not? Taxonomy is not necessarily the answer. Rather, it is the implications of supercell processes within a storm that are crucial. Operationally, identification of a supercell means that severe weather is much more likely than if the storm is not a supercell (e.g., Burgess and Lemon 1991; Moller et al. 1994). Studies consistently have revealed that 90% or greater of supercells are severe (e.g., Burgess 1976; Burgess and Lemon 1991; Bunkers et al. 2006a). Therefore, proper early identification of the Kanto Plain storm as a supercell potentially would have been critical for early warnings of
2705
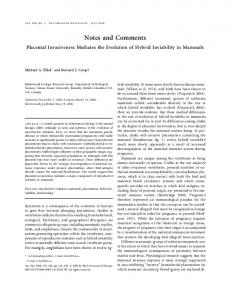
FIG. 1. Observed 0–10-km hodograph (m s21) for Tateno, Japan, valid at 0000 UTC 24 May 2000. Wind data are plotted every 500 m AGL, but markers (filled circles) are given only at 1-km intervals. Here, Vobs (filled triangle) represents the observed supercell motion and VRM-fcst (plus sign) represents the predicted right-moving supercell motion as computed in Bunkers et al. (2000). Refer to Table 2 for variables calculated from this hodograph.
severe convective weather. In support of this early identification, a change in storm motion away from the shear vector may have been a sign that rotation had commenced in the midlevels—important at large distances from the radar if corroborating velocity data are not available.
c. Supposed differences between the Kanto Plain supercell and a typical supercell S08 (p. 2399) stated that the Kanto Plain storm was different from a typical supercell as indicated in the following sentence: However, this storm had two different characteristics from those of a typical supercell storm; a single principal intense and cyclonically rotating updraft was not maintained for a long time (another new updraft was generated), and the downdraft in the rear side of the storm was weak.
Considering the first point, Weisman and Klemp (1984) stated that supercell dynamical structures do not preclude the existence of multiple cells (and hence multiple updrafts). For example, the gust front can move ahead of the updraft region (possibly wrapping around it), sometimes producing a new updraft and mesocyclone (e.g., Brooks et al. 1994; Adlerman and Droegemeier 2005). Observations of supercells with multiple-updraft
2706
MONTHLY WEATHER REVIEW
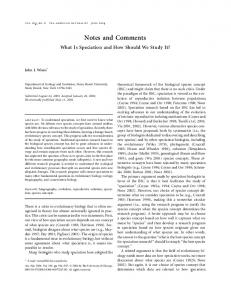
structures are actually common in the literature (e.g., Browning 1977; Foote and Frank 1983; Vasiloff et al. 1986; Nelson 1987; Doswell et al. 1990; Przybylinski et al. 1993; Glass and Truett 1993; Ho¨ller et al. 1994; Kulie and Lin 1998; Glass and Britt 2002). Thus, the fact that a new and weak updraft formed immediately downshear of the Kanto Plain supercell is congruent with supercell observations across the United States and elsewhere. The apparent weakness of the rear-flank downdraft (and hence the weak outflow) in the Kanto Plain supercell was a second reason cited by S08 as to why this was not a typical supercell. However, we do not agree that a weak downdraft, or weak inflow and outflow, would disqualify a storm from being classified as a typical supercell for a variety of reasons, as discussed next. The Kanto Plain supercell had a peak updraft speed near 12 m s21 and a peak downdraft speed near 26 m s21 (S08; calculations only available below 4–4.5 km MSL). These speeds, though somewhat weak, are by no means atypical of supercells. Many observations have been made of supercells with downdraft speeds at or near the speeds exhibited by the Kanto Plain supercell (e.g., Musil et al. 1986; Vasiloff et al. 1986; Knupp 1987; Brandes 1993; Dowell and Bluestein 1997; Cai and Wakimoto 2001). Numerical studies have shown similar results and demonstrate that the downdraft speed should be a fraction of the updraft speed (e.g., Grasso and Cotton 1995; Kulie and Lin 1998; Gilmore and Wicker 1998, hereafter GW98). Since the updraft was relatively weak, it makes sense that the downdraft speed would be low by these arguments. S08 attributed the relatively weak downdraft to evaporative cooling—based on the results of their numerical simulation. It is worth mentioning that strong shear, noted on the Tateno, Japan (TAT), hodograph (Fig. 1, discussed further in section 3 below), may have helped limit downdraft strength because of entrainment effects (Weisman and Klemp 1982; GW98). Another reason for the relative downdraft weakness may have been the level of the dry air. As seen on the TAT sounding (Fig. 2), the dry air existed above 3.5 km AGL. GW98 observed in their supercell simulations that the downdrafts were weaker given a higher placement of dry air (their simulation used a height of 3.5 km AGL). They also noted that with the dry air at a higher level, the strongest low-level outflow was delayed. This is consistent with S08, as the downdraft of the Kanto Plain supercell strengthened with time. Not only was the supposedly weak downdraft unimportant to the formation of the Kanto Plain supercell, a downdraft may not even be necessary for the formation/ maintenance of a supercell. Rotunno and Klemp (1985) numerically simulated a supercell with and without pre-
VOLUME 137
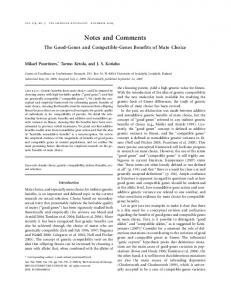
FIG. 2. Observed skew T–logp sounding (thick solid lines) for Tateno, Japan, valid at 0000 UTC (0900 JST) 24 May 2000. Half, whole, and flag wind barbs denote 2.5, 5, and 25 m s21, respectively. Temperature is given along the abscissa (8C) and pressure is plotted along the ordinate (hPa). The two thick dashed lines in the boundary layer represent modified temperature profiles for observed surface conditions and dry adiabatic lapse rates at Koga (248C, 1120 JST) and Sakura (278C, 1210 JST) just prior to passage of the Kanto Plain supercell (as given in S08). The moist adiabat for the Sakura mixed-layer parcel is also highlighted by the thick dotted line. Refer to Table 2 for variables calculated from these profiles.
cipitation processes, and found that even with the rain turned off in the model, the storm exhibited midlevel rotation and traveled to the right of the vertical wind shear vector (though the storm did lack low-level rotation). This is because midlevel rotation originates from the tilting of environmental horizontal vorticity into the vertical by the updraft (Davies-Jones 1984; Rotunno and Klemp 1985)—not by downdraft processes. Regarding storm-relative inflow and outflow velocities, S08 referenced Ray et al. (1981) in quantifying the values for a ‘‘typical supercell’’—20 m s21. One concern with this is that Ray et al. (1981) focused on strong, tornadic supercells in an environment considerably more unstable and with stronger low-level shear than that of the Kanto Plain supercell. A second concern is that this was for only one event; it was not a climatology. Thus, the values given for a strong tornadic supercell may not be representative of a nontornadic or weakly
AUGUST 2009
2707
NOTES AND CORRESPONDENCE
tornadic supercell (e.g., Kerr and Darkow 1996, see their Fig. 9), especially for one with a weaker updraft. The 0–3-km storm-relative wind (SRW0–3) for the Kanto Plain supercell (Table 2) is not all that weak (as suggested by S08) compared to values reported in Kerr and Darkow (1996) and Bunkers et al. (2006b); soundingderived SRW0–3 of 20 m s21 is considered well above average, or even extreme. In the case of the Kanto Plain supercell, and as suggested by GW98, it appears that it was not the velocity of the inflow, but rather the balance between the storm-relative inflow and outflow that was important in maintaining the Kanto Plain supercell (which was not tornadic). Eventually this balance was lost, and the outflow most likely cut off the buoyant and moist inflow. This evolution would agree with numerous numerical studies (e.g., Weisman and Klemp 1982, 1984; Brooks et al. 1994) that show the gust front (outflow) only becoming detrimental to the maintenance of updraft when it undercuts the storm-relative inflow. The preceding discussion illustrates that the perceived weakness of the downdraft did not preclude the Kanto Plain storm from being a supercell. Furthermore, the relatively weak—but not atypical—updraft and downdraft speeds are consistent with the observed stormrelative inflow and outflow, respectively.
3. Environmental reevaluation As noted in S08, the environment of the Kanto Plain storm was favorable for supercells. However, in this section several subtleties of the environment that were either misinterpreted or not highlighted in S08 are examined and discussed. The convective available potential energy (CAPE) of 1000 J kg21 reported by S08 is assumed to be surface based (SBCAPE). Note that this is lower than our value of 1124 J kg21 (refer to the ‘‘unmodified’’ column in Table 2) because of the virtual temperature correction. S08 cited Bluestein and Jain (1985) to indicate this SBCAPE was small relative to environments over the Great Plains for Oklahoma supercells. Although this is a relatively small value of SBCAPE, Bluestein and Jain calculated a mixed-layer CAPE (MLCAPE) using a parcel depth of 500 m, which mostly results in values less than that for a surface-based parcel (Craven et al. 2002). Moreover, Bluestein and Jain’s study was not representative of a climatology; only nine supercell environments were used to calculate their average MLCAPE. S08’s SBCAPE value, therefore, is not directly comparable to the results of Bluestein and Jain (1985). This discussion highlights a frequently observed problem in academic and operational meteorology whereby CAPE is computed using differing parcels, but comparisons
TABLE 2. A summary of relevant variables for the Tateno hodograph and soundings in Figs. 1 and 2, respectively. The SB prefix references the surface-based parcel and ML references a parcel with well-mixed temperature and moisture in the lowest 1000 m (similar to Craven et al. 2002); the virtual temperature correction was used for all parcel computations. RHS–7 refers to the surface to 700-hPa relative humidity; Theta-E Diff represents the difference between the surface equivalent potential temperature (ue) and the smallest midlevel ue (311.9 K at 605 hPa); PWS–3 refers to the surface to 300-hPa precipitable water; and Bulk0–6 is the shearvector magnitude from the surface to 6 km AGL. An observed storm motion of 3158 at 14 m s21 (reported in S08) was used to calculate the 0–3-km storm-relative helicity (SRH0–3) and 0–3-km storm-relative wind (SRW0–3).
SBCAPE (J kg21) SBCIN (J kg21) SBBRN SBLCL (m) MLCAPE (J kg21) MLCIN (J kg21) MLBRN MLLCL (m) RHS–7 (%) Theta-E Diff (8C) PWS–3 (cm; in.) Bulk0–6 (m s21) SRH0–3 (m2 s22) SRW0–3 (m s21)
Unmodified 0900 JST
Modified (248C) 1120 JST
Modified (278C) 1210 JST
1124 234 12 585 458 2119 5 1086 67 16.8 2.65; 1.04 26.9 111 9.8
1591 21 18 911 743 244 8 1309 63 19.8 — — — —
2177 0 24 1281 1208 210 13 1646 57 23.2 — — — —
between values are not always made on a consistent basis. The 1000-m MLCAPE for the unmodified TAT sounding (458 J kg21, Table 2) is considerably smaller than the SBCAPE, in accord with the results of Craven et al. (2002). S08 claimed the SBCAPE of 1000 J kg21 is relatively large for TAT in May, but the more realistic MLCAPE of 458 J kg21 is rather small when compared to the MLCAPE distributions associated with supercells and severe convective weather given in Rasmussen and Blanchard (1998), Thompson et al. (2003), and Craven and Brooks (2004).2 And if the TAT sounding is modified for the surface temperature 20–30 min before the Kanto Plain supercell passed by two observation sites (Fig. 2; Table 2), the MLCAPE still would be considered small-to-medium based on these U.S. climatologies.
2 Thompson et al. (2003) and Craven and Brooks (2004) used a mixed-layer depth corresponding to the lowest 100 hPa of the sounding. Although this is not the same as the lowest 1000 m used herein, to a first-order approximation, 10 m corresponds to 1 hPa in the lower troposphere. Hence, the lowest 1000 m of the atmosphere is equivalent to the lowest 100 hPa (to within 5%–10%; see also Craven et al. 2002).
2708
MONTHLY WEATHER REVIEW
Further reanalysis of the environmental data suggests the bulk Richardson number (BRN) was not on the higher end for simulated and observed supercell thunderstorms, although it was miscalculated by S08 and thus appeared to be relatively high for supercells. In fact, our calculated BRNs range from 5 to 24 for the myriad of TAT soundings and parcels used herein (Table 2); this is on the lower end of the supercell spectrum (15–45) given by Weisman and Klemp (1984).3 For a CAPE of 1000 J kg21, the BRN should be ;11 given the TAT wind profile. This was verified with three independent software programs,4 and differs markedly from the values of 46–47 reported in S08. Consequently, the environment of the Kanto Plain supercell appeared to have relatively modest CAPE given the MLBRN range of 5–13 (Table 2), which is consistent with the calculated maximum updraft speed. The 0–6-km shear vector magnitude (Bulk0–6) and the 0–3-km storm-relative helicity (SRH0–3)—other measures of supercell potential—were 26.9 m s21 and 111 m2 s22, respectively (Table 2). These are well within the range of recognized values for supercell storms (e.g., Rasmussen and Blanchard 1998; Bunkers 2002b; Thompson et al. 2003; Bunkers et al. 2006b). This SRH0–3 of 111 m2 s22 is also dissimilar from what S08 indicated (i.e., 195 m2 s22). Furthermore, even though DaviesJones et al. (1990) suggested SRH0–3 of 150 m2 s22 as a rough lower threshold value for mesocyclone formation (but not a necessary condition for the organization of a supercell), their results indicated that this was better suited as a rough lower bound for weak tornadic mesocyclones. Accordingly, Bunkers (2002b) found that SRH0–3 was ,100 m2 s22 for 81 of 479 (17%) right-moving supercell cases.
4. Supercell evolution and relative humidity S08 expended substantial effort attempting to explain how purportedly high RH was a factor in the formation and maintenance of the Kanto Plain supercell-like storm.
3 The sounding from Weisman and Klemp (1984) portrays wellmixed temperature and moisture in the lowest 1000 m. Hence, their BRN guidance is best compared to MLBRN calculations using a similar depth (i.e., 1000 m or 100 hPa). On the other hand, observed SBBRNs cannot be robustly compared to the guidance of Weisman and Klemp (1984); modeling studies with nonuniform potential temperature and/or mixing ratio in the lowest 1000 m are needed for this. 4 These programs included (i) the General Meteorological Package software [GEMPAK; desJardins et al. 1991], (ii) software developed for the Advanced Weather Interactive Processing System (AWIPS; Bunkers 2002a), and (iii) the University of Wyoming online archive (http://weather.uwyo.edu/upperair/sounding.html).
VOLUME 137
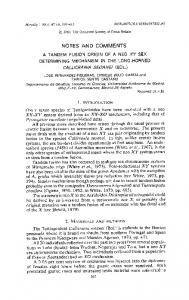
FIG. 3. Plot of RH as a function of height AGL for (solid line) the average of the seven soundings listed at the top of Table 3, (dashed–dotted line) the Cape Hatteras, NC (HAT), sounding from 1200 UTC 28 Nov 1988 [i.e., indicative of the Raleigh, NC, tornadic environment; see Kulie and Lin (1998)], and (dashed line) the unmodified TAT sounding in Fig. 2. The markers indicate the height of the melting level for each of the three RH profiles. Refer to section 4 for the corresponding discussion.
Our contention is the RH was not a factor in the formation of the Kanto Plain supercell, but rather an influence on the evolution and morphology of the supercell. S08 claimed the RH was 60%–90% below the melting level for the Kanto Plan environment. Present calculations show the same value of 90% for the upper RH bound, but they also show a slightly drier lower RH bound of 50% in the region below the melting level for the observed TAT sounding (Table 2 and Fig. 3; 50%–76% or 50%–63% for the modified soundings, not shown). The peak RH around 90% was only found in a rather shallow layer at 600 m AGL, and then the RH significantly decreased above 700 m AGL (Fig. 3). Concordantly, the lifted condensation level (LCL) heights increased with time, as did the difference in equivalent potential temperature (ue) between the surface and midlevels (Table 2). Atkins and Wakimoto (1991) found that a ue difference of $208C is a reasonable indicator for wet microbursts, albeit their environments had considerably weaker vertical wind shear (and thus less downdraft dilution; GW98) than in the present case. Together, these observations indicate that, with time, the boundary layer became more conducive for downdraft formation via evaporative cooling, and the environment for the Kanto Plain supercell was not exceptionally moist (e.g., Table 3).
AUGUST 2009
2709
NOTES AND CORRESPONDENCE
TABLE 3. A summary of variables relevant to the current study from soundings representative of the seven long-lived supercell environments with the greatest RH from the surface to 700 hPa (RHS–7) taken from Bunkers et al. (2006b). Concurrent information for Tateno, Japan (from Table 2), is also presented for ease of comparison. Units, variables, and parcel calculations are defined in Table 2, except for RH08C, which is the relative humidity at the melting level. Boldface values contrast moisture in the TAT profile with that from the seven long-lived supercell environments. Refer to section 4 for the corresponding discussion. Site, time (UTC), and date
MLCAPE
MLCIN
MLBRN
MLLCL
RHS–7
RH08C
PWS–3
Theta-E Diff
LCH, 1800 UTC 23 Dec 2002 LZK, 2000 UTC 18 Dec 2002 BMX, 0000 UTC 17 Apr 1998 SGF, 1200 UTC 18 Dec 2002 LZK, 0000 UTC 6 Mar 1999 BMX, 0000 UTC 9 Apr 1998 OKX, 0000 UTC 1 Jul 1998 Avg for above TAT, 0000 UTC 24 May 2000 TAT, modified (248C) TAT, modified (278C)
1033 861 1709 851 827 1859 1270 1201 458 743 1208
21 21 0 26 22 237 220 210 2119 244 210
10 5 14 5 10 10 17 10 5 8 13
557 672 762 625 835 683 869 715 1086 1309 1646
97 95 94 94 93 92 90 94 67 63 57
50 90 27 69 21 20 82 51 68 68 68
3.71 3.18 3.73 2.69 2.50 3.84 4.13 3.40 2.65 2.65 2.65
17.3 10.5 28.3 10.9 14.2 25.6 27.8 19.2 16.8 19.8 23.2
Nonetheless, S08 referenced GW98 to make the point that a causative factor of the Kanto Plain supercell-like storm was the midtropospheric RH. Specifically, S08 (p. 2389) stated: In recent years, the focus has been placed on midtropospheric humidity, which is an environmental factor involved in the formation of a supercell (Gilmore and Wicker 1998).
However, GW98 made no statement about supercell formation. Instead they showed results of varying amounts of environmental dry air (i.e., low values of midtropospheric RH) and the vertical placement of dry air on the morphology and evolution of supercells—including supercell longevity and low-level mesocyclone development. In fact, GW98’s simulations all had a midlevel mesocyclone associated with the updraft at 30- and 60-min snapshots, clearly indicating the storms were supercells from shortly after inception through a significant portion of their modeled lifetime. And noting the many similarities between the variety of runs, GW98 stated: ‘‘Interestingly, although there are differences in storm depth between cases, the midlevel mesocyclone extends from 3 to 7 km in all three cases. The peak midlevel vorticity is also nearly identical between cases (figure not shown) suggesting that these storms would be indistinguishable when viewed only at midlevels by radar.’’ S08 thus seem to have extrapolated beyond the results of GW98 that focus on the morphology and evolution of supercells in dry midtropospheric environments. Although RH is important in the sense of a minimal value necessary to initiate and maintain deep moist convection, the formation of a supercell depends primarily upon the buoyancy and shear proximate to a convective storm, which has been well documented (e.g., Weisman and Klemp 1982, 1984).
Recent research by McCaul et al. (2005) and Kirkpatrick et al. (2007) casts further doubt on S08’s suggestion the Kanto Plain storm was not a supercell because of the putatively moist environment. All of the simulations by McCaul et al. (2005) and Kirkpatrick et al. (2007) had free tropospheric RH (FTRH) held constant at 90%—well above the implied ‘‘moist environment’’ of the Kanto Plain storm as labeled by S08. Despite the FTRH of 90% at all levels, Kirkpatrick et al. (2007) found a mix of nonsupercellular and supercellular storms, with a proclivity toward the latter indicated by increasing levels of CAPE and deep layer shear (see their Fig. 4). Kirkpatrick et al. (2007) also stated that tests with their model (which included ice physics) confirmed GW98’s basic findings that the placement and intensity of very dry midlevel layers affected surface outflow and updraft maintenance—to the extent of weakening thunderstorm updrafts and mesocyclones with time—compared to storms simulated in higher humidity environments. The ‘‘relatively moist’’ environment below the melting level in which the Kanto Plain storm developed is insufficient evidence to suggest it could not be a supercell, especially in light of these recent modeling studies (see also Kulie and Lin 1998). Finally, S08’s statements about supercells in moist environments appear to be unfounded. For example, S08 stated in their introduction (p. 2389) that The observations of a supercell in a moist environment, such as a subtropical humid region, would afford the opportunity to expand our understanding of the formation mechanism of a supercell thunderstorm.
And on the following page: However, the number of case studies of supercells in moist environments is inadequate to clarify the environmental
2710
MONTHLY WEATHER REVIEW
factors that determine the formation mechanism of supercells in a moist environment.
These statements are puzzling. First, as shown in Trewartha and Horn (1980) and Griffiths and Driscoll (1988), the climate classification for the Kanto Plain of Japan (e.g., Tokyo) is identical—Ko¨ppen (1931) type Cfa or Thornthwaite (1933) type BB’r—to the southeastern United States (e.g., Birmingham, Alabama; Atlanta, Georgia) extending as far west as 1008W longitude, which includes nearly all of Oklahoma and the eastern half of Texas. Keeping to the traditional area of the southeastern United States east of the Mississippi River, there are studies of supercells in humid subtropical climates (e.g., Kulie and Lin 1998; Darbe and Medlin 2005), even to the extent of an entire conference session devoted to the 2008 Super Tuesday tornado outbreak across the region (more information available online at http://ams.confex.com/ams/24SLS/techprogram/session_ 22430.htm). What is more, soundings with considerably more moisture below the melting level than observed at TAT can easily be found in and near this region of the United States (e.g., Table 3 and Fig. 3). In fact, 49% of the soundings from the long-lived supercell environments in Bunkers et al. (2006b) had higher RH than the TAT sounding in the surface–700-hPa layer. In light of these arguments, the RH for the Kanto Plain supercell was fairly typical relative to the RH found in other humid subtropical supercell environments.
5. Conclusions and summary Based on the above comments regarding S08, the following conclusions are made with respect to the Kanto Plain supercell: 1) The preponderance of evidence strongly suggests the Kanto Plain storm was a supercell in light of all known definitions presented in the literature. The convective storm contained an updraft with significant vertical vorticity for a period easily greater than both (i) the convective time scale and (ii) the time needed for a half-revolution of the mesocyclone. 2) The Kanto Plain supercell’s updraft and downdraft characteristics, as well as its inflow and outflow speeds, were not atypical of other observed supercells, even though they may have fallen toward the lower end of the spectrum. 3) The environment of the Kanto Plain supercell had moderate-to-strong shear for supercell formation, although the CAPE was relatively modest. A reanalysis suggested the MLBRN and SRH0–3 were not as large as reported in S08, and neither the MLCAPE nor SBCAPE were large based on the CAPE spectrum for supercells.
VOLUME 137
4) The environment of the Kanto Plain supercell was not exceptionally moist, and in fact the RH profile became drier with time. Moisture profiles similar to that for the Kanto Plain supercell, if not more moist, have been observed and simulated for supercell environments in the United States, especially across the Gulf of Mexico and Atlantic coastal areas. S08’s study represents the first to conduct a dualDoppler analysis of a supercell in Japan. S08 were further able to numerically simulate many of the observed characteristics of the Kanto Plain supercell. Given the rarity of supercells in Japan, this represents an important step in expanding our knowledge of supercell occurrence in this region. The supposition that RH is a factor involved in the formation of a supercell is perhaps the most significant drawback of S08’s study. Accordingly, the conceptual model put forth by S08 is questionable, especially since it is based on just a single case and it is not clear if it provides additional information to a warning forecaster—beyond what is already known about supercell processes. Forecasters have been aware of the balancing act between storm-relative inflow and outflow with respect to supercell evolution for some time [e.g., at least since Brooks et al. (1994)], and in recent years this has become one key part of tornado forecasting via LCL heights and boundary layer humidity (e.g., Thompson et al. 2003; Craven and Brooks 2004). This conceptual model for tornado forecasting has been built on many cases. Keeping in mind that there is a continuum of storms (e.g., Moller et al. 1994; Doswell 1996), it should be apparent that there is nothing fundamentally different among mesocyclones with varying lifetimes. This notion of a spectrum of storms is manifest in the variety of definitions that has been applied to supercells over the years. Nevertheless, supercell development has certain implications that should trigger a familiar conceptual model regarding severe weather potential, storm steadiness, and deviant motion. This means that having a baseline definition of a supercell is useful, and not simply a matter of storm classification. Acknowledgments. The comments and suggestions provided by Jim LaDue and Paul Smith are greatly appreciated, as are the exchanges with Andy Detwiler, Chuck Doswell, Roger Edwards, and Jonathan Garner. We also thank Dave Carpenter (Meteorologistin-Charge, WFO Rapid City, South Dakota) for supporting this work. The second author conducted this work while participating in a student volunteer program between the South Dakota School of Mines and Technology and the National Weather Service at
AUGUST 2009
NOTES AND CORRESPONDENCE
Rapid City. The views expressed are those of the authors and do not necessarily represent those of the National Weather Service. REFERENCES Adlerman, E. J., and K. K. Droegemeier, 2005: The dependence of numerically simulated cyclic mesocyclogenesis upon environmental vertical wind shear. Mon. Wea. Rev., 133, 3595– 3623. Atkins, N. T., and R. M. Wakimoto, 1991: Wet microburst activity over the southeastern United States: Implications for forecasting. Wea. Forecasting, 6, 470–482. Bluestein, H. B., and M. H. Jain, 1985: Formation of mesoscale lines of precipitation: Severe squall lines in Oklahoma during the spring. J. Atmos. Sci., 42, 1711–1732. Brandes, E. A., 1993: Tornadic thunderstorm characteristics determined with Doppler radar. The Tornado: Its Structure, Dynamics, Prediction, and Hazards, Geophys. Monogr., Vol. 79, Amer. Geophys. Union, 143–159. Brooks, H. E., C. A. Doswell III, and R. B. Wilhelmson, 1994: The role of midtropospheric winds in the evolution and maintenance of low-level mesocyclones. Mon. Wea. Rev., 122, 126–136. Browning, K. A., 1964: Airflow and precipitation trajectories within severe local storms which travel to the right of the winds. J. Atmos. Sci., 21, 634–639. ——, 1977: The structure and mechanisms of hailstorms. Hail: A Review of Hail Science and Hail Suppression, Meteor. Monogr., No. 38, Amer. Meteor. Soc., 1–43. Bunkers, M. J., 2002a: A new convective sounding analysis program for AWIPS. Preprints, 18th Int. Conf. on Interactive Information and Processing Systems (IIPS), Orlando, FL, Amer. Meteor. Soc., 209–210. ——, 2002b: Vertical wind shear associated with left-moving supercells. Wea. Forecasting, 17, 845–855. ——, B. A. Klimowski, J. W. Zeitler, R. L. Thompson, and M. L. Weisman, 2000: Predicting supercell motion using a new hodograph technique. Wea. Forecasting, 15, 61–79. ——, M. R. Hjelmfelt, and P. L. Smith, 2006a: An observational examination of long-lived supercells. Part I: Characteristics, evolution, and demise. Wea. Forecasting, 21, 673–688. ——, J. S. Johnson, L. J. Czepyha, J. M. Grzywacz, B. A. Klimowski, and M. R. Hjelmfelt, 2006b: An observational examination of long-lived supercells. Part II: Environmental conditions and forecasting. Wea. Forecasting, 21, 689–714. Burgess, D. W., 1976: Single Doppler radar vortex recognition: Part I—Mesocyclone signatures. Preprints, 17th Conf. on Radar Meteorology, Seattle, WA, Amer. Meteor. Soc., 97–103. ——, and L. R. Lemon, 1990: Severe thunderstorm detection by radar. Radar in Meteorology, D. Atlas, Ed., Amer. Meteor. Soc., 619–647. ——, and ——, 1991: Characteristics of mesocyclones detected during a NEXRAD test. Preprints, 25th Int. Conf. on Radar Meteorology, Paris, France, Amer. Meteor. Soc., 39–42. ——, V. T. Wood, and R. A. Brown, 1982: Mesocyclone evolution statistics. Preprints, 12th Conf. on Severe Local Storms, San Antonio, TX, Amer. Meteor. Soc., 422–424. Cai, H., and R. M. Wakimoto, 2001: Retrieved pressure field and its influence on the propagation of a supercell thunderstorm. Mon. Wea. Rev., 129, 2695–2713. Craven, J. P., and H. E. Brooks, 2004: Baseline climatology of sounding derived parameters associated with deep moist convection. Natl. Wea. Dig., 28, 13–24.
2711
——, R. E. Jewell, and H. E. Brooks, 2002: Comparison between observed convective cloud-base heights and lifting condensation level for two different lifted parcels. Wea. Forecasting, 17, 885–890. Darbe, D., and J. Medlin, 2005: Multi-scale analysis of the 13 October 2001 central Gulf Coast shallow supercell tornado outbreak. Electron. J. Operational Meteor., 6, 1–7. [Available online at http://www.nwas.org/ej/pdf/2005-EJ1.pdf.] Davies-Jones, R., 1984: Streamwise vorticity: The origin of updraft rotation in supercell storms. J. Atmos. Sci., 41, 2991–3006. ——, D. Burgess, and M. Foster, 1990: Test of helicity as a tornado forecast parameter. Preprints, 16th Conf. on Severe Local Storms, Kananaskis Park, AB, Canada, Amer. Meteor. Soc., 588–592. desJardins, M. L., K. F. Brill, and S. S. Schotz, 1991: GEMPAK5 user’s guide. NASA Tech. Memo. 4260, 232 pp. [Available from NASA Code NTT-4, Washington, DC 20546-0001.] Donaldson, R. J., Jr., 1970: Vortex signature recognition by a Doppler radar. J. Appl. Meteor., 9, 661–670. Doswell, C. A., 1996: What is a supercell? Preprints, 18th Conf. on Severe Local Storms, San Francisco, CA, Amer. Meteor. Soc., 641. ——, and D. W. Burgess, 1993: Tornadoes and tornadic storms: A review of conceptual models. The Tornado: Its Structure, Dynamics, Prediction, and Hazards, Geophys. Monogr., Vol. 79, Amer. Geophys. Union, 161–172. ——, A. R. Moller, and R. Przybylinski, 1990: A unified set of conceptual models for variations on the supercell theme. Preprints, 16th Conf. on Severe Local Storms, Kananaskis Park, AB, Canada, Amer. Meteor. Soc., 40–45. Dowell, D. C., and H. B. Bluestein, 1997: The Arcadia, Oklahoma, storm of 17 May 1987: Analysis of a supercell during tornadogenesis. Mon. Wea. Rev., 125, 2562–2582. Fankhauser, J. C., 1971: Thunderstorm–environment interactions determined from aircraft and radar observations. Mon. Wea. Rev., 99, 171–192. Foote, G. B., and H. W. Frank, 1983: Case study of a hailstorm in Colorado. Part III: Airflow from triple-Doppler measurements. J. Atmos. Sci., 40, 686–707. Gilmore, M. S., and L. J. Wicker, 1998: The influence of midtropospheric dryness on supercell morphology and evolution. Mon. Wea. Rev., 126, 943–958. Glass, F. H., and S. C. Truett, 1993: Observations of a splitting severe thunderstorm exhibiting both supercellular and multicellular traits. Preprints, 17th Conf. on Severe Local Storms, St. Louis, MO, Amer. Meteor. Soc., 224–228. ——, and M. F. Britt, 2002: The historic Missouri–Illinois high precipitation supercell of 10 April 2001. Preprints, 21st Conf. on Severe Local Storms, San Antonio, TX, Amer. Meteor. Soc., 99–104. Grasso, L. D., and W. R. Cotton, 1995: Numerical simulation of a tornado vortex. J. Atmos. Sci., 52, 1192–1203. Griffiths, J. F., and D. M. Driscoll, 1988: Survey of Climatology. Charles Merrill Publishing, 358 pp. Ho¨ller, H., V. N. Bringi, J. Hubbert, M. Hagen, and P. F. Meischner, 1994: Life cycle and precipitation formation in a hybrid-type hailstorm revealed by polarimetric and Doppler radar measurements. J. Atmos. Sci., 51, 2500–2522. Kerr, B. W., and G. L. Darkow, 1996: Storm-relative winds and helicity in the tornadic thunderstorm environment. Wea. Forecasting, 11, 489–505. Kirkpatrick, J. C., E. W. McCaul Jr., and C. Cohen, 2007: The motion of simulated convective storms as a function of basic
2712
MONTHLY WEATHER REVIEW
environmental parameters. Mon. Wea. Rev., 135, 3033– 3051. Knupp, K. R., 1987: Downdrafts within High Plains cumulonimbi. Part I: General kinematic structures. J. Atmos. Sci., 44, 987– 1008. Ko¨ppen, W., 1931: Grundriss der Klimakunde (Compendium of Climatology). Walter de Gruyter, 388 pp. Kulie, M. S., and Y.-L. Lin, 1998: The structure and evolution of a numerically simulated high-precipitation supercell thunderstorm. Mon. Wea. Rev., 126, 2090–2116. Lemon, L. R., and C. A. Doswell III, 1979: Severe thunderstorm evolution and mesocyclone structure as related to tornadogenesis. Mon. Wea. Rev., 107, 1184–1197. Marwitz, J. D., 1972: The structure and motion of severe hailstorms. Part I: Supercell storms. J. Appl. Meteor., 11, 166–179. McCaul, E. W., Jr., C. Cohen, and C. Kirkpatrick, 2005: The sensitivity of simulated storm structure, intensity, and precipitation efficiency to environmental temperature. Mon. Wea. Rev., 133, 3015–3037. Moller, A. R., C. A. Doswell III, M. P. Foster, and G. R. Woodall, 1994: The operational recognition of supercell thunderstorm environments and storm structures. Wea. Forecasting, 9, 327–347. Musil, D. J., A. J. Heymsfield, and P. L. Smith, 1986: Microphysical characteristics of a well-developed weak echo region in a high plains supercell thunderstorm. J. Climate Appl. Meteor., 25, 1037–1051. Nelson, S. P., 1987: The hybrid multicellular–supercellular storm— An efficient hail producer. Part II: General characteristics and implications for hail growth. J. Atmos. Sci., 44, 2060–2073. Przybylinski, R. W., J. T. Snow, E. M. Agee, and J. T. Curran, 1993: The use of volumetric radar data to identify supercells: A case study of June 2, 1990. The Tornado: Its Structure, Dynamics, Prediction, and Hazards, Geophys. Monogr., Vol. 79, Amer. Geophys. Union, 241–250. Rasmussen, E. N., and D. O. Blanchard, 1998: A baseline climatology of sounding-derived supercell and tornado forecast parameters. Wea. Forecasting, 13, 1148–1164.
VOLUME 137
Ray, P. S., B. C. Johnson, K. W. Johnson, J. S. Bradberry, J. J. Stephens, K. K. Wagner, R. B. Wilhelmson, and J. B. Klemp, 1981: The morphology of several tornadic storms on 20 May 1977. J. Atmos. Sci., 38, 1643–1663. Rotunno, R., and J. Klemp, 1985: On the rotation and propagation of simulated supercell thunderstorms. J. Atmos. Sci., 42, 271–292. Shimizu, S., H. Uyeda, Q. Moteki, T. Maesaka, Y. Takaya, K. Akaeda, T. Kato, and M. Yoshizaka, 2008: Structure and formation mechanism on the 24 May 2000 supercell-like storm developing in a moist environment over the Kanto Plain, Japan. Mon. Wea. Rev., 136, 2389–2407. Stumpf, G. J., A. Witt, E. D. Mitchell, P. L. Spencer, J. T. Johnson, M. D. Eilts, K. W. Thomas, and D. W. Burgess, 1998: The National Severe Storms Laboratory mesocyclone detection algorithm for the WSR-88D. Wea. Forecasting, 13, 304–326. Thompson, R. L., R. Edwards, J. A. Hart, K. L. Elmore, and P. Markowski, 2003: Close proximity soundings within supercell environments obtained from the Rapid Update Cycle. Wea. Forecasting, 18, 1243–1261. Thornthwaite, C. W., 1933: The climates of the Earth. Geogr. Rev., 23, 433–440. Trewartha, G. T., and L. H. Horn, 1980: An Introduction to Climate. McGraw-Hill, 416 pp. Vasiloff, S. V., E. A. Brandes, R. P. Davies-Jones, and P. S. Ray, 1986: An investigation of the transition from multicell to supercell storms. J. Climate Appl. Meteor., 25, 1022–1036. Weisman, M. L., and J. B. Klemp, 1982: The dependence of numerically simulated convective storms on vertical wind shear and buoyancy. Mon. Wea. Rev., 110, 504–520. ——, and ——, 1984: The structure and classification of numerically simulated convective storms in directionally varying wind shears. Mon. Wea. Rev., 112, 2479–2498. ——, and R. Rotunno, 2000: The use of vertical wind shear versus helicity in interpreting supercell dynamics. J. Atmos. Sci., 57, 1452–1472. Zeitler, J. W., and M. J. Bunkers, 2005: Operational forecasting of supercell motion: Review and case studies using multiple datasets. Natl. Wea. Dig., 29, 81–97.