This article has been accepted for publication in a future issue of this journal, but has not been fully edited. Content may change prior to final publication. Citation information: DOI 10.1109/ACCESS.2018.2841321, IEEE Access
Date of publication xxxx 00, 0000, date of current version xxxx 00, 0000. Digital Object Identifier 10.1109/ACCESS.2017.Doi Number
Comparing Community Detection Algorithms in Transport Networks via Points of Interest Liping Huang1, Yongjian Yang2*, Hepeng Gao3, Xuehua Zhao4, Zhanwei Du5* 1,2,5
College of Computer Science and Technology, Jilin University, Changchun 130012, China. College of Software, Jilin University, Changchun 130012, China. 4 School of Digital Media, Shenzhen Institute of Information Technology, Shenzhen 518172, China. 3
Corresponding author: Yongjian Yang, Zhanwei Du (e-mail:
[email protected];
[email protected]).
ABSTRACT Passengers travel in transport networks with diverse interests represented by linked points of interest (POIs) and drive urban regions to group into network communities. Previous studies focused on applying community detection methods (CDM) to discover spatial mobility patterns or using POIs to explain the decision making of human mobility, without comparing the effectiveness of CDMs for detecting network communities. In this paper, we analyze the relationship between POIs and network communities of human mobility over diverse CDMs. Taking the taxi systems of Shanghai and Beijing as case studies, we construct transport networks with urban regions as nodes and the connections between them as links weighted by mobility flows. The spatial communities are identified based on the movement strength among regions. POIs are mapped into nodes in the network and are considered as independent variables for classifying the spatial community categories. Our study suggests that communities detected with two specific CMDs (namely, the Combo algorithm and the Walktrap algorithm) correlate to POIs, and the correlation of the Combo is the best (R2=0.3 for Shanghai, and R2=0.48 for Beijing). In this regard, this study can provide valuable insight into understanding the formation of spatial communities and assist in selecting reasonable CDMs. INDEX TERMS Community Detection, Logistic Regression, Mobility Flow, Points of Interest.
I. INTRODUCTION
People move around in a city, generating population mobility flows in urban transport networks. Knowledge of the spatial pattern of citizens’ travel in a city is particularly beneficial for the convergence of applications, such as selecting locations for retail stores to allow more customers to shop around, and advertisement casting to capture as many consumers as possible [1, 2]. To analyze the spatial variability of urban mobility flows, we construct a transport network with partitioned urban regions as nodes and the connections between them as links weighted by the aggregated strengths of interregion movements [1, 3, 4]. The community in the transport network is applied for further analysis of the spatial variability of mobility flows as it offers a visual representation of the spatial cluster features of mobility flows, where a spatial community is a set of nodes with more connections among themselves than with the remaining nodes [5]. Traditional CDMs based on Newman’s modularity optimization, combined with the representative CDMs of LPA [6], walktrap [7] and a highquality CDM called combo [8], are applied to detect spatial
communities of mobility flows. A brief description of each CDM used in this research is provided in the third section. Actually, each trip between urban regions connects specific POIs. For example, commuting trips connect a citizen’s home and workplace. This means urban mobility flows are rooted in people’s traveling activities (e.g., work or entertainment) [9, 10], reflected by specific POIs. Therefore, researching the inherent consistency between spatial mobility communities and POIs provides new insight for understanding the underlining mechanism of urban movements. The main contribution of this study consists of three points: (1) We construct transport networks with segmented regions of the studied area as nodes and connections between regions as links weighted by the volume of mobility flows. Then, CDMs are applied to identify the spatial community pattern of mobility flows. (2) Further, POIs are mapped into nodes to characterize the driving factors for generating spatial communities. We consider this a multi-class classification problem with the community categories as classification
2169-3536 (c) 2018 IEEE. Translations and content mining are permitted for academic research only. Personal use is also permitted, but republication/redistribution requires IEEE permission. See http://www.ieee.org/publications_standards/publications/rights/index.html for more information.
This article has been accepted for publication in a future issue of this journal, but has not been fully edited. Content may change prior to final publication. Citation information: DOI 10.1109/ACCESS.2018.2841321, IEEE Access
labels and the POIs in a node as feature vectors, which is solved by adopting a stepwise logistic regression. (3) We evaluate the consistency between spatial communities and POIs using large-scale and real-world datasets, containing POI datasets and taxi GPS trajectory datasets of Beijing and Shanghai, China. Experiment results show that combo is the best CDM suite for acquiring POI motivated spatial communities of the transport networks. According to the research problems of our work presented above, the rest of this paper is organized as follows: Section 2 presents related works. Methods used in this paper are shown in Section 3, including the construction of transport networks, the description of representative CDMs, and our proposed consistency estimation model. Experimental datasets and result analysis are reported in Section 4. Finally, the paper is concluded in Section 5. II. RELATED WORKS
Technological advances allow for precise measurement of mobility flows in large datasets, including taxi trajectories [11-13], mobile phone trajectories [4, 14], and transport smart cards [9]. Retrospective studies of mobility flow focus on modeling mobility flow from one place to another, such as the universal model, called radiation model [15], which is proposed and applied to predict human mobility volume [16]. Although the model is parameter-free and only requires population distribution as input, the spatial cluster features of mobility flows are disregarded, meaning most people travel in a specific range of regions instead of the entire city and some citizens share a similar regional scope. Combined with network techniques, applications based on mobility flow are widely developed in the field of urban computing [17, 18]. For example, the centrality metrics of a network are used to estimate the importance of road segments [11]. To determine the interaction between regions, the studied area is segmented into disjointed regions, and mobility flow between geographical regions is used to discover the connectivity between regions and reveal new latent links, thus determining the inadequacy of the existing road network [19]. Using taxi trajectory data from Shanghai, Liu et al. [13] built spatial networks to model intra-city spatial interactions, revealing the hierarchical and polycentric structure of Shanghai. Studies mentioned above provide insights into using emerging data sources to reveal mobility patterns and the urban structure. However, the underlying mechanisms that generate spatial patterns and urban structures from the landuse aspects have not been researched. Complementary, mobility flows in subway systems are combined with POIs to research activity patterns and model the dynamic decision-making process that shape individuals’ movements [9]. This research constructs a transport network with subway stations as nodes and mobility flow from one station to another as weights on the directed edge. When it VOLUME XX, 2017
comes to researching the overall urban movements, the city area is always segmented into regions. Segmented regions of the city carry socio-economic functions because people live in the regions and POIs exist in regions, and regions as the origin and destination of a trip cause mobility flows [20]. The studies above indicate mobility flows are related to POIs distributed among urban regions. However, there is no research specializing in the consistency between spatial communities and driving factors for urban mobility flows. Existed CDMs are usually adopted to mine the spatial mobility pattern, but determining the appropriate CDM has not been researched. Both problems are researched in this paper. Our work is different from the research mentioned in the following aspects. First, we add the POI feature to nodes in the spatial networks to characterize the socio-economic factors that motivate mobility flows. Moreover, based on the multiclass classification method of stepwise logistic regression, we estimate the consistency between spatial communities and POIs, further to determine the appropriate CDMs suitable for detecting spatial communities in keeping with the distribution of POIs. III. METHODS
To estimate the consistency between spatial communities of mobility flows and POIs, we construct a transport network for the study area and detect the spatial communities. Then, POIs are mapped into corresponding nodes in the network to characterize the driving factors of urban movements. Spatial communities are used to classify the nodes in the network. We adopt multi-class classification methods to classify the nodes using the community as the classification label and the POI feature of each node as the independent variable. First, we depict the construction of the transport network, and present the CDMs used to identify spatial communities. Then, we depict the consistency estimation model, consisting of the map matching and classification methods of stepwise logistic regression. A. NETWORKS and CDMs
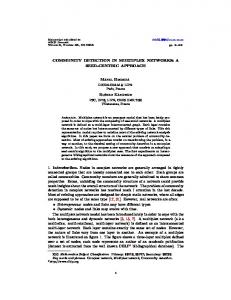
Mobility used in this paper is represented as a 2tuple ( xo , yo ), ( xd , yd ) . Both ( xo , yo ) and ( xd , yd ) are geo-spatial positions, denoting the origin and destination of a trip, respectively. In detail, the OD (origin and destination) pair represents a trip starting at ( xo , yo ) and arriving at ( xd , yd ) . To construct the network in this research, the study area is segmented into disjoint grids, and each grid gi is set as a node ni, as illustrated in Fig. 1. Trips between two nodes indicate the existence of an edge or linkage. After extracting mobility flows from the travel trajectory datasets, the volume of mobility flows originating from gi and ending at gj is set as the weight wij from ni to nj. Thus, the network is constructed. 9
2169-3536 (c) 2018 IEEE. Translations and content mining are permitted for academic research only. Personal use is also permitted, but republication/redistribution requires IEEE permission. See http://www.ieee.org/publications_standards/publications/rights/index.html for more information.
This article has been accepted for publication in a future issue of this journal, but has not been fully edited. Content may change prior to final publication. Citation information: DOI 10.1109/ACCESS.2018.2841321, IEEE Access
2 1
3
2
1 4
(a)
(b)
(c)
(d)
(e)
FIGURE 1. To construct a network based on mobility flows, the study area is divided into small regions (a) each small region corresponds to a node in the network. A directed edge or linkage exists between two nodes if there are mobility flows between nodes. The weight of an edge equals the volume of mobility flows represented in (b, c). Graphic (d) provides an illustration of the communities detected from a network, which is divided into four parts (depicted by four circles) in which the sub-networks have relatively dense connections. The community detection result corresponds to closely connected sub-regions (e)
As shown in Fig. 1, some nodes have much stronger connections among them than with others. By dividing the network into densely connected sub-networks, the city area is divided into intensely interactive sub-regions. In network science, community detection methods can partition an entire network into tightly connected sub-networks, called communities, and reveal the network clustering characteristics. A community, also called a cluster or a module, is normally considered a group of nodes which probably share common properties or have similar roles within the network. Considering the adaption to large-scale transport networks, six representative algorithms of community detection that are adapt for directed-weighted networks are utilized to acquire the spatial community pattern in our constructed networks. The metric of modularity is commonly adopted to measure the performance of network community detection. When applied to weighted and directed networks, the modularity, denoted as Q, is defined as [21] m w win wout ij (1) Q i i w i 1 w Here, wij is the total weight of links starting and ending in community i, wiin and wiout are the total in- and outweight of links in module i, and w is the total weight of all the links in the network. To optimize Q, the vast majority of search strategies use one of the following steps to evolve starting partitions: merging two communities, splitting a community into two, moving nodes between distinct communities. The fast greedy [22] algorithm only considers the merging strategy, beginning with each node as the sole member of a community. It only updates the j-th row and
VOLUME XX, 2017
column and removes the i-th row and column altogether. The updating process is Q jk Qik Q jk , if k is connected to i and j Q jk Qik 2a j ak , if k is connected to i not j (2) Q Q 2a a , if k is connected to j not i jk ik i k
where ai=ki/2m, ki is the degree of node i, and m is the weight on the edge. Fast unfolding [23] adopts both strategies of moving nodes and merging communities. The modularity updating process is Q ( (
where
tot
in , C
in , C
w ki ,in
2m in,C w 2m
(
tot w
tot
w ki
2m
)2 )
(3)
k ( ) ( i )2 ) 2m 2m 2
w is the sum weight of the links inside C,
w is the sum weight of the links incident to nodes in C,
ki is the sum weight of the links incident to node i, ki,in is the sum weight of the links from i to nodes in C, and m is the sum weight of all links in the network. Combo [8] involves all three possibilities of optimizing modularity, which is justified as an upper bound to the execution time of O( N 2 log(C )) , where N is the number of nodes, and C is the number of communities in the network. Label propagation algorithm [6], or LPA, is based solely on network structure and does not require optimization of a predefined objective function or prior information about the communities. LPA updates the label of each node according to the labels of its neighbors. Finally, each node is located in the community to which the 9
2169-3536 (c) 2018 IEEE. Translations and content mining are permitted for academic research only. Personal use is also permitted, but republication/redistribution requires IEEE permission. See http://www.ieee.org/publications_standards/publications/rights/index.html for more information.
This article has been accepted for publication in a future issue of this journal, but has not been fully edited. Content may change prior to final publication. Citation information: DOI 10.1109/ACCESS.2018.2841321, IEEE Access
most neighbors belong. The main idea behind the label propagation algorithm is the following: Suppose that a node x has neighbor nodes x1, x2, …, xk and that each neighbor node has a label denoting the community to which it belongs. Then, each node in the network chooses to join the community to which the maximum number of neighboring nodes belong, and every node is initialized with unique labels and the labels propagate through the network. As the labels propagate, at every step, each node updates its label based on the labels of the neighboring nodes. The asynchronous updating is:
locations visited by a random walker. The objective function is L( M ) q H (Q) k p i H ( p i ) (6) i k q i qi p i qi C p i where q is the probability of travelling from community i to another community. p denotes the probability of visiting nodes in community Ci. H(Q) and H(Pi) denote the entropy of the community code book and the entropy of nodes in the i-th community.
Cx (t ) f (C xi1 (t ),..., C xim (t ), C xi ( m1) (t 1),...C xii (t 1)) (4) where xi ( m 1) ,..., xik are neighbor nodes that have not been updated in the current iteration. Considering a discrete random walk process on the network, the walktrap algorithm [7] adopts the flow distance to merge communities. The distance between two communities is defined as the distance difference from two communities to all other nodes: rC1C2
k 1 ( PCt1k PCt 2k )2 / d (k ) n
B. CONSISTENCY ESTIMATION
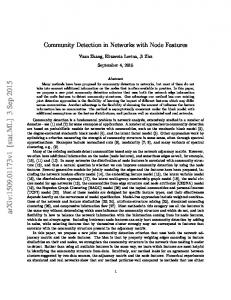
To explain the formation of the spatial communities, the ultimate proof of the hidden reason is to match the spatial communities to POIs distributed among the regions. As shown in Fig. 2, POIs in the studied area are matched with nodes, in accordance to the geolocation using the map matching process. Region ri is located using the longitude and latitude range (bottom, top)-(left, right). The origin and destination of a movement, as well as a specific POI position, are located using the longitude and latitude. The map matching process determines which region the point is located. After mapping the origins and destinations with partitioned regions, the weights on each directed edge in the constructed network are calculated.
(5)
pijt
where denotes the distance from i to j of t steps. Based on the flow distance definition, the problem of finding communities is a clustering problem, which can be solved using an efficient hierarchical clustering algorithm. Another random walk based algorithm is infomap [24]. It allocates a binary signature to each node and the Huffman code is adopted to enumerate a succession of Regions
OD
POI
{ri}
x(m)
Map Matching
Spatial Networks Edge e, Weight w
Node n n: partitioned region (xo,yo) locates in n i , (x d ,y d ) locates in nj, x(m)locates in a node
e: connection between nodes; w:number of OD pairs originating from ni to nj
Community Detection for spatial network (N,E,W), get community set Ck={n1,n2,...}
Logistic Regression with Stepwise for each xi=( x(1),x(2),…,x(m)) in Ck
FIGURE 2. The proposed consistency estimation model first sets the partitioned regions as nodes in the network and the connection between nodes as edges weighted by the number of OD pairs. POIs are matched with nodes in the network. Then, a CDM is implemented on the network to obtain the spatial communities. By applying the multi-class classification method of stepwise logistic regression, the POI features are set as independent variables and the spatial community categories are set as classification labels. Regression fitness is adopted to estimate the consistency between spatial communities and POI feature, thus determining the most effective CDM that generates POI driven communities. VOLUME XX, 2017
9
2169-3536 (c) 2018 IEEE. Translations and content mining are permitted for academic research only. Personal use is also permitted, but republication/redistribution requires IEEE permission. See http://www.ieee.org/publications_standards/publications/rights/index.html for more information.
This article has been accepted for publication in a future issue of this journal, but has not been fully edited. Content may change prior to final publication. Citation information: DOI 10.1109/ACCESS.2018.2841321, IEEE Access
By mapping each POI to the corresponding region, the POI features of each node in the spatial network are obtained. POI features are denoted as xi=(x(1), x(2),…, x(M)), where M is the POI category number, and x(j) is the number of the j-th POI category in node i. After applying a CDM to the constructed network, the nodes are partitioned into disjoint sets (communities). Nodes in the same community have the same classification label value Y. Each node in the network is characterized by the POI feature vector. Then, the multi-class classification problem is solved using the stepwise logistic regression method, where the community label Y is set as the dependent variable, and the POI feature is set as the independent variable. Suppose that the value set of Y is {1, 2,…, K}, then, the multinomial logistic regression is defined as P (Y k | x)
K 1
1 exp( wk x b)
, k 1, 2,..., K 1 (7)
k 1
1
(8)
K 1
1 exp( wk x) k 1
where w w1 , w2 ,..., wM and b are model parameters. Given the testing set D={(x1,y1),(x2,y2),…,(xN,yN)}, let Dk denote the samples labeled with k, and ( w, b) . Then, the multi-class classification method of the stepwise logistic regression is adopted and the MLE (maximum likelihood estimation) is applied to calculate the parameters:
l ( k ) log P( Dk | k )
(x.o,y.o)
(x.d,y.d)
f:0->1
(x.o,y.o)
trip1
unoccupied
(x.d,y.d)
f:0->1
f:1->0
f:1->0 trip2
occupied
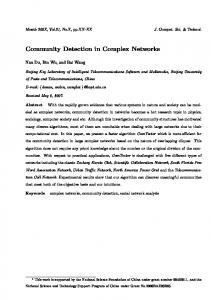
FIGURE 3. Mobility extraction from taxi trajectories with occupation state
exp( wk x b)
P (Y K | x)
points pertaining to the sampling location of the taxi over time. Each point consists of a tuple ( x, y ), f with location ( x, y ) , and the taxi’s occupancy status f, where (x,y) is a pair of spatial coordinates representing latitude and longitude. f=1 means the taxi has passengers, otherwise f=0. The flag f bound to each trajectory position is essential for determining the taxi occupation state, which is utilized to extract the origin and destination of a trip. All other GPS points between a pair of (xo, yo) and (xd, yd) have the same occupation state, f=1.
log P( x |
xDk
k
)
ˆk arg max l ( k )
(9)
variation.
The extracted mobility flows consist of 186,2799 OD pairs for Beijing and 38,0640 OD pairs for Shanghai. The mobility volume between any pair of nodes is acquired by matching origins and destinations to grids using the OSM. Disregarding grids with no OD pairs, 2926 grids remain for Shanghai and 3995 grids remain for Beijing. These grids are set as nodes in the transport networks, the mobility flow volume originating from grid i to grid j is set as the weight on the directed edge. The seventeen dimensions of POI features are set as the independent variables X for the logistic regression, and each dimension is set as a component X(i) of the independent variable. The spatial communities are set as classification labels during the multi-class classification process with the stepwise logistic regression. The dataset description of POIs is shown in Tab. 1.
(10)
k
IV.
EXPERIMENT
A.
DATASETS
Taking the spatial networks of Beijing and Shanghai as case studies, datasets of taxi GPS trajectories in both cities are collected. The Baidu APIs1 is used to acquire the datasets of POIs in two metropolises, both containing seventeen categories of POIs. The studied area of Beijing is of longitude and latitude (116.0, 116.8)-(39.65, 40.25), and Shanghai is of longitude and latitude (120.4507, 122.1024)(30.0022-31.9270). We partition the studied areas into squared grids 1 km in size, using the open street map (OSM)2. As shown in Fig. 3, taxi trajectories are used to extract mobility flows. A taxi trajectory is a sequence of GPS
1.
http://lbsyun.baidu.com/index.php?title=jspopular.
2
http://www.openstreetmap.org/copyright
VOLUME XX, 2017
9
2169-3536 (c) 2018 IEEE. Translations and content mining are permitted for academic research only. Personal use is also permitted, but republication/redistribution requires IEEE permission. See http://www.ieee.org/publications_standards/publications/rights/index.html for more information.
This article has been accepted for publication in a future issue of this journal, but has not been fully edited. Content may change prior to final publication. Citation information: DOI 10.1109/ACCESS.2018.2841321, IEEE Access
B.
No.
POI Category
1
Beauty
TABEL 1 POI CATEGORIES Variable Beijing X(1) X
(2)
Shanghai
55,696
51,689
2
Traffic Facility
96,356
123,124
3
Entertain
X(3)
140,445
183,402
4
Enterprise
X(4)
128,188
178,562
5
Hospital
X(5)
12,924
9,680
(6)
6
Real Estate
X
300,214
233,777
7
Government
X(7)
25,556
20,660
8
Education
X(8)
40,381
39,343
9
Culture
X(9)
3,971
3,723
10
Scenic Spot
X(10)
56,996
48,463
11
Auto Service
X(11)
50,898
55,479
12
Living Service
X(12)
158,121
149,576
13
Food
X(13)
86,301
82,021
14
Shopping
X(14)
208,245
230,715
15
Spots
X(15)
11,026
9,561
16
Hotel
X(16)
8,501
3,704
17
Finance
X(17)
22,139
23,386
RESULTS and ANALYSIS
The community snapshot is affected by the travel distance. Thus, a distance threshold (DT) is added to the community detecting process. As shown in Fig. 4, for the spatial network of Shanghai, the edge number and mobility
flow reach 90% as the distance threshold gradually increases to 20 km and 14 km, respectively. This is similar for the spatial network of Beijing, where the critical distances are 25 km and 9 km.
FIGURE 4. Variation of edge number (a) and flow(b) with distance threshold changing in the Shanghai and Beijing networks.
The modularity of community detection results for the two cities is shown in Fig. 5 and Fig. 6, along with the regression fitness degree metric R2. The modularity decreases as the distance threshold increases (except for the walktrap and LPA, which will be explained later based on the visualization of the detected communities). Larger
VOLUME XX, 2017
distance thresholds mean more edges and more mobility flows are added to the spatial networks, resulting in a smaller modularity value. When the mobility flow proportion is approximately 1, the modularity tends to be convergent as a low number of edges and flows are added to the network.
9
2169-3536 (c) 2018 IEEE. Translations and content mining are permitted for academic research only. Personal use is also permitted, but republication/redistribution requires IEEE permission. See http://www.ieee.org/publications_standards/publications/rights/index.html for more information.
This article has been accepted for publication in a future issue of this journal, but has not been fully edited. Content may change prior to final publication. Citation information: DOI 10.1109/ACCESS.2018.2841321, IEEE Access
FIGURE 5. Modularity and R-Square acquired by the algorithms: fast greedy (a), fast unfolding (b), combo (c), LPA (d), walktrap (e) and infomap (f) for the networks of Shanghai with distance threshold variation.
FIGURE 6. Modularity and R-Square acquired by the algorithms: fast greedy (a), fast unfolding (b), combo (c), LPA (d), walktrap (e), and infomap (f) for the networks of Beijing with distance threshold variation.
VOLUME XX, 2017
9
2169-3536 (c) 2018 IEEE. Translations and content mining are permitted for academic research only. Personal use is also permitted, but republication/redistribution requires IEEE permission. See http://www.ieee.org/publications_standards/publications/rights/index.html for more information.
This article has been accepted for publication in a future issue of this journal, but has not been fully edited. Content may change prior to final publication. Citation information: DOI 10.1109/ACCESS.2018.2841321, IEEE Access
Combined with modularity, the regression fitness metric, R2, is ranked to determine suitable CDMs for generating communities motivated by POIs. Note that the node number in the Beijing network is 1.37 times greater than in the Shanghai network, and the gross mobility flows of Beijing are 4.87 times greater than that of Shanghai. This means the flow density in the Beijing network is 3.6 times greater than in the Shanghai network. As shown in Fig. 7, the network scale and flow density affect the value of modularity and R2, but does not affect the relative ranking (except for LPA and infomap, which will be explained with
the illustration of community detection results). Combo has the largest R2 for both networks. The median value is 0.3 for the Shanghai network and 0.48 for the Beijing network. This indicates the spatial community is correlated with POI features. Walktrap has the lowest modularity for both networks, but the regression fitness, R2, of the walktrap is just smaller than that of combo for both networks. Next, we analyze the community detection results and the logistic regression fitness combined with the spatial communities’ visualization.
FIGURE 7. Rank of modularity of each algorithm combined with R-Square for the Shanghai network(a) and Beijing network(b).
As shown in Fig. 5, infomap has larger modularity in the Shanghai network than other algorithms. This is explained with the visualization of the community detection results. As shown in Fig. 8(a-b), infomap has the largest community in the city center of Shanghai (Fig. 8(a)), which is not the same for Beijing (Fig. 8(b)). As shown in Fig. 8(c), LPA has the most communities in the city center of Shanghai, which is similar to the Beijing network (Fig. 8(d)). According to the algorithm theory of LPA, when a network has sparse edges, it always has a community much
larger than the other communities. The large proportion of nodes in the largest community leads to increased modularity, and the spatially separated communities lead to the poor regression fitness measured by R2. The mobility flow density of the Beijing network is 466, while it is just 130 for the spatial network of Shanghai. Thus, the community snapshots acquired by LPA and infomap are not stable, which is affected by the edge density or the mobility flow density.
FIGURE 8. Communities obtained using Infomap for the Shanghai network (a) contains the largest community in the city center, which is not contained in the Beijing network (b). LPA also acquires the largest community in the Shanghai network (c), and the largest community in the Beijing network (d).
To explain the regression results of walktrap and combo, we visualize the community detection results of VOLUME XX, 2017
both algorithms. Walktrap uses flow distance as the measure to merge communities for optimizing the 9
2169-3536 (c) 2018 IEEE. Translations and content mining are permitted for academic research only. Personal use is also permitted, but republication/redistribution requires IEEE permission. See http://www.ieee.org/publications_standards/publications/rights/index.html for more information.
This article has been accepted for publication in a future issue of this journal, but has not been fully edited. Content may change prior to final publication. Citation information: DOI 10.1109/ACCESS.2018.2841321, IEEE Access
modularity metric. The spatial communities with DT=16 and DT=17 identified by walktrap are shown in Fig. 9(a) and Fig. 9(b), respectively. This shows the algorithm merges community pair C1 and C2, C3 and C4, C5 and C6, C7 and C8 to C1+2, C3+4, C5+6, and C7+8. Small communities are
spatially scattered around the suburban area. While communities detected using combo are quite different, meaning even nodes in the suburban area are connected to the spatially close communities.
FIGURE 9. Communities detected by walktrap and combo for the spatial network of Shanghai. Communities detected by walktrap with DT=16 and DT=17 are shown in (a) and (b). Communities detected by combo with DT=16 and DT=17 are shown in (c) and (d).
Theoretically, to optimize modularity during the community detection process, combo adopts the strategies of merging, splitting and moving nodes between existing communities, meaning the algorithm considers each node in each iteration step. Thus, the community patterns found by combo are spatially connected, and the regression results are always optimal. With the worst modularity rank for both networks, the R2 value of walktrap ranks only behind combo. As shown in Section 3, walktrap adopts flow distance to merge sub-communities. Similarly, the correlation between two regions, featured by mobility flows and POIs, can also be measured using flow distance. This is the reason walktrap has better regression fitness despite having the worst modularity. For the transport network of Shanghai, with the increased distance threshold, all the community detection results show communities spread from the city center to suburban areas. However, communities in Beijing are scattered spatially with similar size. We find that Shanghai and Beijing are polycentric, communities in the spatial networks of Shanghai circle around the city center, and the communities in Beijing are decentralized. As shown in Fig. 10, we studied the correlation
VOLUME XX, 2017
between modularity and the regression fitness metric R2. R2 presents a positive linear correlation with the modularity of the algorithm combo. The median value of R2 is 0.3 for the Shanghai network using combo and 0.48 for the Beijing network. This further certifies that the community patterns can be explained from the perspective of POIs and communities are correlated with POIs according to the regression results. It was also found that spatial communities in Beijing are better matched to the POI feature. This means more mobility flows can better reflect the spatial communities driven by POIs. For both networks, the community detection results of LPA are affected by the network scale and edge density. Combo has better regression results with larger modularity, while Infomap has better regression results with smaller modularity. The regression result of walktrap is more stable with DT variation, and has a larger R2 value than that of fast unfolding. From the perspective of detecting spatial communities motivated by POIs in urban transport networks, combo is the best choice.
9
2169-3536 (c) 2018 IEEE. Translations and content mining are permitted for academic research only. Personal use is also permitted, but republication/redistribution requires IEEE permission. See http://www.ieee.org/publications_standards/publications/rights/index.html for more information.
This article has been accepted for publication in a future issue of this journal, but has not been fully edited. Content may change prior to final publication. Citation information: DOI 10.1109/ACCESS.2018.2841321, IEEE Access
FIGURE 10. Scatter plot of the modularity and R-Square of the six algorithms for the Shanghai network (a) and the Beijing network (b).
V. CONCLUSION
Researching the spatial communities of mobility flows in urban transport networks helps the understanding of urban movement and improving urban planning. Spatial communities in transport networks are rooted in the POI features distributed in the city area. This paper proposes to apply the consistency between network communities of mobility flows and urban POIs to compare the CDMs most suitable for detecting POI driven spatial communities. Mobility flows of the studied city are collected to construct transport networks with partitioned grids as nodes and the connections between them as links weighted by the mobility volume. POIs are mapped into nodes in the network and are used to characterize each node. Representative community detection algorithms are adopted to explore mobility communities. Then, we use stepwise logistic regression to estimate the consistency between mobility communities and POIs, with the POI feature as an independent vector and the community category as a dependent classification label. Taking the taxi systems of Beijing and Shanghai as case studies, experimental results show that the CDMs, combo and walktrap, could identify mobility communities that are explained by the POI features, and combo is presented as the best CDM. In the future, we will compare additional CDMs with our proposed model and employ other mobility data sources, such as cell-tower traces.
REFERENCES [1] [2]
[3]
[4]
[5]
[6]
[7]
[8]
[9]
[10]
ACKNOWLEDGMENT
This work was supported by the National Natural Science Foundation of China (61272412, 61571444), the Jilin Province Science and Technology Development Program (20160204021GX), and the Guangdong Natural Science Foundation (2016A030310072).
VOLUME XX, 2017
[11]
M. Barthélemy, "Spatial networks," Physics Reports, vol. 499, pp. 1-101, 2011. C. Zhong, S. M. Arisona, X. Huang, M. Batty, and G. Schmitt, "Detecting the dynamics of urban structure through spatial network analysis," International Journal of Geographical Information Science, vol. 28, no. 11, pp. 2178-2199, 2014. I. Walde, S. Hese, C. Berger, and C. Schmullius, "From land cover-graphs to urban structure types," International Journal of Geographical Information Science, vol. 28, no. 3, pp. 584-609, 2014. L. Alexander, S. Jiang, M. Murga, and M. C. González, "Origin–destination trips by purpose and time of day inferred from mobile phone data," Transportation Research Part C Emerging Technologies, vol. 58, pp. 240-250, 2015. https://doi.org/10.1016/j.trc.2015.02.018. M. E. J. Newman, The structure and function of complex networks. SIAM Rev 45: 167-256," vol. 45, pp. 167-256, 2003. doi: 10.1137/S003614450342480 N. Raghavan, R. Albert, and S. Kumara, "Near Linear Time Algorithm to Detect Community Structures in Large-Scale Networks", Physical Review E Statistical Nonlinear & Soft Matter Physics, vol. 76, no. 2, pp.036106, 2007. P. Pons and M. Latapy, "Computing communities in large networks using random walks," J.of Graph Alg. & App.bf, vol. 10, no. 2, pp. 284-293, 2005. S. Sobolevsky, R. Campari, A. Belyi, and C. Ratti, "General optimization technique for high-quality community detection in complex networks," Physical Review E Statistical Nonlinear & Soft Matter Physics, vol. 90, no. 1, pp. 012811, 2014. doi: 10.1103/PhysRevE.90.012811. Z. Du, B. Yang, and J. Liu, "Understanding the Spatial and Temporal Activity Patterns of Subway Mobility Flows," arXiv preprint arXiv:1702.02456, 2017. C. Zhong, E. Manley, S. M. Arisona, M. Batty, and G. Schmitt, "Measuring variability of mobility patterns from multiday smart-card data," Journal of Computational Science, vol. 9, pp. 125-130, 2015. X. Huang, Y. Zhao, J. Yang, and C. Zhang, "TrajGraph: Agraph-Based Visual Analytics Approach to Studying Urban Network Centralities Using Taxi Trajectory Data," IEEE Transactions on Computer Graphics, vol. 22, no. 1, pp. 160-169, 2015.
9
2169-3536 (c) 2018 IEEE. Translations and content mining are permitted for academic research only. Personal use is also permitted, but republication/redistribution requires IEEE permission. See http://www.ieee.org/publications_standards/publications/rights/index.html for more information.
This article has been accepted for publication in a future issue of this journal, but has not been fully edited. Content may change prior to final publication. Citation information: DOI 10.1109/ACCESS.2018.2841321, IEEE Access
[12]
[13]
[14]
[15]
[16]
[17]
[18]
X. Liu, "Inferring trip purposes and uncovering travel patterns from taxi trajectory data," Cartography & Geographic Information Science, vol. 43, no. 2, pp. 103-114, 2016. X. Liu, L. Gong, Y. Gong, and Y. Liu, "Revealing travel patterns and city structure with taxi trip data," Journal of Transport Geography, vol. 43, pp. 78-90, 2015. https://doi.org/10.1016/j.jtrangeo.2015.01.016. S. Grauwin, S. Sobolevsky, S. Moritz, I. Gódor, and C. Ratti, "Towards a Comparative Science of Cities: Using Mobile Traffic Records in New York, London, and Hong Kong" Springer International Publishing, vol.13, pp. 363-387, 2015. F. Simini, M. C. González, A. Maritan, and A. L. Barabási, "A Universal Model for Mobility and Migration Patterns," Nature, vol. 484, no. 7392, pp. 96-100, 2012. Y. Ren, M. Ercseyravasz, P. Wang, M. C. González, and Z. Toroczkai, "Predicting commuter flows in spatial networks using a radiation model based on temporal ranges," Nature Communications, vol. 5, no. 5, pp. 5347, 2014. doi: 10.1038/ncomms6347 Y. Zheng, L. Capra, O. Wolfson, and H. Yang, "Urban computing," in ACM Transactions on Intelligent Systems and Technology, vol. 5, no. 3, pp. 1-55, Sep. 2014. Y. Zheng, Y. Liu, J. Yuan, and X. Xie, "Urban computing with taxicabs," in International Conference on Ubiquitous Computing, 2011, pp. 89-98.
VOLUME XX, 2017
[19]
[20]
[21]
[22]
[23]
[24]
S. Sarkar, S. Chawla, S. Ahmad, J. Srivastava, H. Hammady, F. Filali, et al., "Effective Urban Structure Inference from Traffic Flow Dynamics," IEEE Transactions on Big Data, vol. 3, no. 2, pp. 181-193, 2017. J. Yuan, Y. Zheng, and X. Xie, "Discovering regions of different functions in a city using human mobility and POIs," in ACM SIGKDD International Conference on Knowledge Discovery and Data Mining, 2012, pp. 186-194. M. E. J. Newman and M. Girvan, "Finding and evaluating community structure in networks," Physical review. E, Statistical, nonlinear, and soft matter physics, vol. 69, no. 2 p. 026113, 2004. A. Clauset, M.E. Newman, and C. Moore, " Finding community structure in very large networks. ," Physical Review E Statistical Nonlinear & Soft Matter Physics, vol. 70, no. 6, pp. 066111, 2004. doi: 10.1103/PhysRevE.70.066111 V. D. Blondel, J. Guillaume, R. Lambiotte, and E. Lefebvre, "Fast unfolding of community hierarchies in large networks," J Stat Mech, arXivPrint, arXiv:0803.0476 2008. M. Rosvall and C. T. Bergstrom, "Maps of Information Flow Reveal Community Structure In Complex Networks," Proceedings of the National Academy of Sciences Usa, pp. 1118-1123, arXiv:0707.0609v2. 2007.
9
2169-3536 (c) 2018 IEEE. Translations and content mining are permitted for academic research only. Personal use is also permitted, but republication/redistribution requires IEEE permission. See http://www.ieee.org/publications_standards/publications/rights/index.html for more information.