Spearpoint M J. Comparative verification exercises on a probabilistic network model for building evacuation. Journal of Fire Sciences, Vol.27, No.5, p.409-430, ...
Spearpoint M J. Comparative verification exercises on a probabilistic network model for building evacuation. Journal of Fire Sciences, Vol.27, No.5, p.409-430, 10.1177/0734904109105373, 2009.
COMPARATIVE VERIFICATION EXERCISES ON A PROBABILISTIC NETWORK MODEL FOR BUILDING EVACUATION
M J Spearpoint
Department of Civil and Natural Resources Engineering, University of Canterbury, Christchurch, New Zealand
ABSTRACT
Functional testing of any model is a vital step in demonstrating that its predictive capabilities are working appropriately; correspond as expected to the circumstances being modelled and where further work should be directed. This paper presents a series of exercises used to substantiate the movement prediction capability of a probabilistic network-based evacuation model that is currently under development. Two simple component configurations and two previously available worked examples are used to demonstrate that the model performs adequately. Movement times from model predictions, hand calculations, alternative empirical methods and other computer models were compared for a range of typical occupant densities.
KEYWORDS: Evacuation, modelling, network, verification.
1
INTRODUCTION Fire engineers use evacuation models to assess buildings and their ability to provide sufficient time for occupants to egress safely in the event of a fire. There are various approaches to an evacuation analysis and different ways of representing building geometries, the occupants, their movement and their behaviour [1, 2]. Occupants can be assumed to be irrational entities or exhibit behavioural aspects accordingly. Buildings can be represented by their detailed geometry and dividing spaces into small grid cells or through the use of a network of nodes that represent each building space or sub-space.
Gwynne et al. [3] categorised four major factors that influence evacuation performance and suggest these be represented within an evacuation model, namely: configuration of building spaces, environmental factors inside the building, procedures implemented within the building, and the behaviour of the occupants. The influence of an occupant’s behaviour and their personal attributes such as physical, psychological and sociological characteristics will be affected by the other three major factors and an evacuation model should consider the behavioural factors rather than treating occupants as irrational entities.
Evacuation model validation involves a range of activities encompassing component testing and functional testing along with qualitative and quantitative comparisons [4]. Testing of components is carried out to verify that individual elements are working and produce expected results. Whilst component testing confirms that the model produces results that correspond to the algorithms implemented, functional testing must be undertaken to demonstrate that the model can produce results relevant to the circumstances being simulated. Quantitative validation involves the comparison of predictions produced by the model with values from other reliable sources, such as data from events such as trials or actual emergencies. Qualitative validation also needs to be carried out to compare predicted human behaviour in the model with the educated expectations of human behaviour in that situation. This validation can be quite subjective but is required to judge whether the model can exhibit realistic human behaviour. Results from other evacuation models or calculation methods can also be used as part of an assessment process similar to the study by Kuligowski and Milke [5].
2
EVACUATIONZ MODEL Background An evacuation model, referred to as EvacuatioNZ, has been under development at the University of Canterbury over the past several years. This model aims to use Monte Carlo methods to generate distributions of evacuation times through the use of input data distributions. The model uses the well established network method [6, 7] to determine the movement of people through a building. A coarse network approach to represent a building was selected to reduce computational times so that many repeat simulations could be completed in a reasonable timeframe. Building spaces in the model are represented by a network of nodes which are connected together by paths. Nodes are defined in terms of length and width dimensions and connections are defined in terms of their length and characteristics. Connections manage the effect of door constrictions and stair configurations on the people flow using the effective width concept [8]. A network has to have one or more ‘safe’ nodes which represent final destinations for people. Simulations are run over a defined time period or until all occupants had reached a ‘safe’ node. The simulation is broken into user specified time steps typically of 0.5 or 1 second duration.
People are represented as individuals with their own behavioural and personal attributes. A node network is populated with people as specified by the user. Nodes are able to accommodate as many people as the maximum occupant density allows. Apart from there being no limit on the number of people who can enter a ‘safe’ node, the maximum occupant density for all nodes in the network is specified for a given simulation. The model also accounts for the local queuing that occurs around a constriction such as a door and this is again specified for a given simulation.
Individual people are not explicitly positioned within a node and therefore at the start of the simulation they do not have a distance to the first connection that links to a neighbouring node. To overcome this limitation the model has the ability for the user to define what initial distance is given to an occupant. The user can select whether people are assumed to be at a minimum distance (i.e. adjacent to the connection such as a door), a variable distance using a randomly selected value up to the diagonal length of the node or the maximum distance taken to be the sum of the width and length of the node.
3
The model has the ability to employ the normal, log-normal, uniform, triangular or Weibull distributions shapes whenever a distribution can be specified for an input parameter. For example, distributions can be used for a person’s uncongested walking speed, the number of people starting in a node and a person’s pre-evacuation time. Distributions can be truncated at a specified upper and/or lower limit which is useful when using distributions that extend to infinity in one or both directions that could lead to inappropriate parameter selection.
Currently there is considerable debate concerning the equations published in the literature for people movement and whether these equations are relevant to today's ageing and less fit population [9]. It is not the intention of this work to determine whether these equations are still relevant although the model proposed here could be easily revised as new information becomes available. Movement speeds are based on the equations provided in the SFPE Handbook [10] and the Fire Engineering Design Guide (FEDG) [11] such that the relationship between speed of travel S (m/min) and occupant density Do (people per m2) is given by S = k t (1 − 0.266 Do )
(1)
for Do greater than 0.5 ppl/m2. For level corridors or doorways the FEDG [11] gives k t = 84.0 and the movement on stairs is affected by the riser and tread dimensions such that k t = 51.8(G R )
0.5
where G is the length of the stair tread going and R is the riser height of
each step. Uncongested movement speeds can be fixed by the user or determined by the use of a distribution.
When an occupant’s travel distance within a node reaches zero the model will determine whether they are assumed to be waiting in a queue. The formation of a queue will depend on the presentation rate at the constriction and it is possible that no queue will form. Flow times through constrictions consider the effective width concept where a defined specific door flow is used to determine the time in the queue. A person's movement speed is recalculated each time step so that the time to negotiate a constriction will vary during a simulation. A person can only move through a constriction into a path if the occupant density in the downstream node is less than the maximum occupant density specified in the model.
Finally, the model includes a range of exit behaviour strategies including those that require the minimum travel distance to a ‘safe’ node, those that are preferred by the building users 4
and those routes that are designated as fire exit paths. The choice of exit behaviour can be probabilistically assigned to groups of occupants and some ability to re-evaluate the choice during a simulation is included in the model by allowing occupants to fix their exit behaviour at the start of a simulation or re-select an exit behaviour as they enter a new node. Pre-evacuation times can be modelled through the use of distributions with the shape and statistics appropriately selected by the user.
Verification While the concept of a network model and the underlying equations are not unique, the model allows access to the computer code to develop ideas and add new functionality. An examination of the EvacuatioNZ model and a comparison with Simulex has been reported elsewhere [12] in which data from an unannounced trial evacuation at an industrial complex was compared to model simulations. The work showed encouraging results but noted that further development and validation of the EvacuatioNZ model is required before it could be used as a general design tool. However it is important that the underlying movement mechanics and behavioural aspects are tested in simple cases before applying the model to further complex scenarios. The purpose of this paper is to demonstrate that the movement mechanics, pre-evacuation times and simple behavioural aspects of the model are functioning as expected and these expectations are appropriate. Simple building network geometries are investigated such as flow through a door and the movement downstairs followed by a comparison of the model predictions with two hand calculation examples that are available in the literature.
As discussed by Gwynne et al. [4], ideally it would desirable to be able to compare an evacuation model against a number of repeated evacuation experiments each with sufficient detail to create the modelling inputs but such data sets are not guaranteed. Instead modelling exercises can be created to compare a model with other models, themselves subject to their own validation, which at least enables multiple runs and careful parameter variation to be carried out. This process is therefore not a direct validation of the model under examination and does not replace the need for continuous direct validation but can form part of an overall assessment of the model. Furthermore, a set of ‘standardised’ exercises also allows for a benchmark to which the model can be assessed against as it develops and could also be used to benchmark other models subject to some set range of parameters. 5
Although the model has the ability to use distributions for occupant parameters such as their maximum walking speeds and a selection of evacuation routes, scenarios used here focus on deterministic assessments. The maximum walking speed is fixed at 1.20 m/s, similar to the values suggested elsewhere [8, 11]. People have been assumed to follow routes that required the minimum travel distance to a ‘safe’ node. Nodes were populated with fixed numbers of people such that the occupant density was in the range typically used in the New Zealand Approved Document [13] as shown in Table 1.
Occupant density, Do [ppl/m2]
Typical occupancy
0.02
Storage, garages
0.10
Offices and staffrooms, shops for furniture
0.20
Showrooms, teaching laboratories
0.50
Reading or writing rooms
1.00
Bar sitting areas, areas without seating or aisles
1.30
Space with loose seating
1.80
Stadia and grandstands
2.60
Standing space
Table 1. Occupant densities suggested by the New Zealand Approved Document [13].
The maximum occupant density that gives reasonable results and the effects of using different specific door flows have been investigated and used as part of a process to calibrate the model. The effect on varying pre-evacuation statistics were also considered and the current model compared with results from simulations using the Simulex model [14] published elsewhere [15].
COMPONENT TESTING Door Flow Since the model allows for a range of parameters to be specified for node populations and door queues it was necessary to determine which values should be recommended before moving to more complex scenarios. In developing the model and the exercises there was an 6
element of iteration involved in selecting these parameters but this iterative process is difficult to present in a written paper. To test and calibrate the door flow component a series of simple room evacuation tests were conducted. Rectangular-shaped rooms were represented as a single node and the flow of occupants through a single door constriction to a ‘safe’ node was simulated. The dimensions of the room were based on the room sizes that have been used in previous investigations [15, 16] so that comparisons could be made. The boundary width for the door was taken to be 0.15 m [10] in all cases.
The first test used a 5 m wide by 8 m long room with a 1 m wide door. This geometry has been previously examined by Schadschneider et al. [16] and results from various models compared in their work. The EvacuatioNZ network simply consisted of a node to represent the room and a single path with a door leading to a ‘safe’ node. Occupants were positioned using the random starting distance option to represent their spatial distribution within the room. The tests examined the effect of selecting different specific flows for the door and variation of the maximum occupant density in a node. The maximum occupant density suggested in the New Zealand Approved Document is 2.60 ppl/m2 so that the model should be able to accommodate this density. Specific door flow rates from different researchers cited by Gwynne et al. [3] and Schadschneider et al. [16] are shown to be a function of occupant density and maximum values range from around 1.33 to 2.0 ppl/s/m effective width.
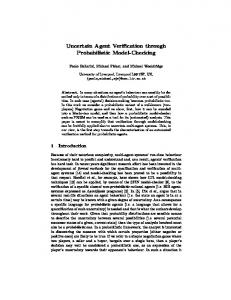
Total flow times were compared with values obtained from hand calculations and with simulations carried out elsewhere. Results in Figure 1 show flow times as a function of the specific flow in which the general trends from the EvacuatioNZ results are similar to other models. By adjusting the specific flow used in the EvacuatioNZ model, flow times similar to Simulex, buildingExodus and Predtechenskii or the SFPE Handbook can be achieved across a range of maximum occupant densities up to 2.75 ppl/m2. A maximum node density of 2.75 ppl/m2 allows for occupant densities that extend to greater than the maximum value suggested by the New Zealand Approved Document and, as noted by Pauls [17], occupant densities above around 2.5 ppl/m2 are rarely observed on stairs. Since the model generally follows the SFPE Handbook approach to calculating people movement and the specific flow of 1.33 ppl/s/m effective width gives a more conservative set of results these ‘calibrated’ values for the maximum node occupant density and specific flow were used as a baseline for the evaluation tests described in the remainder of this paper. 7
Figure 1. Total occupant flow times from a 5 x 8 m room (alternative model data reproduced from ref. 16).
The second door flow test was carried out to investigate the effect of varying a preevacuation time on the flow. The FEDG [11] suggests that the evacuation time is a function of a number of constituent times such that
tev = td + ta + to + ti + tt + tq .
(2)
where t d is the time from ignition until detection of the fire (by a building occupant or by an
automatic detection system), t a is the time from detection until an alarm is sounded, t o is the time from alarm until the time occupants make a decision to respond, t i is the time for occupants to investigate the fire, collect belongings, fight the fire, t t is the travel time, being the actual time required to traverse the escape route until a
place of safety is reached, including way-finding and t q is the queuing time at doorways or other obstructions.
8
Values for to and ti can be grouped together to represent the pre-evacuation time such that
t p = to + ti and t t and t q grouped into an overall movement time such that t m = t t + t q so the evacuation time can be expressed as
t ev = t d + t a + t p + t m .
(3)
In this exercise t d and t a were ignored as only the pre-evacuation and movement times are of interest thus t ev = t p + t m which gives a simplification of the evacuation time. The range of evacuation times will be influenced by the limits of the pre-evacuation time distribution and the movement time which will depend on the interaction with the pre-evacuation time distribution. The ability to account for a pre-evacuation distribution can be difficult using a hand calculation since it depends on the distribution shape and the values obtained from that distribution when a calculation is performed. Conservative evacuation times can be obtained by summing the longest calculated movement time and the upper limit of the distribution but a more sophisticated model is needed if the interactions are to be investigated in any detail. A square room with a floor area of 500 m2 was linked to a ‘safe’ node by a 1 m wide door. Various pre-evacuation times were simulated using a triangular distribution with the minimum value set to 0 s, the most likely values set to 1, 30, 120 and 480 s and maximum values for the distribution at twice the most likely values. A similar approach has been used previously [15] so that comparisons between the EvacuatioNZ model, hand calculations and the Simulex model could be carried out. Although pre-evacuation times are considered to be more realistically modelled as log-normal or Weibull distributions, the triangular distribution was used because this allows for a hand calculation analysis and also comparison with Simulex which does not include a log-normal or Weibull distribution. The range of possible hand calculation results was obtained from the movement times using the SFPE Handbook and the upper and lower limits of the triangular pre-evacuation distribution.
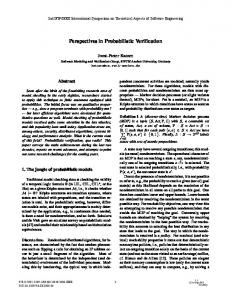
Ten EvacuatioNZ simulations were carried out for each scenario and the mean times are shown in Figure 2 along with the Simulex results taken from previous work [15] and the hand calculation limits. It would be expected that when the pre-evacuation time is low then the mean evacuation time would be controlled by the door flow whereas at longer preevacuation times the mean evacuation time is controlled by the pre-evacuation distribution statistics and would be somewhere close to the most likely statistic for a triangular distribution. At low pre-evacuation times EvacuatioNZ and Simulex show diverging results 9
where EvacuatioNZ gives longer flow times that correspond to the hand calculation as the occupant density increases. At longer pre-evacuation times results from EvacuatioNZ and Simulex fall within the hand calculation range but the two models again do not show a close match with one another.
2400
2400
Hand calculation range EvacuatioNZ Simulex
Hand calculation range EvacuatioNZ Simulex
2100
1800
Mean evacuation time (s
Mean evacuation time (s
2100
1500 1200 900 600
1800 1500 1200 900 600
300
300
0
0
0.0
0.5
1.0
1.5
2.0
2.5
3.0
0.0
0.5
2
1.5
2.0
2.5
3.0
Occupant density (ppl/m )
(a)
(b)
2400
2400 Hand calculation range EvacuatioNZ Simulex
2100
Hand calculation range EvacuatioNZ Simulex
2100
1800
Mean evacuation time (s
Mean evacuation time (s
1.0
2
Occupant density (ppl/m )
1500 1200 900
1800 1500 1200 900
600
600
300
300
0
0 0.0
0.5
1.0
1.5
2.0
2.5
3.0
2
0.0
0.5
1.0
1.5
2.0
2.5
3.0
2
Occupant density (ppl/m )
Occupant density (ppl/m )
(c)
(d)
Figure 2. Comparison of flow times from EvacuatioNZ, Simulex and hand calculations for a 500 m2 room with a 1 m wide door and most likely pre-evacuation times of (a) 1 s; (b) 30 s; (c) 120 s; (d) 480 s.
10
EvacuatioNZ gives results that generally follow the hand calculation range although simulation results at long pre-evacuation times with low occupant numbers are sensitive to the random distance of the individual occupants from the exit. Simulex generally shows quicker mean flow times and it is not surprising to see that there are variations between the results since the choice of a specific flow of 1.33 ppl/s/m for the EvacuatioNZ model has already been shown in Figure 1 to give longer times than Simulex. When compared to using the simplified hand calculation approach, both computer models invariably give mean evacuation times less than the conservative maximum values however the analysis shows that EvacuatioNZ does give results that are consistent with the expectations for these scenarios and the SFPE Handbook equations.
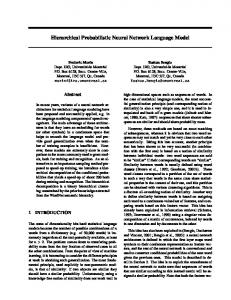
The effect of having pre-evacuation distributions on the flow of people through the door and the cumulative number of people reaching a ‘safe’ node using EvacuatioNZ was further examined for selected simulations and compared with the analytical assessment that has been presented previously [15]. Figure 3 gives results for an occupant density of 1.30 ppl/m2 (N = 650 people) which shows that there is a reasonable qualitative match between the EvacuatioNZ model and hand calculation prediction in terms of the shape of the curve. Similar results were obtained for other occupant densities and the shift in the results is due the lower specific flow employed by the model than the analytical assessment obtains.
11
Most likely values for triangular distribution 300 s
600 s
1200 s
Cumulative people through door / N
1.0 0.9 0.8 0.7 0.6 0.5 0.4 EvacuatioNZ results shown as bold lines
0.3 0.2
Calculated flows using ref. 15 shown as thin lines
0.1 0.0 0
600
1200
1800
2400
3000
Time (s)
Figure 3. Normalised cumulative number of people flowing through the door for different pre-evacuation distributions at an occupant density of 1.30 pp/m2 (N = 650).
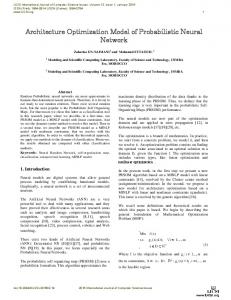
Stair Flow The ability of the EvacuatioNZ model to simulate the flow of people downstairs was tested by the use of four simple examples (Figure 4). In these examples the stair length was fixed to a typical length of 10 m and the width of the stairs was taken as 1 m or 3 m. In one of the test cases the effect of having handrails down the stairs was examined and the boundary layer width was taken as 0.09 m each side [8]. The width of the room at the beginning of the stair flights was also varied to illustrate the effect of a constriction on the flow as people entered the stairs. The occupant numbers in the starting room was varied so that the flow times could be compared with hand calculation results. Two stair tread and riser combinations were used to assess their effect on the flow. A tread of 0.25 m and a riser of 0.19 m and a tread of 0.33 m and a riser of 0.17 m were selected to cover the range of combinations suggested by Nelson et al. [10] that would result in maximum and minimum travel speeds. In each test the network consisted of three nodes (the starting room, stairs and exit) linked by two
12
connecting paths. Dimensions and properties of nodes and connections were defined according to the test scenario.
3.0 m
1.0 m
1.0 m
10 m
10 m
(a)
(b)
3.0 m
3.0 m
10 m
10 m
(c)
(d)
Figure 4. Stair flow test configurations (not to scale); (a) 3 m wide room with a 1 m wide stair; (b) 1 m wide room with a 1 m wide stair; (c) 3 m wide room with a 3 m wide stair; (d) 3 m wide room with a 3 m wide stair with two handrails.
Typically maximum stair flows of 60 people per minute per metre effective width are given in the literature and results from the simulations give comparable values. At low occupant densities the flows are less than 60 ppl/min/m since the stair is not used to capacity. Flows also varied with the selected riser and tread dimensions as these affect the travel speed on the stairs as recognised in the SFPE Handbook equations.
Figure 5 shows data for occupant numbers in the starting node of 1, 10, 100, 200, 260, 500 and the maximum number of people who can start in the room (1650 people for the 3 m wide 13
room and 550 people for the 1 m wide room). As would be expected, flows down the 3 m wide stair are faster than the narrower 1 m wide stair. The effect of handrails increases evacuation times by around 30% in the EvacuatioNZ model and 12% in the hand calculations for the larger occupant numbers. EvacuatioNZ gives flows slightly greater than the hand calculations as this is partly due to movement speeds on the stairs are dynamically determined as people enter and leave the stair node. This reduces the instantaneous occupant density hence allowing for faster movement particularly at the head and tail of the flow and this effect is further illustrated in the next test described in this paper. Overall there is a good match between EvacuatioNZ and the hand calculations for the three cases without handrails but further work might need to be undertaken to assess why the handrail scenario does not achieve similar results.
14
1000
Hand calculation (s)
Hand calculation (s)
1000
100
10
100
10 Tread = 0.25 m; Riser = 0.19 m Tread = 0.33 m; Riser = 0.17 m
Tread = 0.25 m; Riser = 0.19 m Tread = 0.33 m; Riser = 0.17 m
1
1 1
10 100 EvacuatioNZ (s)
1
1000
(a)
1000
(b) 1000
Hand calculation (s)
1000
Hand calculation (s)
10 100 EvacuatioNZ (s)
100
10
100
10
Tread = 0.25 m; Riser = 0.19 m Tread = 0.33 m; Riser = 0.17 m
Tread = 0.25 m; Riser = 0.19 m Tread = 0.33 m; Riser = 0.17 m
1
1 1
10 100 EvacuatioNZ (s)
1000
1
(c)
10 100 EvacuatioNZ (s)
1000
(d)
Figure 5. Comparison of hand calculation results and EvacuatioNZ simulations for four the stair configurations; (a) 3 m wide room with a 1 m wide stair; (b) 1 m wide room with a 1 m wide stair; (c) 3 m wide room with a 3 m wide stair; (d) 3 m wide room with a 3 m wide stair with two handrails.
WORKED EXAMPLE COMPARISONS Fire Engineering Design Guide Example The FEDG includes a simple worked example consisting of a room, a set of stairs and an exit. The building geometry and node network are shown in Figure 6. The stair tread was set to 0.28 m and the riser was 0.18 m in both the FEDG example and the appropriate connection in the EvacuatioNZ representation. In the FEDG example the room is populated
15
with 90 people, it is assumed that all of the people start to evacuate at the same time and that the people immediately reach the top of the stairs. The FEDG example also includes fixed detection and pre-evacuation times which have not been included for the comparison since it is only concerned with the movement time which is given as 185 s.
(a)
(b)
Figure 6. Room and stairs layout for the FEDG worked example; (a) original geometry [11]; (b) EvacuatioNZ node network representation.
For the EvacuatioNZ modelling the connection distance between the room and stairs was set to zero as a person’s initial travel distance was defined by the starting position condition. Therefore the effect of using the minimum, random and maximum initial starting position for the people was investigated using this example. The effect of specifying a maximum occupant density in the nodes and varying the specific door flows were further assessed using the FEDG example.
16
Results were obtained using the baseline specific door flow of 1.33 ppl/s/m effective width and a maximum node density of 2.75 ppl/m2. For the random starting position, ten simulations were carried out and total evacuation times were 260 ± 4 s. For the minimum and maximum positions the total evacuation times were 257 s and 275 s respectively. To illustrate the progress of the people through the network during a simulation Figure 7 shows the number of people in each node in which people have been assumed to be randomly distributed around the initial node. Between 5 and 53 s the stair node begins to fill to capacity and the first person reaches the exit node at 16 s. Note the change in gradient of people reaching exit as the stair occupant density decreases close to the end of the simulation. Hand calculations are not able to easily account for the dynamic change in occupant density. 100
Exit Stairs
90
Room
80
Number of people
70 60 50 40 30 20 10 0 0
30
60
90
120
150
180
210
240
270
Time (s)
Figure 7. EvacuatioNZ node use as a function of time for the FEDG example where people are randomly distributed in the starting room.
By using different maximum node densities and specific door flows the simulation evacuation time varies as shown in Figure 8 where the error bars show times obtained using the maximum and minimum initial starting position. As would be expected, evacuation times reduce with an increase in the specific door flow. Times are also affected by the maximum 17
node density as this affects the movement speed of the occupants in a node. EvacuatioNZ therefore corresponds to the hand calculations where total evacuation times are greater than the FEDG example using the baseline parameters.
350
Evacuation time [s]
300 250 200 150 100 FEDG Specific flow = 1.33 ppl/s/m
50
Specific flow = 1.50 ppl/s/m Specific flow = 2.00 ppl/s/m
0 0.75
1.00
1.25
1.50
1.75
2.00
2.25
2.50
2.75
3.00
2
Maximum node density [ppl/m ] Figure 8. Variation of EvacuatioNZ evacuation time for the FEDG example.
SFPE Handbook Example The SFPE Handbook in the chapter by Nelson et al. [10] gives an example nine storey building, shown in Figure 9(a), to illustrate the use of hand calculation methods. This example tests the ability of the EvacuatioNZ model to simulate large population flows for a simultaneous evacuation of all occupants down multi-level stairways which include landings at each level.
18
(a)
(b) Figure 9. SFPE Handbook example upper floor; (a) building geometry (adapted from ref. 10); (b) Equivalent node network.
The building was represented by a simple node network where each floor was created in a similar way as illustrated in Figure 9(b). Although room and stair dimensions were the same as given in the SFPE Handbook example where possible, details of the assumed geometry on each floor are sparse. It is not clear whether the rooms are subdivided or how the doors to the 19
corridor are assumed to be arranged. It was assumed that the nine doors were equally spaced along the corridor and were 0.91 m full width giving a total equivalent effective door width of 9 x [0.91 – (2 x 0.15)] = 5.49 m or an equivalent effective width of 5.49 + (2 x 0.15) = 5.79 m. It was further assumed that the rooms on each floor were subdivided into smaller equally sized spaces with a length of (24 – 2.4) / 2 = 10.8 m and a width of 91 / 9 = 10.1 m (excluding any wall thickness) so that occupants need only move a maximum diagonal distance of 11.9 m. Since people could move equally in either direction once they entered the corridor the maximum corridor travel was taken to be half the total length of the corridor.
The results from the EvacuatioNZ simulations using the baseline specific door flow of 1.33 ppl/s/m effective width and a maximum node density of 2.75 ppl/m2 were compared with the hand calculation result given in the SPPE Handbook. The SFPE Handbook calculates the total evacuation time in the order of 25 minutes (1500 seconds) depending on the complexity of the calculation method. The EvacuatioNZ simulations resulted in a total evacuation time of 1471 ± 3 s (around 24 mins 30 s) and EvacuatioNZ took just less than 30 s per simulation on a dual core Pentium PC.
The reasonable match between the simulation model and the SFPE Handbook calculation approach meant that it was useful to examine the evacuation time predicted by the model for the same multi-storey building using a range of occupant numbers. Occupant numbers on each floor where varied between one person per occupied room per floor up to 600 people per occupied room per floor (5400 people in total). Figure 10 plots the results of a comparison between the simulations and the predicted evacuation times that can be obtained from the simple calculation methods described by Pauls [17] for tall buildings with less than or greater than 800 people per metre of effective stair width. The mean total evacuation time from five EvacuatioNZ simulations for each occupant number varied by ±20 s at most and although results are generally longer than given by Pauls they follow the trend well.
20
3000 2700 2400
Total evacuation time (s)
2100 1800 1500 1200 900 600
EvacuatioNZ SFPE Handbook result
300
Pauls (> 800 people per metre effective stair width) Pauls (< 800 people per metre effective stair width)
0 0
100
200
300
400
500
600
People per floor
Figure 10. Comparison of total evacuation times from EvacuatioNZ and the method given by Pauls [17].
Further analysis of the SFPE scenario was carried out and a plot was made of when each corridor became clear and when all people from a floor reached the exits. Figure 11 shows the EvacuatioNZ results which is typical of an uncontrolled evacuation illustrated by Pauls [17]. The EvacuatioNZ model generally gives similar times between the clearance of a corridor and when occupants of that floor reach the exits. Floor 9 clears more quickly that floor 8 as there are no people from higher floors already blocking the landings and stairs.
21
9 8 7
Floor
6 5 4 3 2 1 0 0
300
600
900
1200
1500
Time (s)
Figure 11. EvacuatioNZ results for times that 300 people on each floor clear the corridor and reach the exits.
Clearly assumptions were needed to create the SFPE Handbook example in the EvacuatioNZ model and these assumptions might have impacted on the performance of the simulations. It was found from sensitivity studies that increasing the uncongested movement speed to 1.25 m/s as suggested by Pauls [17] and starting people in the corridor rather than in the rooms had little effect since the total evacuation time is predominately controlled by the stair width.
DISCUSSION As already noted elsewhere [3, 16], the literature indicates that there is not a single value for the maximum specific flow through a door or similar constriction. Depending of the selection of EvacuatioNZ model parameters, results can be obtained that can be compared to hand calculations and other computer models and the level of conservativeness varies with the selection of model parameters. There may be concern that the times predicted by the EvacuatioNZ model may not be sufficiently conservative but that concern could be extended 22
Simulex and buildingExodus based on Figure 1 and certainly appears to be the case when examining Pedgo and Aseri. On the other hand the previous Simulex analysis [15] and data in Figure 1 show maximum door flow rates of around 1.60 ppl/s for the 1 m wide door, equivalent to around 2.25 ppl/s/m effective width which is somewhat greater than the higher maximum flows cited by Gwynne et al. [3]. Using a maximum specific flow of 2.0 ppl/s/m with a maximum node density of 2.75 ppl/m2 would give a similar evacuation time from EvacuatioNZ when compared to the FEDG example (Figure 8). This paper shows how the EvacuatioNZ model can be adjusted to obtain a range of results but it does not seek to identify what is the ‘correct’ maximum specific flow as verification against real data needed. However it is recognised that the current version of EvacuatioNZ uses a fixed value for the maximum specific door flow set by the user but it would be fairly easy to modify the program to use a distribution for the specific door flow so that a different value was used each simulation. It would be further possible to have the distribution applied to each constriction in the scenario rather than having a global value as is the case with the current version of the model. These modifications would go someway to addressing the variation in specific flows quoted in the literature and likely lead to a wider spread of predicted evacuation times.
The validation of the model against a single trial evacuation [12] and the comparative verification presented in this paper do not mean the model is now necessarily ready for wider application. The comparative verification does allow for an examination of the performance of the model under a selected set of exercises and gives an indirect indication of the appropriateness of the results. Further studies are ongoing to examine the performance of the model under other circumstances and it is hoped that they will be published in due course. For example, work to find appropriate values for the maximum node occupant densities and specific flows which account for the effect of people that use a greater flow area such as wheelchair users is already underway and the ability to vary maximum node densities for different nodes or node families is also being considered. Similarly data from high-rise building evacuations and simulations are being used to assess and develop other aspects of the model.
23
CONCLUSIONS The results shown in this paper demonstrate that the EvacuatioNZ model is able to reasonably simulate building door and stair flows similar to other methods presented in the literature. Furthermore these elements can be combined together to create simple building networks that give evacuation times comparable to two examples presented in the literature. Simulations that represent uncontrolled evacuation of people in tall buildings were also found to give results similar to those obtained using an empirical method. These results give confidence that the EvacuatioNZ could be used to investigate more complex network arrangements.
The probabilistic and behavioural capabilities of the EvacuatioNZ model have not been examined in detail in this paper. The model development is an ongoing process and further qualitative and quantitative validations are necessary by comparing the results with trial and emergency data or results from other calculation methods. Some preliminary work has already been completed and will be reported at a future date.
ACKNOWLEDGEMENT The author would like to acknowledge the New Zealand Fire Service Commission for their support of the Fire Engineering programme at the University of Canterbury.
REFERENCES 1. Sime, J. D. (1994). Escape Behaviour in Fires and Evacuations. In: Design Against Fire: An Introduction to Fire Safety Engineering Design. Eds: Stallord, P. and Johnston, L., E & FN SPON, London. 2. Gwynne, S., Galea, E. R., Owen, M., Lawrence, P. J, Filippidis, L. (1999). A Review of the Methodologies Used in Evacuation Modelling. Fire and Materials, 23 (6), pp. 383-388. 3. Gwynne, S., Galea, E. R., Owen, M., Lawrence, P. J. (2002). An Investigation of the Aspects of Occupant Behavior Required for Evacuation Modeling. In: Evacuation From Fires, Vol. II. Ed: DeCicco, P. R., Baywood Publishing Company, Amityville, New York.
24
4. Gwynne, S., Galea, E. R., Lawrence, P. J, Owen, M., Filippidis, L. (1998). A Systematic Comparison of Model Predictions Produced by buildingEXODUS Evacuation Model and the Tsukuba Pavilion Evacuation Data. Journal of Applied Fire Science, 7 (3), pp. 235-266. 5. Kuligowski, E. D., Milke, J. A. (2005). A Performance-based Egress Analysis of a Hotel Building using Two Models. Journal of Fire Protection Engineering, Vol. 15 pp. 287-305. 6. Gwynne, S., Galea, E. R., Lawrence, P. J., Owen, M., Filippidis, L. (1999). A Review of the Methodologies used in the Computer Simulation of Evacuation from the Built Environment, Building and Environment, Vol. 34, 1999, pp. 741–749. 7. Kuligowski, E. D. (2005). Review of 28 Egress Models, NIST SP 1032, Workshop on Building Occupant Movement during Fire Emergencies. June 10-11, 2004, Gaithersburg, MD, (Eds: Peacock, R. D., Kuligowski, E. D.), pp.68-90. 8. Proulx, G. (2002). Movement of People: The Evacuation Timing. SFPE Handbook of Fire Protection Engineering (3rd ed.). National Fire Protection Association, Quincy, Massachusetts. 9. Pauls, J. (2007). Design Issues Within the Egress Stairway Enclosure, Proc. AEI Symposium on Egress Stairs in High-Rise Buildings, Architectural Engineering Institute of the American Society of Civil Engineers, New York. 10. Nelson, H. E., Mowrer, F. W. (2002). Emergency Movement, SFPE Handbook of Fire Protection Engineering (3rd ed.). National Fire Protection Association, Quincy, Massachusetts. 11. Spearpoint, M. J. (Ed.). (2008). Fire Engineering Design Guide (3rd ed.). CAENZ, Christchurch, New Zealand. 12. Ko, S. Y., Spearpoint, M. J., Teo, A. (2007). Trial Evacuation of an Industrial Premises and Evacuation Model Comparison. Fire Safety Journal, 42 (2), pp.91-105. 13. Compliance Document for New Zealand Building Code, Fire Safety Clauses. (2006). Department of Building and Housing, Wellington, New Zealand. 14. Thompson, P., Wu, J., Marchant, E. (1996). Modelling Evacuation in Multi-storey Buildings with Simulex. Fire Engineers Journal, November, pp. 7-11. 15. Spearpoint, M. J. (2004). The Effect of Pre-evacuation on Evacuation Times in the Simulex Model. Journal of Fire Protection Engineering, 14 (1), pp. 33-53.
25
16. Schadschneider, A., Klingsch, W., Klüpfel, H., Kretz, T., Rogsch, C., Seyfried, A. (2008). Evacuation Dynamics: Empirical Results, Modeling and Applications (in Encyclopaedia of Complexity and System Science, Ed: Meyers, B., Springer, Berlin. 17. Pauls, J. (1987). Calculating Evacuation Times for Tall Buildings. Fire Safety Journal, 12, pp. 213-236.
26